

Abstract
Background
Our objective was to investigate the association between hypertension and concurrent impairments in mobility, cognition and mood; the role of brain white matter hyperintensities in mediating this association; and the impact of these impairments on disability and mortality in elderly hypertensive individuals.
Methods and Results
Blood pressure, gait speed, digit symbol substitution test, and the Center for Epidemiologic Studies Depression Scale were measured yearly (1992-1999) on 4700 participants in the Cardiovascular Health Study (age: 74.7, 58% women, 17% African Americans, 68% hypertension, 3600 had brain MRI in 1992-93, survival data 1992-2005). Using latent profile analysis at baseline, we found that 498 (11%) subjects had concurrent impairments and 3086 (66%) were intact on all three measures. Between 1992 and 1999, 651 (21%) became impaired in all three domains. Hypertensive individuals were more likely to be impaired at baseline (Odds ratio 1.23, 95% CI (1.04-1.42), p=0.01) and become impaired during the follow-up (Hazard Ratio (HR)= 1.3, 95% Confidence Interval (CI): 1.02 to 1.66, p=0.037). Greater degree of white matter hyperintensities was associated with impairments in the 3 domains (p=0.007) and mediated the association with hypertension (p=0.19 for hypertension after adjusting for white matter hyperintensities in the model, 21% HR change). Impairments in the three domains increased subsequent disability with hypertension (p<0.0001). Hypertension mortality also was increased in those impaired (compared to unimpaired hypertensive individuals HR=1.10, 95% CI (1.04-1.17), p=0.004).
Conclusions
Hypertension increases the risk of concurrent impairments in mobility, cognition and mood, which increases disability and mortality. This association is partly mediated by microvascular brain injury.
Keywords: Hypertension, disability, white matter hyperintensities
Introduction
The adverse effect of hypertension on health and aging surpasses its effect on cardiovascular morbidity and mortality. Hypertensive individuals are at increased risk of dementia, depression, physical disability and falls.1-3 Hypertension may also affect performance on objective physical, cognitive and mood assessments in the absence of subjective symptoms.4-6 In a previous cross sectional study, we demonstrated that slow gait speed, executive cognitive impairment and depressive symptoms cluster together in older individuals.7 This cluster of impairments was strongly related to hypertension and disability.7 Since blood pressure itself may be affected by cognitive function and mood, the interpretation of our previous cross-sectional work is limited.8-9 In this study, we aimed at confirming our prior observation in a longitudinal study and to investigate the significance of having this triad of impairment on survival and functional loss using a large cohort, the Cardiovascular Health Study (CHS).
We hypothesized that low performance in the three domains of mobility, executive cognitive function and mood constitute a specific triad of impairments reflecting microvascular damage to the frontal subcortical regions of the brain.10 The mechanism by which hypertension may lead to these concurrent impairments is not known. Hypertension is associated with cerebral microvascular disease that manifests as white matter hyperintensities (WMH) in brain imaging.11 WMH were previously thought to be of little clinical significance. However, recent evidence suggests that they are associated with poor cognitive function, depressive symptoms and possibly gait disturbance.12-13 We therefore hypothesized that the pathway from hypertension to the concurrent impairments in the three domains is in part mediated by WMH.
The aims of this study were: (1) to investigate the association between hypertension and the triad of impairments in mobility, cognition (executive function and cognitive speed), and mood; (2) to elucidate the role of WMH in mediating this association between hypertension and the triad of impairments; and (3) to determine the impact of this triad of impairments on disability and overall mortality in hypertensive individuals.
Methods
Sample
CHS is a population-based longitudinal study of adults aged 65 years or older. The initial cohort of 5201 men and women was recruited from 1989 to 1990 and an additional 687 African Americans (AA) were recruited from 1992 to 1993. For this analysis, we considered the 1992-93 evaluation as the baseline data. For the longitudinal analysis, we used data through 1998-99. For the survival analysis, we used surveillance data through 2005.
Measures
Demographic (age in years, gender and race), weight (in kg), height (meter) and social measures (smoking history: current, past or never; educational level in years, and physical activity related energy expenditures in kcal) were collected at baseline (1992-93) and during the annual follow-up visits. Information from all medicine containers were transcribed and then coded into categories based on the therapeutic effect.14 Mobility was assessed by gait speed measured as the number of seconds it took the participant to walk a 15-foot course.15 The cognitive function measure used was the Digit Symbol Substitution Test (DSST).16 DSST assesses executive function, cognitive and psychomotor speed, and attention. Our rational for selecting this cognitive test is based on prior observations that executive function is more susceptible to hypertension compared to other cognitive domains.4, 17 Mood was assessed using the Centers for Epidemiologic Studies-Depression (CES-D) scale.18 Gait speed of less than 1 m/sec19 and a CES-D score of 16 or higher20 may reflect underlying disease. We used standardized z-score (mean of 0 and standard deviation (SD) of 1) calculated using the sample mean and SD of the DSST since limited data are available about norms. Functional abilities were collected using the Activities of Daily Living (ADL)21 and Instrumental Activities of Daily Living (IADL)22 self-reported questionnaires. Trained informants completed these questionnaires during the yearly interviews. Those who reported limitations in at least one item of ADL or IADL were considered to have functional loss.
Two seated blood pressure readings were obtained during each visit with the appropriate size cuff applied on the arm (the midpoint of the length of the bladder placed over the brachial artery, and the mid-height of the cuff was at heart level) and the bell of the stethoscope placed over the brachial artery. We defined hypertension at each visit as those with blood pressure >=140/90 mm Hg or who were receiving antihypertensive medications. Medical history was obtained by self report. Vascular events and diagnoses, including myocardial infarction, angina pectoris, coronary heart disease (CHD), congestive heart failure (CHF), and stroke, were adjudicated by an event committee.23-25 Internal validity of this adjudication process ranged from 60-100% depending on the diagnosis.24 Diabetes was defined as fasting blood glucose =>126 mg/dL or use of oral hypoglycemic medication or insulin. Survival data were collected during the annual visits and the 6-month telephone interviews through 6/30/2005 (13 years from baseline assessments). Additional data were collected from obituaries, medical records, proxy interviews, and death certificates. The event committee also adjudicated the death event. Survival data were 100% complete for the sample included in our analysis.
Brain Imaging
A total of 3600 subjects underwent brain MRI scans at baseline (1992-93). The MRI scanning protocol included sagittal T1-weighted localizer images and axial T1, spin density, and T2-weighted images. All axial images had 5-mm thickness and no interslice gaps.26 Imaging data were archived and sent to a single reading center for interpretation by neuroradiologists trained in the CHS protocol and without knowledge of the subjects' information. A standard protocol for analysis was described previously.27 In summary, the neuro-radiologists estimated the total volume of periventricular and subcortical white matter signal abnormalities on spin density-weighted axial images by comparing the findings on any particular scan with sets of complete scans that demonstrated successively increasing changes from none; barely detectable to extensive and confluent (grades 0-9). Abnormalities interpreted as representing areas of large- or small-vessel infarction were excluded from the grading of the white matter. The white matter grading was reliable, with an inter-reader intra-class correlation coefficient of 0.76 and an intra-reader coefficient of 0.89.28
Statistical Methods
We used latent profile analysis to classify individuals based on their performances on gait speed, DSST, and CES-D. The details of the latent profile analysis were described elsewhere.7 In summary, latent profile analysis is a model-based variant of traditional cluster analysis which assumes that the population consists of a number of unobserved subgroups termed latent profiles or groups based on the values of continuous variables (gait speed, DSST, and CES-D). We used this method to identify the number of groups in the population based on performance on the three measures. We performed a sequence of 5 latent profile models aggregating the baseline CHS population from 2 to 6 groups. Models dividing the sample into more than 6 groups included very few participants in some of the groups and therefore were not further considered. We selected the model that has the best fit statistics and clinical interpretability.29 Using this model, we identified the criteria for the performance range on gait speed, DSST, and CES-D (mean performance score ± 2 SD) in the group with concurrent impairments on all three measures (impaired group) and the group with the highest performance (control group) at baseline. Therefore, our definition of functional impairment was based on analytical methods rather than previously defined cut-off. These data-driven criteria allow us to identify those who have subclinical levels of impairments undetectable based on a predefined cut-offs. Based on these criteria, we assigned participants in CHS to either the impaired group or the control group at each visit between 1992 and 1999. Those who did not fit either range at baseline or during the follow-up were considered to belong to a “remainder” group. We used M-plus v.5 to perform the latent profile analyses.
For the analysis assessing the relation of hypertension with subsequent development of the triad of impairments, we limited our sample to those in the control group at baseline. We used Cox proportional hazard models in which we censored participants at the time they became impaired, were lost to follow-up or died. The predictor variable was hypertension (either at baseline or during the follow-up period prior to censorship) and the outcome variable was becoming impaired on all 3 measures of mobility, cognition and mood based on the criteria we identified in the latent profile analysis. Relevant covariates included in the models were possible confounders (age, gender, race, body mass index (BMI=weight/height2), educational level, physical activity (KCAL), and smoking status). These were included as time-dependent covariates if they changed during the follow-up period. Our criteria to select covariates in the multivariate analyses included: a statistically significant relationship with the outcome/predictor or prior evidence of being a confounder. We included stroke in all our models since we were interested in identifying the association independent of the relation between hypertension and stroke (baseline and during the follow-up).
We used Cox proportional hazard models for our survival analysis. We compared all-cause mortality of those who were in the impaired group to those who were in the control group in hypertensives and normotensives separately. We tested for interaction between hypertension and impairment status by including an interaction parameter in the model (hypertension × group). We also performed a four group comparison of all cause mortality: normotensive control group (reference group), hypertensive control group, impaired normotensive group and impaired hypertensive group. Survival models were adjusted for age, gender, race, BMI, smoking, stroke, diabetes, CHF and CHD. Kaplan Meir were also used to generate survival curves adjusted for covariates using the PHREG and GPLOT procedures. For the cross-sectional (prevalent) functional loss analyses, we used logistic regression. For the longitudinal analyses (incident functional loss), we used Cox-proportional Hazard models. We censored participants when they reported at least one limitation on the ADL or the IADL questionnaire (separate analysis for each), died, or lost to follow-up. We excluded those with limitations in ADL or IADL at baseline. All models were adjusted for age, gender, race, BMI, smoking, stroke, diabetes, CHD and CHF.
To test the role of WMH in this association, we performed the analysis with and without WMH as a covariate in the models. If the p-value became insignificant30 and the change in Hazard ratio (HR) was >10%31 after including WMH in the model, we considered WMH to be a mediator of the association. We used the model fit statistics (Partial Likelihood Function for the Cox Model, Akaike's information criterion and Schwarz Bayesian Criterion) to compare the models with and without WMH (lower values=better model fit).32 We also considered other vascular indicators including diabetes, CHF, and CHD as predictors. We provide these results in our online supplement. We used SAS, version 9.2 (Cary, NC) to conduct this analysis.
Results
Latent profile analysis
At baseline, 1188 of the 5,888 CHS participants had missing gait speed, DSST, or CES-D data leaving 4,700 to conduct our analysis. Those with missing data were older (75 vs. 79 years, p<0.0001), had lower BMI (26.91 vs. 26.16 kg/m2, p=0.02), and were more likely to be white (83% vs. 87%, p<0.0001) and men (46% vs. 55%, p=0.0006). Latent profile analysis showed that dividing the population into 6 groups based on their performances on the three measures (the 6-group model) provided the best-fit statistics (Table 1). According to this 6-group model shown in Table 1, group 1 had slow gait speed (mean (SD)=0.6(0.2) m/sec), low DSST scores (22.4(9.8); z score= -1.15(0.71)) and increased depressive symptoms (CES-D=10.7(1.6)) which we considered the impaired group. Group 3 had higher gait speed (1.0(0.2) m/sec) and DSST (z-score=0.39(0.82)) and lower CES-D scores (2.1(1.7)) which we considered the control group. The remaining four groups had either higher CES-D scores alone (group 4, 5 and 6) or combination slow gait and low DSST score (group 2). Those were considered the remainder group.
Table 1. Fit Statistics of the 2 to 6-group models and the performance means ± standard deviation in the best-fit model dividing the population into 6 groups.
| Fit Statistics of the models dividing the population into 2,3,4,5 or 6 groups** | ||||||
|---|---|---|---|---|---|---|
| 2 groups | 3 groups | 4 groups | 5 groups | 6 groups | ||
| Akaike's Information Criteria | 42751.499 | 42205.134 | 41890.988 | 41754.185 | 41586.804 | |
| Bayesian Information Criteria | 42816.821 | 42296.586 | 42008.569 | 41897.895 | 41756.643 | |
| Log likelihood | -22032.681 | -21365.749 | -21088.567 | -20927.494 | -20855.092 | |
| Likelihood ratio test k-1 versus k profiles | <0.0001 | <0.0001 | <0.0001 | 0.0097 | 0.0095 | |
| Performance scores mean ± standard deviation in the 6 groups based on the model dividing the population into 6 groups | ||||||
| Groups within the 6-profile model | ||||||
| 1§ | 2 | 3§§ | 4 | 5 | 6 | |
| DSST | 22.4±9.8 | 23.5±9.9 | 43.7±11.4 | 39±12.9 | 42±11.2 | 32.6±13.6 |
| DSST z-score | -1.15±0.71 | -1.08±0.71 | 0.39±0.82 | 0.04±0.93 | 0.26±0.81 | -0.42±0.98 |
| CES-D | 10.7±1.6 | 3.9±2 | 2.1±1.7 | 15±1.8 | 7.8±1.6 | 21.9±2.5 |
| Gait speed, m/sec | 0.6±0.2 | 0.6±0.2 | 1±0.2 | 0.8±0.2 | 0.9±0.2 | 0.7±0.3 |
DSST: Digit Symbol Substitution Test; CES-D: Center for Epidemiological Depression Scale
Performances in the 2 to 5 profile models are provided in an online supplement
Lower Model fit statistics indicate better fit of the data
Indicates the impaired group
Indicates the control group
As shown in Figure 1, 498 (11%) participants at baseline were in the impaired group, 3,086 (65%) in the control group and 1,116 (24%) in the remainder group. Of those in the control group at baseline, 651 (21%) individuals became new members of the impaired group during the follow-up period. Further details of the latent profile analysis are provided in online Table 1.
Figure 1.

Baseline and follow-up classification of the Cardiovascular Health Study population into the control, impaired, and remainder groups.
Table 2 provides the baseline characteristics of the three groups. Those in the impaired group were older and more likely to be women, African American, smokers, and more sedentary and have lower education. Follow-up duration was similar in the control and impaired groups.
Table 2. Baseline vascular and non-vascular characteristics of the control, impaired, and remainder groups in the Cardiovascular Health Study.
| Total sample (n=4,700) | Control Group (n=3,086) | Impaired Group (n=498) | Remainder Group* (n=1,116) | p-value | |
|---|---|---|---|---|---|
| Age (years), mean(SD) | 74.7 (5.2) | 74.1(4.7) | 76.7(5.9) | 74.9(5.4) | <0.0001 |
| Education(years) mean(SD) |
14.3(4.6) | 14.8(4.4) | 12.3(4.5) | 14.1(4.7) | <0.0001 |
| Men, n (%) | 1950(41.5) | 1056(46.6) | 201(40.4) | 693(35.8) | <0.0001 |
| African Americans, n (%) | 787(16.7) | 273(12.1) | 139(27.9) | 375(19.4) | <0.0001 |
| Body mass index (kg/m2), mean(SD) | 26.9(4.8) | 26.8(4.4) | 27.2(5) | 27(5.1) | 0.11 |
| Smoking, n (%) | 0.008 | ||||
| Former Smokers | 2063(44.7) | 1001(45) | 213(43.8) | 846(44.6) | |
| Current Smokers | 449(9.7) | 180(8.1) | 56(11.4) | 213(11.2) | |
| Energy expenditures (Kcal), median (Q1, Q3) | 842.5(270, 1890) | 975 (382, 2081) | 540 (120, 1432) | 613.8 (157, 1556) | <0.0001 |
| Vascular Factors | |||||
| Diastolic blood pressure (mm Hg), mean(SD) | 71.3(11.4) | 71.4(11) | 70.9(11.6) | 71.3(11.9) | 0.74 |
| Systolic blood pressure (mm Hg), mean(SD) | 136.3(21.5) | 135.5(20.8) | 138(22.8) | 136.9(21.9) | 0.021 |
| Cholesterol (mg(dl), mean(SD) | 208.8(38.5) | 207.9(36.2) | 208.8(39.9) | 209.9(40.9) | 0.24 |
| LDL (mg/dL), mean(SD) | 127.4(33.8) | 127.3(32.2) | 128.7(36.3) | 127.2(35) | 0.71 |
| Antihypertensive medication, n (%) | 2396(51) | 1068(47.2) | 310(62.3) | 1018(52.6) | <0.0001 |
| Hypertension, n (%) | 3162(67.5) | 1455(64.4) | 377(75.7) | 1330(69.0) | <0.0001 |
| Coronary heart disease, n (%) | 1020(21.7) | 443(19.6) | 145(29.1) | 432(22.3) | <0.0001 |
| Congestive heart failure, n (%) | 275(5.9) | 103(4.6) | 42(8.4) | 130(6.7) | <0.0001 |
| Stroke, n (%) | 236(5) | 60(2.7) | 52(10.4) | 124(6.4) | <.0001 |
| Diabetes Mellitus, n (%) | 716(15.9) | 293(13.3) | 110(23.7) | 313(17.1) | <0.0001 |
| Functional loss | |||||
| Based on ADL, n (%) | 487 (10%) | 171 (6%) | 115 (23%) | 201 (18%) | <0.0001 |
| Based on IADL, n (%) | 1177 (25%) | 571 (18%) | 200 (41%) | 397 (36%) | <0.0001 |
ADL: Activities of daily living; IADL: Instrumental activities of daily living
The other group is a combined group of all those who did not fit in either the impaired or the control groups.
Hypertension and the triad of impairments
The prevalence of hypertension was highest in the impaired group (75% vs 64% in the control group and 69% in the remainder group, p<0.0001). In addition, those in the impaired group at baseline had the highest systolic blood pressure (Table 2). The Cox proportional hazard model assumptions were satisfied in all our analyses. After adjusting for covariates at baseline, hypertension was independently associated with being impaired (Odds ratio (OR) 1.23, 95% CI (1.04-1.42), p=0.01) but not with being in the remainder group (OR 1.0, 95% CI (0.90-1.12), p=0.94).
When restricting our sample to the control group at baseline, 22% of the hypertensive individuals vs 14% of the normotensive individuals became new members of the impaired group (p=0.0002) over the follow-up period. Those who became new members of the impaired group also had the highest systolic blood pressure at baseline (mean systolic blood pressure± standard error (SE)= 135.4±0.5 mm Hg vs 137.4±0.8 mm Hg, p=0.021). Being hypertensive significantly increased the risk of becoming member of the impaired group (HR= 1.55, 95% CI: 1.22-1.98, p=0.0003; adjusted HR 1.29, 95% CI: 1.01-1.66, p=0.037). (Table 3) Similarly those with diabetes, CHF and CHD were at increased risk of becoming members of the impaired group. (Online Table 2)
Table 3. The association of hypertension and cerebral white matter hyperintensities with the risk of being in the impaired group in CHS.
| Unadjusted | Adjusted* | |||
|---|---|---|---|---|
| HR | P-VALUE | HR | P-VALUE | |
| Separate Models | ||||
| Hypertension (n=3086) | 1.55, 95% CI (1.22-1.98) | 0.0003 | 1.29, 95% CI (1.01-1.66) | 0.037 |
| WMH grade (n=2325) | 1.17, 95% CI (1.1-1.24) | <.0001 | 1.09, 95% CI (1.02-1.16) | 0.007 |
| Combined Models** | ||||
| Hypertension (n=2325) | 1.37, 95% CI (1.05-1.8) | 0.0184 | 1.2, 95% CI (0.91-1.59) | 0.19 |
| WMH grade (n=2325) | 1.16, 95% CI (1.09-1.24) | <.0001 | 1.08, 95% CI (1-1.16) | 0.04 |
WMH: Cerebral white matter hyperintensities; HR: Hazard Ratio; CI: Confidence interval
Adjusted for: age, gender, ace, education, cigarette smoking, stroke, and total KCALS physical activity (antihypertensives in the WMH model).
Combined models include WMH and hypertension in the same model whereas separate model includes only WMH or hypertension. Fit statistics were better for the hypertension model with WMH: Partial Likelihood: 7654 vs 5685; Akaike's information criterion: 7672 vs 5822 and Schwarz Bayesian Criterion : 7711 vs 5705
The mediating role of white matter hyperintensities
A total of 3600 participants underwent brain MRI scans in 1992-93: 319 in the impaired group and 2325 in the control group. At baseline, those in the impaired group had a greater degree of WMH (mean (SD) =2.68(1.6), compared to those in the control group (2.08 (1.3)) and the remainder group (2.46(1.6), p<0.0001). Both cross-sectionally and longitudinally, those with greater WMH grade were at increased risk of being or becoming members of the impaired group (cross-sectionally: adjusted OR 1.19, 95% CI: 1.07-1.52, p=0.0009; longitudinally: HR=1.09, 95% CI: 1.02-1.16, p=0.007). (Table 3)
As shown in Table 3, when we included WMH in the final multivariate Cox proportional hazard model relating hypertension to the triad of impairment, the association was no longer statistically significant. Hypertension HR without WMH was 1.29, 95% CI: 1.01-1.66, p=0.037 whereas hypertension HR with WMH 1.20, 95% CI: 0.91-1.16, p=0.19 (change in HR was 21%). WMH was significantly associated with the triad of impairments in that model (p=0.04). This was not true for diabetes, CHD, or CHF. (Online Table 2)
Disability and mortality analyses
As shown in Table 4, hypertensive individuals with impairments in the three domains were at increased risk of having ADL and IADL functional loss both cross-sectionally and longitudinally after adjusting for relevant covariates (p<0.0001).
Table 4. Cross-sectional and longitudinal risk of ADL and IADL functional loss related to being in the impaired group compared to the control group by hypertensive status in CHS.
| Normotension (n=1525) | Hypertension (n=3162) | |||
|---|---|---|---|---|
| Prevalent | Odds Ratio* | P Value | Odds Ratio* | P Value |
| ADL | 2.54, 95% (1.54,4.18) | 0.0002 | 2.85, 95% CI (2.14,3.80) | <0.0001 |
| IADL | 1.68, 95% (1.20, 2.36) | 0.0027 | 2.22, 95% CI (1.82-2.70) | <0.0001 |
| Normotension (n=676) | Hypertension (n=3537) | |||
| Incident | Hazard Ratio* | P Value | Hazard Ratio* | P Value |
| ADL | 1.39, 95% CI (1.15-1.68) | 0.0008 | 1.40, 95% CI (1.29-1.51) | <0.0001 |
| IADL | 1.40, 95% CI (1.14, 1.72) | 0.001 | 1.43, 95% CI (1.32, 1.55) | <0.0001 |
ADL: Activities of daily living; IADL: Instrumental activities of daily living.
Models adjusted for age, gender, race, BMI, smoking, stroke, diabetes, CHD, CHF
Over the study period, 15,673 person-year data were available for the mortality analysis. Of those who were members of the impaired group at baseline or during the follow-up, 61% died by the year 2005 (13 years after baseline) compared to 44% of those in the control group and 53% in the remainder group (p<0.0001). Hypertension mortality differed by impairment status. After adjusting for demographics, BMI, stroke, smoking, diabetes, CHD and CHF, the triad of impairments was associated with higher mortality only in the hypertensive group (Adjusted HR= 1.10, 95% CI (1.02-1.16), p=0.009 in the hypertensive individuals vs 1.04, 95% CI (0.87-1.24), p=0.67 in normotensive individuals). Further, survival analysis shown in Figure 2 demonstrated that being hypertensive and impaired in the three domains was associated with the worst survival compared to being unimpaired hypertensive or impaired normotensive (p-value for interaction between hypertension and being impaired in the three domains<0.0001). Finally, we did not identify a significant interaction by age or sex on any of our outcomes.
Figure 2.
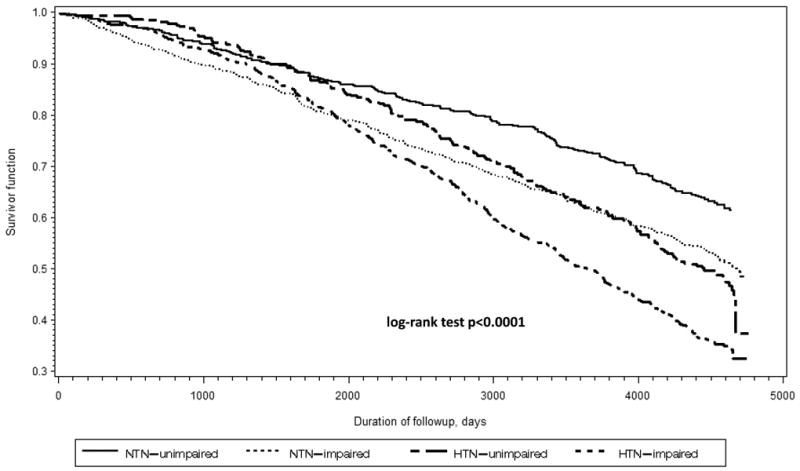
Kaplan-Meier survival curves for the impaired and control hypertensive and normotensive groups in the Cardiovascular Health Study.
Footnote: NTN: Normotension; HTN: hypertension. Adjusted for age, gender, race, body mass index, stroke, smoking history, coronary heart disease, and congestive heart failure
Discussion
The results of this study demonstrate that hypertensive individuals are at increased risk of developing a triad of impairments in mobility, cognition, and mood. Close to a quarter (22%) of hypertensive individuals will eventually develop these impairments. The mechanism by which hypertension may lead to these impairments is likely to be mediated by WMH seen commonly on brain imaging in hypertensives. There are significant increases in disability risk and mortality in hypertensive individuals who have these concurrent impairments.
Hypertensive individuals are at increased risk of disability, independent of other cardiovascular complications and stroke.5 The course of progression from being disability free to being disabled is not known. This study suggests that this course includes developing mild and subclinical impairments in mobility and cognitive function as well as mild depressive symptomatology. Our study supports that executive function and cognitive speed are particularly susceptible to hypertension effects. A recent study by Elias, et al using pathway analysis suggests that cognitive impairment in the executive function domain plays an important role in the hypertension-disability relation.33 Our study further adds gait speed and mildly increased depressive symptomatology in combination with mild decline in executive function and cognitive speed to this pathway from hypertension to disability.
This study suggests that hypertension is only associated with impairments in the three domains but not with impairments in 2 domains (the remainder group). We also observed that the increase in mortality associated with the three domain impairments was only significant in hypertensive individuals. Taken together, these suggest that the triad of impairments in the three domains may constitute a hypertension-specific pattern of impairment and disability. Hence, measuring performance on the domains of mobility, cognition and mood is an important part of the assessment of the hypertensive older adult. In addition, those in the impaired group were more likely to be women, African Americans, smokers, more sedentary, and have lower education. These characteristics also increase overall risk and should also be integrated into the overall management of hypertensive older adults. The ranges of performance on the three tests do not correspond to predefined cut-offs and may represent subclinical impairments. Therefore, those that score 0.8 m/sec or less on the gait speed, 42 or less on the DSST and greater than 7 on CES-D are at increased risk of functional loss and need closer monitoring.
The mechanisms by which hypertension may lead to these impairments are not known. In this study we found that cerebral microvascular disease may play a role. This was specific to hypertension but not other vascular factors such as CHD, CHF or diabetes. WMH identified on brain imaging are closely related to hypertension 34 and have been linked with mobility impairments, dementia, and depression.12-13, 35 The pathogenesis of WMH is poorly understood but is likely related to ischemic demyelination and gliosis36 resulting from areas of hypoperfusion to watershed areas.37 The frontal and subcortical regions of the brain, which provide central control for mobility, cognition and mood, are especially vulnerable to hypertension.10 Therefore, the observation that WMH may mediate the relation between hypertension and the triad of impairments has a biological basis. It also provides additional evidence that hypertension significantly affects brain function even in the absence of clinical stroke or other cardiovascular complications.
Future research in this area should focus on determining the role of lowering blood pressure on both the development and amelioration of these concurrent impairments and future disability. Emerging but controversial evidence suggests that antihypertensive use decreases the risk of cognitive decline.38 Therefore, future clinical trials of antihypertensive agents should consider including measures of the three domains.
A limitation to our study is the generalizability to younger age groups with hypertension since CHS participants were 65 years or older. We included DSST that may not reflect global cognitive function but reflects executive function and psychomotor speed. In our prior study, only measures of executive function clustered with gait speed and mood in their relation to hypertension.7 Therefore, our rational for including this measure is justified by our hypothesis that hypertension affects cognitive speed through its cerebrovascular damaging effects. Another limitation is the relatively old age of the MRI scan and the use of a semi-quantitative global measure of WMH. Nevertheless, we found a strong association between the available measure and the triad of impairments. We have included treated hypertensives in our hypertension group. Since the effect of antihypertensives is likely to be protective on the measures of mobility, cognition and mood,39-40 we believe that including antihypertensive medication in the hypertension definition actually may decrease the degree of the association between hypertension and the phenotype. We have adjusted the WMH analysis for antihypertensive exposure.
Conclusion
Hypertensive individuals are at increased risk of developing a triad of impairments in mobility, cognition, and mood. The mechanism by which hypertension may lead to these impairments is likely to be mediated by WMH seen commonly on brain imaging in hypertensive individuals. Hypertensive individuals who have these concurrent impairments have significant increases in disability and mortality risks. Assessment of mobility, cognition and mood are important aspects of managing the elderly hypertensive patient. Future clinical trials that assess the effect of treating hypertension on these impairments are needed to identify interventions that prevent the higher degree of disability seen in hypertensive individuals.
Supplementary Material
Online Table 1: Mean performances and standard deviation of the groups in the 2,3,4,5,6-profile models of the latent profile analysis in the Cardiovascular Health Study
Online Table 2: Associations of other vascular factors with being impaired in the three domains of mobility, cognition and mood and the role of white matter hyperintensities
Online Table 3: The association of hypertension and cerebral white matter hyperintensities with the remainder group
Acknowledgments
Funding Sources: Dr. Hajjar was supported by grant K23 AG030057 from NIA. Dr. Yang was supported by the NARSAD Young Investigator Award and the Harvard Medical School Livingston Award. Dr. Lipsitz holds the Irving and Edyth S. Usen and Family Chair in Geriatric Medicine at Hebrew SeniorLife and was supported by grants P01-AG004390, R37-AG25037, and P50 AG005134 from NIA. CHS was supported by contract numbers N01-HC-85079 through N01-HC-85086, N01-HC-35129, N01 HC-15103, N01 HC-55222, N01-HC-75150, N01-HC-45133, grant number U01 HL080295 from NHLBI, with additional contribution from NINDS. Dr. Newman was supported by the CHS-ALL STAR Grant R01 AG 023629. A full list of principal CHS investigators and institutions can be found at http://www.chs-nhlbi.org/pi.htm.
Footnotes
Conflict of Interest Disclosures: None.
Contributor Information
Ihab Hajjar, Assistant Professor of Medicine, Harvard Medical School, Associate Scientist, Institute for Aging Research/Hebrew SeniorLife, Division of Gerontology, Beth Israel Deaconess Medical Center, 1200 Centre Street, Boston MA, Tel: 617-3638179, Fax: 617-3638936, ihabhajjar@hrca.harvard.edu.
Lien Quach, Research Associate, Institute For Aging Research, Hebrew SeniorLife.
Frances Yang, Institute for Aging Research, Hebrew SeniorLife; Division of Gerontology, Department of Internal Medicine, Beth Israel Deaconess Medical Center; Instructor in Medicine, Harvard Medical School.
Paulo H. M. Chaves, Assistant Professor, Center on Aging and Health, Johns Hopkins University, Baltimore, MD, USA.
Anne B. Newman, Professor of Epidemiology and Medicine, University of Pittsburgh.
Kenneth Mukamal, Associate Professor of Medicine, Harvard Medical School, Beth Israel Deaconess Medical Center.
Will Longstreth, Jr., Professor of Neurology, University of Washington.
Marco Inzitari, Pere Virgili Hospital, Institute on Aging of the Autonomous University of Barcelona, Barcelona, Spain.
Lewis A. Lipsitz, Professor of Medicine, Harvard Medical School, Chief of Gerontology, Beth Israel Deaconess Medical Center, Usen Co-Director of the Institute for Aging Research, Hebrew SeniorLife.
References
- 1.Terry PD, Abramson JL, Neaton JD. Blood pressure and risk of death from external causes among men screened for the multiple risk factor intervention trial. Am J Epidemiol. 2007;165:294–301. doi: 10.1093/aje/kwk014. [DOI] [PubMed] [Google Scholar]
- 2.Dilsaver SC, Coffman JA. Hypertension and depression: Question of a causal relationship persists. Psychiatry Res. 1988;26:115–117. doi: 10.1016/0165-1781(88)90093-5. [DOI] [PubMed] [Google Scholar]
- 3.Reinprecht F, Elmstahl S, Janzon L, Andre-Petersson L. Hypertension and changes of cognitive function in 81-year-old men: A 13-year follow-up of the population study “Men born in 1914”, sweden. J Hypertens. 2003;21:57–66. doi: 10.1097/00004872-200301000-00014. [DOI] [PubMed] [Google Scholar]
- 4.Saxby BK, Harrington F, McKeith IG, Wesnes K, Ford GA. Effects of hypertension on attention, memory, and executive function in older adults. Health Psychol. 2003;22:587–591. doi: 10.1037/0278-6133.22.6.587. [DOI] [PubMed] [Google Scholar]
- 5.Hajjar I, Lackland DT, Cupples LA, Lipsitz LA. Association between concurrent and remote blood pressure and disability in older adults. Hypertension. 2007;50:1026–1032. doi: 10.1161/HYPERTENSIONAHA.107.097667. [DOI] [PMC free article] [PubMed] [Google Scholar]
- 6.Grewen KM, Girdler SS, Hinderliter A, Light KC. Depressive symptoms are related to higher ambulatory blood pressure in people with a family history of hypertension. Psychosom Med. 2004;66:9–16. doi: 10.1097/01.psy.0000106881.60228.16. [DOI] [PubMed] [Google Scholar]
- 7.Hajjar I, Yang F, Sorond F, Jones RN, Milberg W, Cupples LA, Lipsitz LA. A novel aging phenotype of slow gait, impaired executive function, and depressive symptoms: Relationship to blood pressure and other cardiovascular risks. J Gerontol A Biol Sci Med Sci. 2009;64:994–1001. doi: 10.1093/gerona/glp075. [DOI] [PMC free article] [PubMed] [Google Scholar]
- 8.Licht CM, de Geus EJ, Seldenrijk A, van Hout HP, Zitman FG, van Dyck R, Penninx BW. Depression is associated with decreased blood pressure, but antidepressant use increases the risk for hypertension. Hypertension. 2009;53:631–638. doi: 10.1161/HYPERTENSIONAHA.108.126698. [DOI] [PubMed] [Google Scholar]
- 9.Launer LJ, Masaki K, Petrovitch H, Foley D, Havlik RJ. The association between midlife blood pressure levels and late-life cognitive function. The honolulu-asia aging study. Jama. 1995;274:1846–1851. [PubMed] [Google Scholar]
- 10.Pugh KG, Lipsitz LA. The microvascular frontal-subcortical syndrome of aging. Neurobiol Aging. 2002;23:421–431. doi: 10.1016/s0197-4580(01)00319-0. [DOI] [PubMed] [Google Scholar]
- 11.Dufouil C, de Kersaint-Gilly A, Besancon V, Levy C, Auffray E, Brunnereau L, Alperovitch A, Tzourio C. Longitudinal study of blood pressure and white matter hyperintensities: The eva mri cohort. Neurology. 2001;56:921–926. doi: 10.1212/wnl.56.7.921. [DOI] [PubMed] [Google Scholar]
- 12.Whitman GT, Tang Y, Lin A, Baloh RW. A prospective study of cerebral white matter abnormalities in older people with gait dysfunction. Neurology. 2001;57:990–994. doi: 10.1212/wnl.57.6.990. [DOI] [PubMed] [Google Scholar]
- 13.O'Brien JT, Firbank MJ, Krishnan MS, van Straaten EC, van der Flier WM, Petrovic K, Pantoni L, Simoni M, Erkinjuntti T, Wallin A, Wahlund LO, Inzitari D. White matter hyperintensities rather than lacunar infarcts are associated with depressive symptoms in older people: The ladis study. Am J Geriatr Psychiatry. 2006;14:834–841. doi: 10.1097/01.JGP.0000214558.63358.94. [DOI] [PubMed] [Google Scholar]
- 14.Psaty BM, Lee M, Savage PJ, Rutan GH, German PS, Lyles M. Assessing the use of medications in the elderly: Methods and initial experience in the cardiovascular health study. The cardiovascular health study collaborative research group. J Clin Epidemiol. 1992;45:683–692. doi: 10.1016/0895-4356(92)90143-b. [DOI] [PubMed] [Google Scholar]
- 15.Andriacchi TP, Ogle JA, Galante JO. Walking speed as a basis for normal and abnormal gait measurements. J Biomech. 1977;10:261–268. doi: 10.1016/0021-9290(77)90049-5. [DOI] [PubMed] [Google Scholar]
- 16.Spreen O, Strauss E. A compendium of neuropsychological tests : Administration, norms, and commentary. New York: Oxford University Press; 1991. [Google Scholar]
- 17.Pugh KG, Kiely DK, Milberg WP, Lipsitz LA. Selective impairment of frontal-executive cognitive function in african americans with cardiovascular risk factors. J Am Geriatr Soc. 2003;51:1439–1444. doi: 10.1046/j.1532-5415.2003.51463.x. [DOI] [PMC free article] [PubMed] [Google Scholar]
- 18.Schein RL, Koenig HG. The center for epidemiological studies-depression (ces-d) scale: Assessment of depression in the medically ill elderly. Int J Geriatr Psychiatry. 1997;12:436–446. [PubMed] [Google Scholar]
- 19.Cesari M, Kritchevsky SB, Penninx BW, Nicklas BJ, Simonsick EM, Newman AB, Tylavsky FA, Brach JS, Satterfield S, Bauer DC, Visser M, Rubin SM, Harris TB, Pahor M. Prognostic value of usual gait speed in well-functioning older people--results from the health, aging and body composition study. J Am Geriatr Soc. 2005;53:1675–1680. doi: 10.1111/j.1532-5415.2005.53501.x. [DOI] [PubMed] [Google Scholar]
- 20.Beekman AT, Deeg DJ, Van Limbeek J, Braam AW, De Vries MZ, Van Tilburg W. Criterion validity of the center for epidemiologic studies depression scale (ces-d): Results from a community-based sample of older subjects in the netherlands. Psychol Med. 1997;27:231–235. doi: 10.1017/s0033291796003510. [DOI] [PubMed] [Google Scholar]
- 21.Katz S, Ford AB, Moskowitz RW, Jackson BA, Jaffe MW. Studies of illness in the aged. The index of adl: A standardized measure of biological and psychosocial function. Jama. 1963;185:914–919. doi: 10.1001/jama.1963.03060120024016. [DOI] [PubMed] [Google Scholar]
- 22.Lawton MP, Brody EM. Assessment of older people: Self-maintaining and instrumental activities of daily living. Gerontologist. 1969;9:179–186. [PubMed] [Google Scholar]
- 23.Price TR, Psaty B, O'Leary D, Burke G, Gardin J. Assessment of cerebrovascular disease in the cardiovascular health study. Ann Epidemiol. 1993;3:504–507. doi: 10.1016/1047-2797(93)90105-d. [DOI] [PubMed] [Google Scholar]
- 24.Ives DG, Fitzpatrick AL, Bild DE, Psaty BM, Kuller LH, Crowley PM, Cruise RG, Theroux S. Surveillance and ascertainment of cardiovascular events. The cardiovascular health study. Ann Epidemiol. 1995;5:278–285. doi: 10.1016/1047-2797(94)00093-9. [DOI] [PubMed] [Google Scholar]
- 25.Psaty BM, Kuller LH, Bild D, Burke GL, Kittner SJ, Mittelmark M, Price TR, Rautaharju PM, Robbins J. Methods of assessing prevalent cardiovascular disease in the cardiovascular health study. Ann Epidemiol. 1995;5:270–277. doi: 10.1016/1047-2797(94)00092-8. [DOI] [PubMed] [Google Scholar]
- 26.Longstreth WT, Jr, Bernick C, Manolio TA, Bryan N, Jungreis CA, Price TR. Lacunar infarcts defined by magnetic resonance imaging of 3660 elderly people: The cardiovascular health study. Arch Neurol. 1998;55:1217–1225. doi: 10.1001/archneur.55.9.1217. [DOI] [PubMed] [Google Scholar]
- 27.Price TR, Manolio TA, Kronmal RA, Kittner SJ, Yue NC, Robbins J, Anton-Culver H, O'Leary DH. Silent brain infarction on magnetic resonance imaging and neurological abnormalities in community-dwelling older adults. The cardiovascular health study. Chs collaborative research group. Stroke. 1997;28:1158–1164. doi: 10.1161/01.str.28.6.1158. [DOI] [PubMed] [Google Scholar]
- 28.Longstreth WT, Manolio TA, Arnold A, Burke GL, Bryan N, Jungreis CA, Enright PL, O'Leary D, Fried L. Clinical correlates of white matter findings on cranial magnetic resonance imaging of 3301 elderly people: The cardiovascular health study. Stroke. 1996;27:1274–1282. doi: 10.1161/01.str.27.8.1274. [DOI] [PubMed] [Google Scholar]
- 29.McCutcheon AL. Latent class analysis. Newbury Park: SAGE Publications; 2002. [Google Scholar]
- 30.Judd CM, Kenny DA, McClelland GH. Estimating and testing mediation and moderation in within-subject designs. Psychol Methods. 2001;6:115–134. doi: 10.1037/1082-989x.6.2.115. [DOI] [PubMed] [Google Scholar]
- 31.Greenland S. Modeling and variable selection in epidemiologic analysis. Am J Public Health. 1989;79:340–349. doi: 10.2105/ajph.79.3.340. [DOI] [PMC free article] [PubMed] [Google Scholar]
- 32.Burnham KP, Anderson DR. Model selection and multimodel inference : A practical information-theoretic approach. New York: Springer; 2002. [Google Scholar]
- 33.Elias MF, Dore GA, Davey A, Robbins MA, Elias PK. From blood pressure to physical disability: The role of cognition. Hypertension. 2010;55:1360–1365. doi: 10.1161/HYPERTENSIONAHA.110.149823. [DOI] [PubMed] [Google Scholar]
- 34.de Leeuw FE, de Groot JC, Oudkerk M, Witteman JC, Hofman A, van Gijn J, Breteler MM. Hypertension and cerebral white matter lesions in a prospective cohort study. Brain. 2002;125:765–772. doi: 10.1093/brain/awf077. [DOI] [PubMed] [Google Scholar]
- 35.Sierra C, Coca A. White matter lesions and cognitive impairment as silent cerebral disease in hypertension. ScientificWorldJournal. 2006;6:494–501. doi: 10.1100/tsw.2006.99. [DOI] [PMC free article] [PubMed] [Google Scholar]
- 36.Fazekas F, Kleinert R, Offenbacher H, Schmidt R, Kleinert G, Payer F, Radner H, Lechner H. Pathologic correlates of incidental mri white matter signal hyperintensities. Neurology. 1993;43:1683–1689. doi: 10.1212/wnl.43.9.1683. [DOI] [PubMed] [Google Scholar]
- 37.Pantoni L. Pathophysiology of age-related cerebral white matter changes. Cerebrovasc Dis. 2002;13 2:7–10. doi: 10.1159/000049143. [DOI] [PubMed] [Google Scholar]
- 38.Brust JC. Antihypertensive therapy and cognition: More questions than answers. Stroke. 2006;37:1146. doi: 10.1161/01.STR.0000217638.48894.bc. [DOI] [PubMed] [Google Scholar]
- 39.Ried LD, Tueth MJ, Handberg E, Kupfer S, Pepine CJ. A study of antihypertensive drugs and depressive symptoms (sadd-sx) in patients treated with a calcium antagonist versus an atenolol hypertension treatment strategy in the international verapamil sr-trandolapril study (invest) Psychosom Med. 2005;67:398–406. doi: 10.1097/01.psy.0000160468.69451.7f. [DOI] [PubMed] [Google Scholar]
- 40.Skoog I, Lithell H, Hansson L, Elmfeldt D, Hofman A, Olofsson B, Trenkwalder P, Zanchetti A. Effect of baseline cognitive function and antihypertensive treatment on cognitive and cardiovascular outcomes: Study on cognition and prognosis in the elderly (scope) Am J Hypertens. 2005;18:1052–1059. doi: 10.1016/j.amjhyper.2005.02.013. [DOI] [PubMed] [Google Scholar]
Associated Data
This section collects any data citations, data availability statements, or supplementary materials included in this article.
Supplementary Materials
Online Table 1: Mean performances and standard deviation of the groups in the 2,3,4,5,6-profile models of the latent profile analysis in the Cardiovascular Health Study
Online Table 2: Associations of other vascular factors with being impaired in the three domains of mobility, cognition and mood and the role of white matter hyperintensities
Online Table 3: The association of hypertension and cerebral white matter hyperintensities with the remainder group