

Abstract
We present an interferometric imaging technique that permits local measurement of mechanical properties and nanomechancial motion in small living animals. Measurements of nanomechanical properties and spatially resolved pulsations of <60 nm were recorded for the developing eye of a living zerbrafish (Danio rerio) embryo, an important model organism. We also used magnetic microreflectors to conduct contact nanomechanical indentation measurements of the stiffness of the embryonic eye.
Keywords: interferometry, zerbrafish, nano-mechanical properties
We are interested in developing nanoimaging techniques that can be used to study living animals. As a biological research tool, higher animals reproduce human disease etiology much more faithfully than do cultured cell lines. However, existing nano-measurement techniques, particularly nanomechanical techniques, are much more amenable to studying cells than to interrogating living animals, for a variety of reasons. Existing single-point measurement approaches, such as AFM,1–4 NOSM,5 and high-magnification particle tracking microrheology,6 are simply too slow to adequately capture dynamics on the nanometer scale over areas on the order of square millimeters. On the other hand, wide-field magnetic/optical bead tracking methods,7, 8 struggle to produce sufficient accuracy (tens of nanometers 8, 9) at low magnifications (<50×).
In this study we have investigated the bio-mechanical properties of the developing eye of a living zebrafish embryo (Danio rerio). We have chosen this model system because it is scientifically relevant but experimentally challenging: The zebrafish eye is an important system for the study of human eye development and disease,10–12 and thus mechanical data are useful; however, the embryo is only millimeters in length and the individual tissues are micron-sized, and measurements on live specimens are ideally conducted in liquid. In this study eyes of ~200 μm in diameter were studied.
Morphogenesis and tissue development is typically investigated in live zebrafish by conventional optical microscopy, augmented by genetic manipulation to mark specific organs, tissues, or cell types by color or fluorescence. 10, 11 Mechanical measurements of the eye relevant to human ocular disease (internal pressure, structural rigidity, tissue segmentation, etc.) are not easily extended to the embryonic zebrafish due to methodological limitations. Previous biomechanical techniques used to study zerbrafish have required micro-dissection apparatus, coupled with a contact probe to make point measurements on the specimen.13 This approach is invasive, technically complex and time consuming.
In this article we report direct measurement of nanoscale motion of the developing eye of live zerbafish embryos immersed in liquid. Using our recently developed interferometric probe technology, whose application thus far has been limited to thin films and single cells,14–16 we quantitatively detected nanometer-amplitude pulsatile movement of the eye surface in response to pressure from the beating heart of the live fish. We are able to construct a spatial map of these pulsations, which revealed regional variation due to differences in tissue compliance. We used magnetic microreflectors to conduct contact indentation measurements of the stiffness of the embryonic eye. We found that the tissue has Young’s modulus 1.17 (+/− 0.2) kPa, similar to that of mammalian cells,14 and is elastic within the range of forces applied. These measurements were simple to conduct, rapid and non-damaging to the specimen. This new approach should greatly enhance the study of biological mechanics of living higher animals, small animal analogs of human diseases and other model organisms, including zebrafish.
Results and Discussion
The anatomy of a developing zebrafish eye is presented in Figure 1a. The major structures in the embryonic zebrafish eye, the cornea, lens, retina and iris are all formed by three days post fertilization (dpf). The embryonic eye is formed from several embryonic cells types and the resulting structure produced is a complex assembly of tissue lamina and substructures.17
Figure 1.
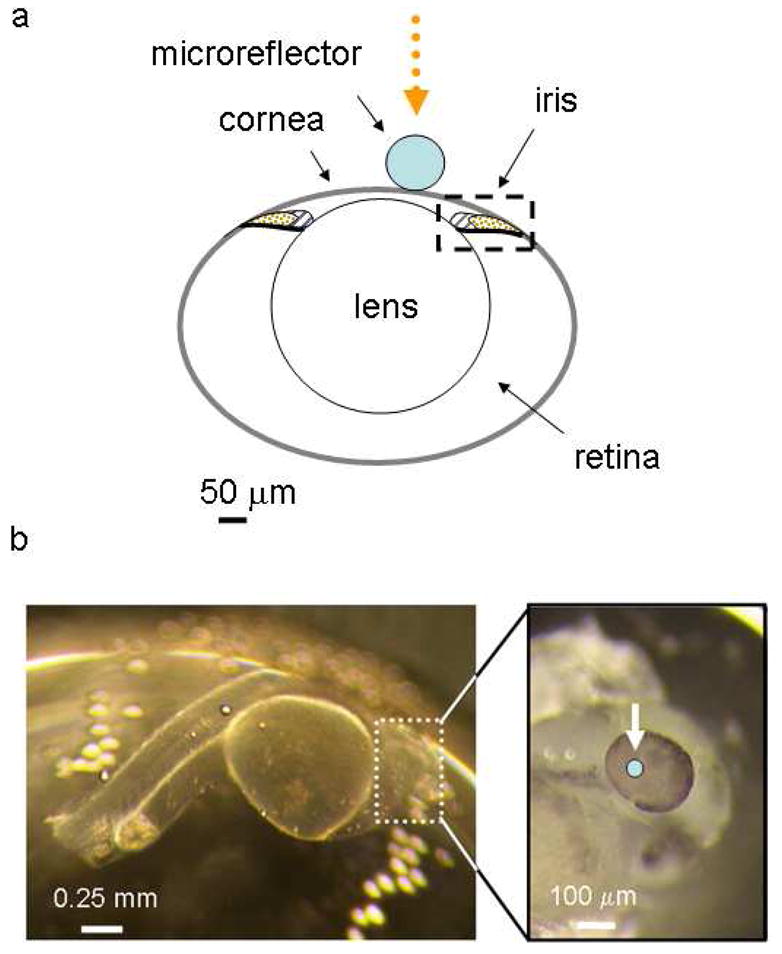
(a) Anatomy of a 3 day old (3 dpf) embryonic zebrafish eye,17 showing relative size and location of microreflector. (b) Bright field image of the 2 day old (2 dpf) zerbrafish embryo. The arrow marks the position on the eye where a spherical microreflector was placed.
Our first measurements were conducted on a 2-day old (2 dpf) zerbrafish embryo immersed in saline buffer that contained 100 μm curare to suppress skeletal muscle motion. Prior to observing the specimen, a 60 μm diameter nickel microreflector was placed on the fish’s eye using a pipette. Once in place, the microreflector was imaged interferometrically by translating the objective axially over a distance +/− 30 microns from the apex of the sphere (Figure 1b).
Our interferometric microscope consists of a 20X, 0.28NA Michelson interference objective that allows for the observation of not only lateral features with typical optical resolution (1.16 μm for the 20× objective) but also height dimensions of reflective objects below the scale of one nanometer. The Michelson interferometer is composed of a beam splitter, reference mirror and compensating fluid cell to adjust for optical path differences induced by fluid surrounding the specimen (Figure 2a).
Figure 2.

(a) Schematic of experiment. (b) A time series plot of the displacement of the microreflector located on the zebrafish embryo’s eye. (c) Plot of motion amplitude from serial measurements taken from 0 to 150 minutes.
Axial movement of the microsphere was detected from the modulation of the interference fringes during the vertical scan (see Supplementary Materials for detail). The microsphere, and thus the underlying eye structure, was moving sinusoidally up and down with an amplitude of roughly 50 nm RMS (200 nm peak to trough), at a frequency of 2.25 hertz (Figure 2b). This is the exact frequency of the heartbeat measured for this specimen by video microscopy prior to the experiment. We interpret this motion as deformation of the eye structure due to intraocular pressure pulsations associated with cardiovascular flows. Ocular pressure pulses of this nature have been observed in humans using conventional tonometry techniques18 but to our knowledge have never before been observed in a live animal embryo due to their small amplitude. The amplitude of this pulsatile motion of the eye was recorded over 150 minutes, during which it increased to a maximum of 55 nm RMS over 60 minutes, then decreased linearly to less than 10 nm RMS by the end of the experiment (Figure 2c). This slow decline in cardiovascular dynamics is largely due to the toxicity of the curare present in the buffer.
In our next experiment we measured the mechanical properties of the eye of a 5-day old (5 dpf) embryo by nanoindentation. To accomplish this, a ferromagnetic nickel microreflector was placed on the surface of the eye and a series of increasing force steps were applied by an external magnetic field. Figure 3a, shows a bright field image (left) and the corresponding topographic image (right) of the eye, with the microreflector in place. The circumferential reflective pigment is clearly visible in both images, and similarly the unpigmented pupil appears black.
Figure 3.
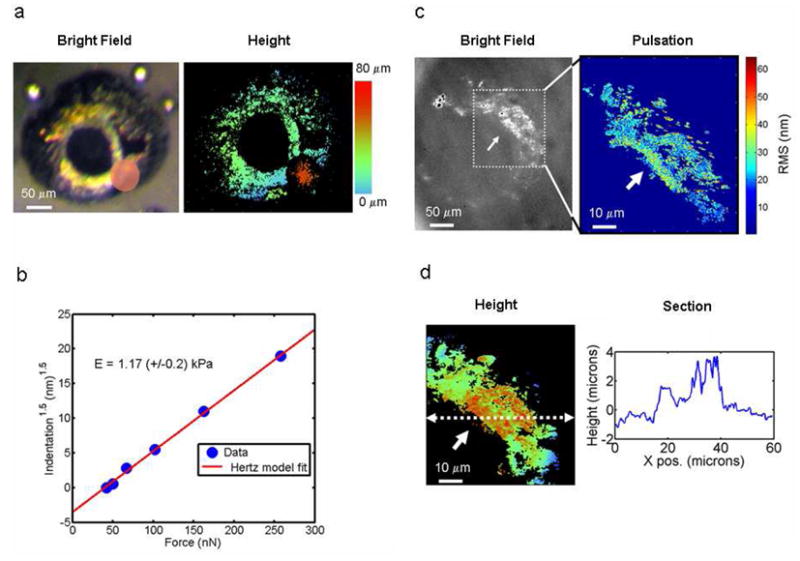
(a) A bright field image of a 5 day old (5 dpf) zebrafish embryo’s eye (left) and the corresponding interferometric image (right), showing the position of the magnetic microreflector used for indentation measurements. (b) Indentation versus applied force plot for the microreflector, showing the linear fit for the spherical Hertz model (R2 = 0.98) and the calculated Young’s modulus (E). (c) Left panel shows a bright field image of a 5 day old eye, with a region of interest outlined. Right panel depicts the amplitude map of pulsations at the heartbeat frequency (~3 hertz), taken from the region of interest. (d) A height image of the region of interest as determined by interferometry, along with a cross-section (left).
Figure 3b, shows the indentation of the magnetic probe as a function of increasing force, over a rage of 50 to 275 nanoNewtons. In this case indentation is measured as the position of the apex of the sphere versus the reflective membrane within the eye. This ensured that indentation into the eye was measured versus deflection of the entire eyeball. The local Young’s modulus (E) was calculated using the Hertz model for a spherical indenter:19
| (1) |
Where F is the force applied to the microsphere, R is the sphere radius, δ is the deflection into the surface, and the Poisson’s ratio for the eye surface is taken to be 0.4. The indentation data fit the Hertz model well (R2 > 98%), indicating a Young’s modulus of 1.17 (+/−0.2) kPa.
In our final experiment, we directly measured ocular pulsations in a 5-day old (5 dpf) zerbrafish embryo by interferometrically imaging tissues within the eye itself. This was possible because the older embryo developed patches of reflective pigmentation in the iris region of the eye. The cells in this area (box in Fig. 1a) contain gold and sliver pigmented inclusions known as irridosomes (silver in color) and pteranosomes (gold).17 Figure 3c, shows a bright field image of the specimen’s eye (left image), where these reflective tissues are clearly visible. We produced a map of the pulsation amplitude in this area (right image), which showed a distinctly non-uniform pattern of deformation. The edge of the tissue closer to the pupil possessed an RMS amplitude of 40–60 nm while the outer regions had an amplitude less than half of this value. This indicates regions of varying compliance within the developing eye, quite possibly indicating boundaries of different tissue types known to intersect in this region of the eye;17 it could also signify the location of a developing capillary. The lower panel of Figure 3d, contains a topographical image of the same region, taken simultaneously with the deformation map. The overall ellipsoidal curvature of the eye is apparent in Figs. 3a and d; notably the tissue is not smooth but contains raised islands could be developing pigmentation speckles; the position, size, color and shape of the structures is consistent with this interpretation. Interestingly, nothing in the topographic structure was obviously indicative of the more compliant regions present in the deformation map. We note that these measurements are taken on tissue roughly 10 microns below the transparent outer surface of the eye (see Fig 1a). This type of mechanical data cannot be collected with contact probes such as AFM or optical tweezers.
Conclusions
Determining nanomechanical properties of the developing zebrafish eye can have great utility in the study of the genetics of eye development and disease.10, 11 For instance, intraocular pressure (IOP) is used extensively in clinical studies of human eye disease, and as a screening tool for glaucoma.20 While we did not measure IOP directly in the zebrafish embryo, in principle it could be determined from our deformation and elasticity measurements using the correct mathematical model. Further, ocular pulsations themselves continue to be studied in humans as a diagnostic or precursor to eye disease. A decrease in ocular pulse has been related to carotid insufficiency,18, 21 severity and progression of glaucoma,20, 22 diabetic retinopathy23 and other disease states. Our technique would allow a never before possible comparison of these human studies to this important model organism, the zerbafish.
Methods
Zebrafish
Zebrafish were maintained in aquarium systems on a 14L:10D photoperiod at 28 °C. Fish were fed twice daily with flake food and live brine shrimp. All procedures were carried out in accordance with the Animal Care and Use Committees of UCLA. Following breeding, embryos were collected and placed in an incubator at 28 °C. Embryonic zebrafish (2–5 days post fertilization) were anesthetized in MS-222 (150mg/L) and tethered with viscous polymer onto the observation slide with the eyes facing upward. 100 μM curare prepared in regular fish saline (containing in mM: 134 NaCl; 2.9 KCl; 2.1 CaCl2; 1.2 MgCl2; 10 Hepes, with pH adjusted 7.8 with NaOH and an osmolarity of 295 mOsm) was added to immobilize the preparation. All chemicals were purchased from Sigma-Aldrich, Inc. (St. Louis, MO, USA).
Mechanical Imaging Interferometry
This method has been described in detail elsewhere;14 we will summarize it here briefly. The system is an interferometric microscope, based on a modified Veeco NT 9300 Optical Profiler, that images the specimen through liquid, and tracks the position of spherical, magnetic microreflectors resting on the specimen surface. It is in principle an optical microscope with a 20X 0.28NA Michelson interference objective that allows for the observation of not only lateral features with typical optical resolution (1.16 μm for the 20× objective) but also height dimensions of reflective objects below the scale of one nanometer. The Michelson interferometer is composed of a beam splitter, reference mirror and compensating fluid cell to adjust for optical path differences induced by fluid surrounding the specimen. During each measurement, the objective head is scanned vertically down from just above the top of the measured surface so that each point in the volume passes through focus. The interferometer is aligned so that the interference intensity distribution along the vertical scanning direction has its peak (best fringe contrast) at approximately the best focus position. The vertical-axis position of each microreflector is determined as the location of the coherence peak within the scan. This type of measurement is known as vertical scanning interferometry (VSI).
Displacement Measurments
When working with a narrowband LED source, the same NT9300 system creates more fringes on both sides of focus. A static object scanned through focus will exhibit at each camera pixel fringes with constant spacing. However, vertical motion of the object introduces variation in the fringe spacing. This variation can be measured and then converted to the motion/displacement of the object.24 For this type of characterization, the motion is sampled and calculated by each pixel at the camera frame rate (i.e., 60 frames per second). For motion calculations we applied an algorithm based on the algorithms normally used in phase shifting interferometry,25 which allow for detection of very minute motions, on the order of a few up to roughly one hundred nanometers (given illumination at 530 nm). Motions on this order of amplitude and frequencies up to a few Hz can be measured every tens of milliseconds over a period of a few seconds at the time. The dynamic upper limit is a function of camera frame rate and can be arbitrarily increased by use of a high speed camera, though this was not needed in the present study.
Microspheres
Micron-sized elemental nickel microspheres were obtained from Duke Scientific as a dry powder. An aqueous suspension of microspheres was diluted 4:1 with 0.2% poly-L-lysine aqueous solution (Sigma) to inhibit aggregation and improve adhesion to the specimen. This microreflector solution was shaken vigorously before application to suspend any sedimented particles and reduce aggregates. Ten microliters of the suspension was pipetted onto the specimen and the microspheres allowed to settle for 1 minute.
Magnetic force control
Magnetic force was applied to the microspheres using a cylindrical rare earth magnet, oriented axially along the vertical direction below the sample. The force applied to the nickel microspheres as a function of magnet position was calibrated using a magnetized micro-cantilever of known spring constant.
Acknowledgments
The work was partially supported by NIH grant HD 053767 to D. Kozlowski and N. Wayne. The authors thank Y. Dong for zerbrafish maintenance.
References
- 1.Mahaffy RE, Park S, Gerde E, Kas J, Shih CK. Quantitative Analysis of the Viscoelastic Properties of Thin Regions of Fibroblasts Using Atomic Force Microscopy. Biophys J. 2004;86:1777–1793. doi: 10.1016/S0006-3495(04)74245-9. [DOI] [PMC free article] [PubMed] [Google Scholar]
- 2.Hinterdorfer P, Baumgartner W, Gruber HJ, Schilcher K, Schindler H. Detection and Localization of Individual Antibody-Antigen Recognition Events by Atomic Force Microscopy. Proceedings of the National Academy of Sciences of the United States of America. 1996;93:3477–3481. doi: 10.1073/pnas.93.8.3477. [DOI] [PMC free article] [PubMed] [Google Scholar]
- 3.Lal R, John SA. Biological Applications of Atomic-Force Microscopy. American Journal of Physiology. 1994;266:C1–C21. doi: 10.1152/ajpcell.1994.266.1.C1. [DOI] [PubMed] [Google Scholar]
- 4.Rief M, Gautel M, Oesterhelt F, Fernandez JM, Gaub HE. Reversible Unfolding of Individual Titin Immunoglobulin Domains by Afm. Science. 1997;276:1109–1112. doi: 10.1126/science.276.5315.1109. [DOI] [PubMed] [Google Scholar]
- 5.Sommer AP, Franke RP. Near-Field Optical Analysis of Living Cells in Vitro. J Proteome Res. 2002;1:111–114. doi: 10.1021/pr025501t. [DOI] [PubMed] [Google Scholar]
- 6.Weihs D, Mason TG, Teitell MA. Bio-Microrheology: A Frontier in Microrheology. Biophys J. 2006;91:4296–4305. doi: 10.1529/biophysj.106.081109. [DOI] [PMC free article] [PubMed] [Google Scholar]
- 7.Fabry B, Maksym GN, Shore SA, Moore PE, Panettieri RA, Butler JP, Fredberg JJ. Signal Transduction in Smooth Muscle - Selected Contribution: Time Course and Heterogeneity of Contractile Responses in Cultured Human Airway Smooth Muscle Cells. Journal of Applied Physiology. 2001;91:986–994. doi: 10.1152/jappl.2001.91.2.986. [DOI] [PubMed] [Google Scholar]
- 8.Mijailovich SM, Kojic M, Zivkovic M, Fabry B, Fredberg JJ. A Finite Element Model of Cell Deformation During Magnetic Bead Twisting. Journal of Applied Physiology. 2002;93:1429–1436. doi: 10.1152/japplphysiol.00255.2002. [DOI] [PubMed] [Google Scholar]
- 9.Cheezum MK, Walker WF, Guilford WH. Quantitative Comparison of Algorithms for Tracking Single Fluorescent Particles. Biophys J. 2001;81:2378–2388. doi: 10.1016/S0006-3495(01)75884-5. [DOI] [PMC free article] [PubMed] [Google Scholar]
- 10.Fadool JM, Dowling JE. Zebrafish: A Model System for the Study of Eye Genetics. Progress in Retinal and Eye Research. 2008;27:89–110. doi: 10.1016/j.preteyeres.2007.08.002. [DOI] [PMC free article] [PubMed] [Google Scholar]
- 11.Goldsmith P, Harris WA. The Zebrafish as a Tool for Understanding the Biology of Visual Disorders. Seminars in Cell & Developmental Biology. 2003;14 doi: 10.1016/s1084-9521(02)00167-2. PII S1084-9521(02)00167-2. [DOI] [PubMed] [Google Scholar]
- 12.Kagemann L, et al. Repeated, Noninvasive, High Resolution Spectral Domain Optical Coherence Tomography Imaging of Zebrafish Embryos. Molecular Vision. 2008;14:2157–2170. [PMC free article] [PubMed] [Google Scholar]
- 13.Link BA, Gray MP, Smith RS, John SWM. Intraocular Pressure in Zebrafish: Comparison of Inbred Strains and Identification of a Reduced Melanin Mutant with Raised Iop. Investigative Ophthalmology & Visual Science. 2004;45:4415–4422. doi: 10.1167/iovs.04-0557. [DOI] [PubMed] [Google Scholar]
- 14.Reed J, Frank M, Troke JJ, Schmit J, Han S, Teitell MA, Gimzewski JK. High Throughput Cell Nanomechanics with Mechanical Imaging Interferometry. Nanotechnology. 2008:19. doi: 10.1088/0957-4484/19/23/235101. [DOI] [PMC free article] [PubMed] [Google Scholar]
- 15.Reed J, Troke JJ, Schmit J, Han S, Teitell MA, Gimzewski JK. Live Cell Interferometry Reveals Cellular Dynamism During Force Propagation. Acs Nano. 2008;2:841–846. doi: 10.1021/nn700303f. [DOI] [PMC free article] [PubMed] [Google Scholar]
- 16.Reed J, Walczak WJ, Petzold ON, Gimzewski JK. In Situ Mechanical Interferometry of Matrigel Films. Langmuir. 2009;25:36–39. doi: 10.1021/la8033098. [DOI] [PMC free article] [PubMed] [Google Scholar]
- 17.Soules KA, Link BA. Morphogenesis of the Anterior Segment in the Zebrafish Eye. BMC Developmental Biology. 2005:5. doi: 10.1186/1471-213X-5-12. [DOI] [PMC free article] [PubMed] [Google Scholar]
- 18.Hitchings R. The Ocular Pulse. British Journal of Ophthalmology. 1991;75:65–65. doi: 10.1136/bjo.75.2.65. [DOI] [PMC free article] [PubMed] [Google Scholar]
- 19.Johnson KL. Contact Mechanics. Cambridge University Press; New York: 1985. pp. 84–104. [Google Scholar]
- 20.Weizer JS, Asrani S, Stinnett SS, Herndon LW. The Clinical Utility of Dynamic Contour Tonometry and Ocular Pulse Amplitude. Journal of Glaucoma. 2007;16:700–703. doi: 10.1097/IJG.0b013e31806ab2fe. [DOI] [PubMed] [Google Scholar]
- 21.Kasprzak HT, Iskander DR. Spectral Characteristics of Longitudinal Corneal Apex Velocities and Their Relation to the Cardiopulmonary System. Eye. 2007;21:1212–1219. doi: 10.1038/sj.eye.6702578. [DOI] [PubMed] [Google Scholar]
- 22.Romppainen T, Kniestedt C, Bachmann LM, Sturmer J. Ocular Pulse Amplitude: A New Biometrical Parameter for the Diagnose of Glaucoma? Ophthalmologe. 2007;104:230–235. doi: 10.1007/s00347-006-1467-8. [DOI] [PubMed] [Google Scholar]
- 23.Geyer O, Neudorfer M, Snir T, Goldstein M, Rock T, Silver DM, Bartov E. Pulsatile Ocular Blood Flow in Diabetic Retinopathy. Acta Ophthalmologica Scandinavica. 1999;77:522–525. doi: 10.1034/j.1600-0420.1999.770507.x. [DOI] [PubMed] [Google Scholar]
- 24.Schmit J. USPTO. Measurment of Object Deformation with Optical Profiler. 2007. [Google Scholar]
- 25.Schmit J, Creath K. Extended Averaging Technique for Derivation of Error-Compensating Algorithms in Phase-Shifting Interferometry. Applied Optics. 1995;34:3610–3619. doi: 10.1364/AO.34.003610. [DOI] [PubMed] [Google Scholar]