Abstract
Purpose: To verify water equivalent path length (WEPL) before treatment in proton radiotherapy using time resolved in vivo diode dosimetry.
Methods: Using a passively scattered range modulated proton beam, the output of a diode driving a fast current-to-voltage amplifier is recorded at a number of depths in a water tank. At each depth, a burst of overlapping single proton pulses is observed. The rms duration of the burst is computed and the resulting data set is fitted with a cubic polynomial.
Results: When the diode is subsequently set to an arbitrary depth and the polynomial is used as a calibration curve, the “unknown” depth is determined within 0.3 mm rms.
Conclusions: A diode or a diode array, placed (for instance) in the rectum in conjunction with a rectal balloon, can potentially determine the WEPL at that point, just prior to treatment, with submillimeter accuracy, allowing the beam energy to be adjusted. The associated unwanted dose is about 0.2% of a typical single fraction treatment dose.
Keywords: proton radiotherapy, water equivalent pathlength, time resolved dosimetry
INTRODUCTION
It is a paradox of proton radiotherapy that the well defined range of the proton beam, potentially so useful, is little used by treatment planners. The reason is the uncertainty in water equivalent path length (WEPL) to the interface between the volume to be treated and the volume to be spared due to uncertainties in Hounsfield number conversion, the finite accuracy of dose algorithms, and day to day changes in patient setup and organ position. A way around this difficulty may exist when a dosimeter can be inserted in a body cavity (e.g., oral cavity, esophagus, and rectum) just distal to the treatment volume, and its response used to infer the WEPL to that point.
In a previous paper1 (hereinafter HML), one of us studied the time dependent response of a small ionization chamber (IC), exposed to a passively scattered range modulated proton beam, as a function of the IC’s depth in a water tank. HML found that each depth yielded a characteristic shape of IC output vs time. After measuring a large calibration set of shapes at closely spaced depths, the depth of the IC could subsequently be determined to ≈1 mm by finding which calibration shape matched best. The method required very little dose and, therefore, could potentially be used to provide a range check prior to the delivery of the prescribed dose.
Semiconductor diodes are good dosimeters2 and have obvious advantages over an IC. They are two-terminal devices not requiring bias voltage and are small, rugged, and inexpensive. However, preliminary studies with commercial electronics yielded an output vs time that was noisy and erratic, and depth resolution using shape-matching was poor. Eventually, on using a faster amplifier, we understood this problem. Diodes are typically so small that we observe individual proton events. The “noise” is simply due to statistical fluctuations.
We then undertook a theoretical study, described next, to predict the time-dependent response of a dosimeter at arbitrary depth in a passive range modulated beam and to identify characteristics of that response most simply related to dosimeter depth. We found that the rms width σt of the dose burst associated with a single modulator cycle was the most promising candidate. It is easily evaluated, depends smoothly and monotonically on depth, and, above all, is perfectly well defined for both smooth and stochastic distributions.
The present paper presents experimental confirmation that σt is indeed a good measure of WEPL and determines the error in WEPL and the amount of dose required for the measurement. It extends the basic method proposed in HML to diodes and even improves somewhat on accuracy. In what follows, we will rely heavily on HML for background, particularly for details of how passive range modulated systems work.
THEORY
HML gave a brief description of passive range modulation; for more details, the reader might consult Ref. 3. Referring to HML (Fig. 3), passive range modulation is done, at most proton therapy centers, with a modulator “track” on a wheel having several such tracks. The principal modulator material (usually carbon or plastic) is stepped, each step displacing the Bragg peak in the patient by a constant water equivalent amount. The sum of component Bragg peaks, weighted appropriately according to the angular span of each step, yields a flat “spread-out Bragg peak” (SOBP).
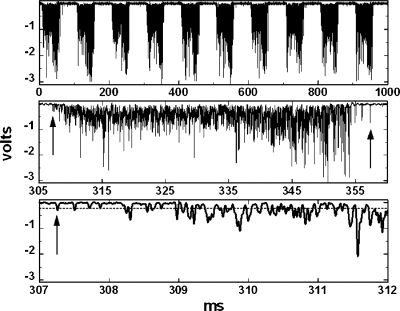
Figure 3.
Amplifier output at d=16.5 cm. Top: ten modulator cycles. Middle: fourth cycle. Bottom: beginning of fourth cycle. The dashed line is the software discriminator level.
Since a given modulator only works well over a small range of incident energies, it might at first seem that hundreds of modulators would be needed: for each energy range, a modulator for each modulation width. A technique called “beam gating” avoids this problem. The track for each energy range is designed for full modulation. Any lesser modulation is then obtained by simply cutting off the proton beam during the appropriate proximal steps. This technique, and the fact that (contrary to the figure) the beam spot is large, typically covering several steps, necessitates a “stop block.” That is a block, separating the first (thinnest) and last (thickest) modulator steps, which is large enough to fully contain the beam spot and thick enough to stop the beam. Without this, that is, if the first step abutted the last, cutting off that last step would, because of the finite beam spot, also affect the first, spoiling the distal end of the SOBP.
In practice, another technique called “beam current modulation” (BCM), more general than beam gating, is often used. By varying the proton beam intensity in synchrony with the modulator, defects in the SOBP due to using the track at energies off the design energy can be corrected. Using BCM (described by Lu and Kooy4) all clinical requirements can be met with just four or five tracks.
Returning to the problem at hand, we can now explain why the shape of the dose pulse detected by a dosimeter on the beam axis depends on the depth of the dosimeter. If the distal falloff of the pristine Bragg peak were infinitely sharp and the beam spot infinitely small, a dosimeter at the deepest point reached by the beam would only see dose during the deepest step. Somewhat further upstream, it would also see dose from the second step and so on. At any given depth, the dose vs time would consist of a sequence of steps. In practice, that stepped pattern is smoothed out by two effects. The finite width of the pristine Bragg peak (from range straggling and beam energy width) causes signals from adjacent steps to overlap, as does the step mixing effect of the finite size of the beam spot (HML, Fig. 4).
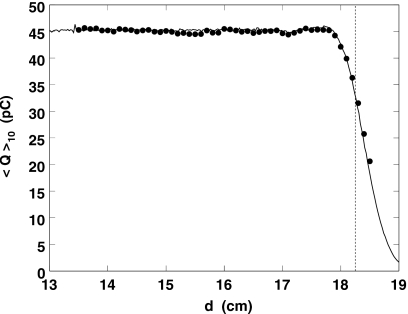
Figure 4.
Circles: measured charge per burst averaged over ten bursts. Line: data from a Markus chamber, normalized arbitrarily and shifted 1 mm (the diode wall correction is not known accurately at this time). Only the points to the left of the dashed line were used in Fig. 5 and the polynomial fit.
The argument can be made quantitative by modeling the Bragg peak (using a measured Bragg peak) as well as the beam spot profile. At any dosimeter depth d, the dose D is a periodic function of the modulator angle θ (equivalent to time t because the angular speed of the track is constant) namely,
| (1) |
where Bj(d) is the dose corresponding to the jth component Bragg peak sampled at depth d, while
| (2) |
is the effective overlap area (cm2) of the beam spot with the jth modulator step when the beam centroid is at , where rmod is the nominal radius of the modulator track. γj and γj+1 are the angular limits of the jth step (HML, Fig. 3) and we have assumed (unlike the figure) that each step runs from r=0 to ∞. P is a function describing the beam spot profile. The total effective area of the beam spot for a given profile is
| (3) |
where . If for some θ and j we find Aj(θ)=A, the beam spot is entirely contained on that modulator step for that θ, which usually happens only on the widest (first and second) steps.
To correspond to the experiment to be described shortly, we derived Bj(d) from a measured pristine Bragg peak at 175 MeV rescaled to 163 MeV, the energy of the experiment. The beam profile P was assumed to be cylindrically symmetric, that is, to depend only on . It had a flat region, followed by a Gaussian falloff with σ=0.3 cm such that the half width at half maximum of the beam spot was 0.5 cm. These parameters correspond very roughly to the actual beam spot at the modulator. (We found, in fact, that the results of interest depend mostly on the overall spot size and relatively little on the details of the profile.)
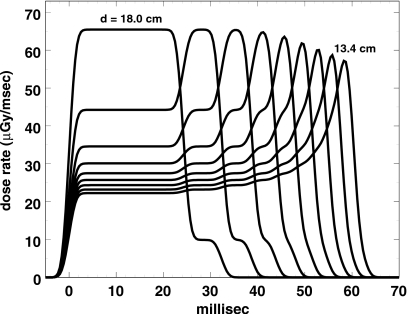
With these assumptions, the computed dose bursts (signals that might be seen with a small IC at various depths) are shown in Fig. 1, which compares well with measured IC data (HML, Fig. 4). The greater regularity of our Fig. 1 stems from the fact that we used depths beginning at the top of the first Bragg peak (HML, Fig. 3) and decreasing thereafter by the water equivalent of exactly one modulator step, whereas the depths in HML (Fig. 4) fall at random relative to modulator steps. The flatness of the first two bursts shows that the step contains the entire beam spot during that time.
Figure 1.
Theoretical dose bursts as they might be seen by an IC driving a fast amplifier, at depths separated by exactly one modulator step water equivalent.
Since we already knew that the burst shapes observed with a diode do not resemble those just shown but, rather, are stochastic samples of those shapes, we sought statistical measures that could be used instead of shape-matching. The conventional definitions of the first four moments of a distribution, namely, its sum, mean, rms width, and skewness are well known5 but we repeat them for completeness:
| (4) |
| (5) |
| (6) |
| (7) |
These formulas assume a voltage waveform vi(ti) sampled at N times. (If, as in our case, the raw data are predominantly negative, we let vi=−1× reading.)
Considering these four possibilities, the sum (that is to say, the total area or dose of each burst) is ineligible because, by design of the SOBP, it is as independent of d as we can make it! (We will see, though, that it is a valuable check on the overall consistency of the analysis.) The mean would seem eligible but depends on absolute time. Therefore, σt, being (loosely speaking) the width of the distribution about its own mean, seems the best candidate. Finally, the skewness of the bursts (their asymmetry about the mean) might also contain useful information.
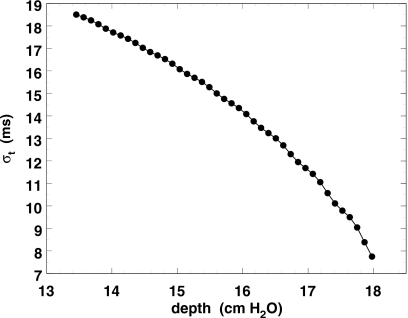
Since the evidence (HML, Fig. 5) suggests that we should look first at a measure of width, we will concentrate on σt. Its theoretical behavior as a function of d (Fig. 2) is encouraging. It is smooth and monotonic with just a hint at the largest depths (the first few modulator cycles) of periodicity related to the modulator step size.
Figure 5.
Points: diode depth in water tank as a function of the measured ⟨σt⟩10. Solid line: cubic polynomial fit. Dashed line: theoretical prediction (cf. Fig. 2).
Figure 2.
Theoretical rms width of dose bursts as a function of dosimeter depth, at the depths shown in Fig. 1 and intermediate depths. The line connecting the points serves merely to guide the eye.
In concluding this section, we emphasize that the theoretical study was intended merely as a preliminary exploration of what kind of analysis of the experiment might be most effective. Nevertheless, it predicts σt(d) rather well as we shall see.
EXPERIMENT
Hardware and electronics
A PTW model T60012 diode (PTW Freiburg GMBH, Lörracher Strasse 7, 79115 Freiburg, Germany) was mounted coaxially with the proton beam in a CRS water tank (Computerized Radiation Scanners, Inc., 140 Sopwith Drive, Vero Beach, FL 32968) used for positioning only. The diode presents a disk with an area of 1 mm2 and a thickness of 2.5 μm to the beam. Instead of the usual current integrator, the diode was connected to a current-to-voltage amplifier of our own design and construction.
Because the amplifier is not commercially available, a description, with some design considerations, is given in the Appendix0. For the casual reader, it suffices to know that the amplifier is moderately fast (10 μs response time), dc coupled, appropriate for diodes, and yields 0.5 V per input nA.
The amplifier was connected to a Lecroy WavePro 715Zi digital oscilloscope, set for 1 Msample∕s, through a long (≈30 m) unterminated 50 Ω coaxial cable. The scope was triggered by the leading edge of the BCM signal, which controls the ion source of the Burr Center proton radiotherapy cyclotron.4
Experimental procedure
The cyclotron and proton nozzle were set for full range modulation and rather low current, 5 nA at the cyclotron exit IC, corresponding to a treatment dose rate of ≈22 cGy∕min at mid-SOBP. The proton range in water at the isocenter was set to 18.0 cm, typical of a range check for prostate treatment by anterior fields. Except for occasional interruptions, the beam was kept on throughout the experiment, about 1.5 h. In practice, the modulation would be reduced and the beam would only be on during the 1 s required for the measurement, to minimize unwanted dose to the patient. At the 1%–2% level, there was no evidence of diode radiation damage (decrease in sensitivity) from the ≈20 Gy delivered during the experiment.
For each run, a nominal depth was set and a single scope trace comprising ten modulator cycles was acquired and saved (see Fig. 3, taken at d=16.5 cm). The run series and nominal depth were encoded in the file name. Data were taken in four series. A was a preliminary exploration, B covered a 5 cm range in depth in 1 mm steps, C covered the same range in 1 cm steps, and D covered 1 cm in 0.5 mm steps. At the beginning of each series, the diode was driven to 19 cm and subsequently moved only upstream to avoid backlash, if any. Series B was treated as the calibration run and the others as test runs.
Analysis
The most obvious fact (Fig. 3) is that the burst shape is not smooth but broken up into pulses. (Despite considerable pulse pileup, the largest output, ≈−3 V, is well within the ±7 V dynamic range of the amplifier.) The pulse structure is due to the small area of the diode: we are seeing individual proton events or clusters. (Indeed, with the same equipment and settings, one can easily observe single pulses at a few Hz on the bench using a 10 μCi 207Bi test source at contact.) An order-of-magnitude estimate will make that interpretation plausible. Dose rate equals fluence rate times mass stopping power, from which
with in Gy∕s and S∕ρ in MeV∕(g∕cm2). was measured as 0.364×10⁻² Gy∕s and the area of the PTW diode is 0.01 cm2. The bottom trace of Fig. 3 represents the leading edge of the burst, in other words the first modulator step, or the pristine Bragg peak sampled at a depth of 16.5 cm. At that depth, the residual range is 1.7 cm (Fig. 4) corresponding to an energy of 43 MeV or S∕ρ=14 MeV∕(g∕cm2). Putting it all together, we expect ≈16 protons∕ms, not inconsistent with the trace. (Note how the beam ramps up slowly as the finite beam spot clears the beam stop.)
The first analysis task is to separate the bursts corresponding to each modulator cycle. Tight cuts are needed around each burst, as we have observed that it is definitely harmful to include too much baseline noise in the statistical analysis. Because the amplifier is dc coupled, the quiescent output is stable and very near zero, and the signal is negative, we can assume the maximum noise equals the maximum positive voltage in the entire trace and set a software discrimination level at (for instance) negative twice that. (Results are insensitive to that factor 2.) The first burst is deemed to begin when a voltage reading is more negative than the discrimination level.
As evident in Fig. 3, there are occasional spurious pulses, of origin so far unknown, between bursts. To avoid those, we take advantage of the stable mean time between bursts (100 ms) and do not seek the first pulse of the second burst until (say) 98 ms after the first pulse of the previous burst. Continuing thus, we identify the indices of all ten first pulses. The same procedure going backward in time identifies the indices of all ten last pulses.
We denote the average of each statistic over the ten bursts per run thus ⟨σt⟩10. Each such average is a function of the nominal depth setting d (nominal WEPL) of that run. ⟨S⟩10 is easily converted to the average total charge ⟨Q⟩10 per burst (pC) given the known sampling interval and amplifier sensitivity.
RESULTS
A number of consistency checks were performed. For instance, the difference between successive mean burst occurrence times m was found to be 100±0.5 ms, in good agreement with the known period of the range modulator. Less trivial is the plot of ⟨Q⟩10 vs d (Fig. 4), which shows excellent agreement with a Markus IC measurement of the same portion of the SOBP.
Although the experiment measured ⟨σt⟩10 as a function of d, we eventually want its inverse d(⟨σt⟩10). Figure 5 shows that, along with a cubic (four term) polynomial fit. The three deepest points (see Fig. 4) deviate from the overall trend (as must eventually happen) and were omitted from the fit and from Fig. 5. Still, d is a smooth function of σt well beyond the knee of the SOBP. Adding higher order terms does not improve the fit significantly. The rms scatter of the 48 data points about the fit is 0.029 cm. The theoretical prediction (dashed line) agrees rather well with measurement, although the slight periodicity predicted at large depths is not observed.
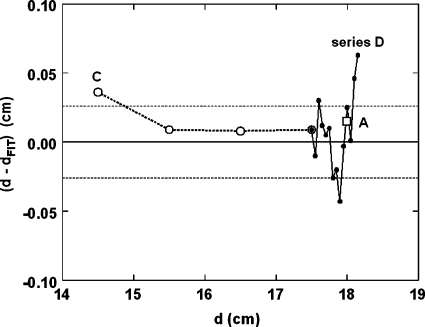
Figure 6 compares data points, not used in the fit, from series A, C and D with the fit used as a calibration curve. The rms scatter of 19 points about zero is 0.026 cm, in excellent agreement with the scatter of series B about the fit. We conclude that the 1σ precision of the method, with ten bursts, is ±0.3 mm under ideal conditions (water tank). Using more bursts, one would expect to gain precision, but only as the square root of the number of bursts.
Figure 6.
Test runs: actual depth minus depth from fitted ⟨σt⟩10.
The sensitivity of the PTW diode, 1.17 nC∕cGy±1%, was measured after the main run. That and the fact that the integrated amplifier output in the flat part of the SOBP is 45 pC (Fig. 4) yields a dose of 0.38 cGy∕s (ten modulator cycles), in satisfactory agreement with the 0.364 cGy∕s measured directly. Since a typical prostate dose per treatment session is 200 cGy, the proposed WEPL measurement delivers an unwanted dose only ≈0.2% of the prescribed dose.
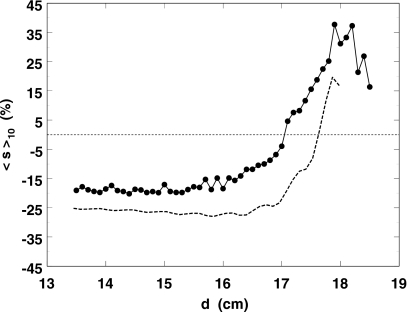
Skewness ⟨s⟩10 is shown as a function of d in Fig. 7. Here, the theory (dashed line) only agrees qualitatively. The observed region of good sensitivity is narrow. Although some additional precision might be gleaned there with this independent statistic, it seems hardly worth the trouble given that ⟨σt⟩10 alone works so well over such a large range of d.
Figure 7.
Points and solid line: measured skewness averaged over ten bursts as a function of depth. Dashed line: model prediction.
DISCUSSION
The present study used a single high quality, rather expensive, and rather large diode. The eventual application envisions a small array of diodes spread over a few cm2, perhaps on a flexible membrane attached to a rectal balloon. The quantity measured (σt) requires only time and short-term amplitude stability. Therefore, many inexpensive commercial diodes are possible candidates. Indeed, we have done preliminary measurements with the 1N4004 rectifier diode (USD 0.085 in 100's) but its axial-lead geometry is not suitable. Dosimetry diodes are designed for radiation tolerance. Nevertheless, the damage threshold even for ordinary diodes is on the order of 100 Gy,2 which would permit ≈500 calibrations of the sort described if the beam were turned off when not required.
Figure 4 demonstrates that the PTW diode responds to dose in the same way as a small plane parallel IC. It is known, however, that some electronics diodes over-respond by ≈8% at low energies.2 They are not exactly linear, nor are they tissue-equivalent. Since the method is mainly sensitive to the time distribution, small nonlinearities with respect to dose will probably be absorbed into the calibration function d(σt) for any given diode type, but that remains to be proven.
Also, diode response depends on orientation with respect to the beam and diodes in an array inside a body cavity will be variously oriented. As just argued, σt measures the pulse distribution in time and is insensitive to an overall amplitude factor or, within reason, to the average pulse frequency. Therefore, differing sensitivities or effective areas of diodes with different orientations should not matter. Again, that remains to be shown experimentally.
Is our technique applicable to passive modulators of a different design or to magnetic (pencil-beam or uniform scanning) systems? The essential requirements would seem to be, first, the longitudinal mixing provided by the natural shape of the Bragg peak and the presence of beam on several modulator steps at once and, second, an accurate “clock,” namely, the range modulator period. We have modeled mixing in Sec. 2. The exact amount does not seem to matter as long as it is substantial. As to timing, its short- and long-term stability are provided, in the system studied, by the moment of inertia of the modulator wheel and by the accurately clocked stepping motor driving it. The timing precision corresponding to 0.3 mm depth resolution can be estimated either from the average slope in Fig. 5 or from the spread in the ten observed values of σt at each depth. It is approximately 0.1 ms, corresponding to ±0.1% in the modulator angular speed. As long as the modulator angular speed remains that accurate and precise, a calibration curve, once determined, should remain valid.
Therefore, the method should work for any rotating range modulator provided that longitudinal mixing obtains, that the modulator period is stable, and that the depth we are trying to measure falls in the flat part of the SOBP reasonably close to end-of-range. The beam block, beam gating, and beam current modulation should all be irrelevant.
Regarding magnetic scanning, we first note that the range check is independent of the treatment. The range check could be done with a passive range modulated beam, and the patient subsequently treated with scanning. That would, however, require considerable hardware and software flexibility in a single proton nozzle. That scenario being unlikely, could a purely magnetic system be used for the range check? Magnetic scanning is inherently asynchronous. It is timed by a computer, and it would be very difficult to get the absolute accuracy and precision required here. One might circumvent that problem by coordinating sampling of the diode waveform with events in the scanning system, but that would be a completely different scheme. Also, there is much less longitudinal mixing since magnetic scanning usually treats one layer at a time.
We conclude that the present method should work for any passive system with a rotating modulator but not, at least without major changes, for scanning systems.
An intracavity diode or diode array opens up other possibilities of course. For instance, one could measure dose to the rectal wall associated with the treatment. With opposed lateral fields and the diode in the penumbra, one might even be able to check patient∕aperture registration. Such possibilities merit study, but are beyond the scope of this paper.
In summary, we have carried the program begun in HML a few steps further by showing that it works for a diode dosimeter and describing appropriate electronics and analysis. We have introduced ⟨σt⟩N, which is well defined for either smooth or stochastic bursts and permits submillimeter precision in WEPL. So far, however, we have worked in the ideal environment of a single precisely oriented diode in a homogeneous water phantom. The ultimate precision and accuracy of the method will most likely be dominated by heterogeneity effects such as range mixing in the patient. These remain to be investigated with more realistic phantoms.
ACKNOWLEDGMENTS
B.G. is indebted to Harvard University, the Physics Department, and the Laboratory for Particle Physics and Cosmology for ongoing support, and to Judy Adams for explaining the advantages of the AP field in prostate radiotherapy with protons. This work was supported, in part, by a MGH∕NCI Federal Share Grant and by Ion Beam Applications S.A. (IBA).
APPENDIX: AMPLIFIER DETAILS
For linear dose response, semiconductor diodes should be operated at zero terminal volts.2 Moreover, the effective source resistance of a diode, once radiation-damaged, can be fairly low: a semiconductor diode is not always a “stiff” current source. Therefore, the voltage burden presented to the diode at the amplifier input should be small, on the order of μV. Otherwise, an appreciable “drift” current, actually the voltage burden acting across the effective diode resistance, will be observed. All that, and the desire for speed, calls for an operational amplifier with low bias current, low temperature and time coefficients of offset voltage, low noise, and moderately high gain-bandwidth product. The Texas Instruments TLC2201/2 is a good candidate, with <1 pA bias current, ≈0.5 μV∕°C offset change, ≈0.001 μV∕month offset drift, noise voltage at 1 kHz, and fT=1.9 MHz.
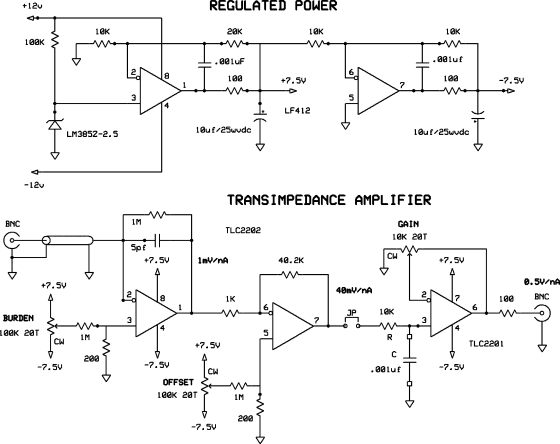
The first stage of the amplifier (Fig. 8) is a conventional transimpedance amplifier6 with an output of 1 mV/nA and a response time of 5 μs dominated by the feedback circuit. The next stage is an inverting voltage amplifier with a gain of 40. Its settling time equivalent RC is6
The output stage gain was set for a total gain of 0.5 V/nA using a precise current source. The RC filter was set to 10 μs for this experiment, dominating the overall response time.
Figure 8.
Diode current amplifier, single ended input, gain 0.5 V∕nA.
The circuit as constructed also includes a balanced transimpedance amplifier, sharing the same output stage, set up for shielded twisted pair input rather than the single ended (coaxial) input dictated by the PTW output cable. Balanced input has somewhat less noise and may be a better option eventually.
For subsequent analysis, it is very convenient for the quiescent dc offset to be zero and stable. Therefore, regulated on-board tracking ±7.5 V regulators are provided. The amplifier has two dc adjustments. “OFFSET” is set to null the output when the input is open. “BURDEN” is set to null the output when the input is grounded through, e.g., 10 kΩ.
References
- Lu H.-M., “A potential method for in vivo range verification in proton therapy treatment,” Phys. Med. Biol. 53, 1413–1424 (2008). 10.1088/0031-9155/53/5/016 [DOI] [PubMed] [Google Scholar]
- Koehler A. M., “Dosimetry of proton beams using small silicon diodes,” Radiat. Res., Suppl. 7, 53–63 (1967). In unpublished Errata, the author presents a corrected Fig. consistent with an output change of +0.32%∕°C. 10.2307/3583700 [DOI] [PubMed] [Google Scholar]
- Gottschalk B., lectures (BGtalks.zip) and a draft textbook (PBS.pdf in BGdocs.zip) available for free download at http://physics.harvard.edu/~gottschalk or the Particle Therapy Co-Operative Group (PTCOG) website, http://ptcog.web.psi.ch/.
- Lu H. -M. and Kooy H., “Optimization of current modulation function for proton spread-out Bragg peak fields,” Med. Phys. 33, 1281–1287 (2006). 10.1118/1.2188072 [DOI] [PubMed] [Google Scholar]
- Press W. H., Flannery B. P., Teukolsky S. A., and Vetterling W. T., Numerical Recipes: The Art of Scientific Computing (Cambridge University Press, Cambridge, United Kingdom, 1986). [Google Scholar]
- Horowitz P. and Hill W., The Art of Electronics, 2nd ed. (Cambridge University Press, Cambridge, United Kingdom, 1989). [Google Scholar]


