Abstract
We report in vivo and in vitro MRI properties of six gadolinium-dendrimer and gadolinium-albumin conjugates of derivatized acyclic diethylenetriamine-N,N’,N’,N’’, N’’-pentaacetic acid (1B4M) and macrocyclic 1,4,7,10-tetraazacyclododecane-N,N’,N’’,N’’’-tetraacetic acid (C-DOTA). The three albumin-based agents have comparable protein to chelate ratios (1:16–18) as well as molar relaxivity (8.8–10.4 mM−1s−1). The three dendrimer based agents have blood clearance half-lives ranging from 17 to 66 min while that of the three albumin-based agents are comparable to one another (40–47 min). The dynamic image obtained from use of the albumin conjugate based on the macrocycle (C-DOTA) showed a higher contrast compared to the remaining two albumin based agents. Our conclusion from all of the results is that the macrocyclic-based (DOTA) agents are more suitable than the acyclic-based (1B4M) agent for in vivo use based on their MRI properties combined with the kinetic inertness property associated with the more stable Gd(III) DOTA complex.
1. Introduction
Magnetic resonance imaging (MRI) often relies on “contrast agents” to create the contrast between normal and diseased tissues. Chelated gadolinium has long been recognized for creation of contrast agents in magnetic resonance imaging (MRI) due to its large magnetic moment and long electronic relaxation time. Macrocyclic chelate derivatives based on DOTA (1,4,7,10-tetraazacyclododecane-N,N’,N’’,N’’’-tetraacetic acid) are finding increasing applications in bioconjugation both for biomedicine and MRI contrast agents. Complexes formed between lanthanides and the macrocyclic ligand such as Gd(DOTA)−1 is thermodynamically stable and kinetically inert.[1–3] A study has been done using Gd(DOTA)−1 as a contrast agent to study central nervous system, such as intracranial lesions.[4] While the brain images in rat obtained using Gd(DOTA)−1 and Gd(DTPA)−2 as contrast agents showed no significant differences in enhancement, a faster rate of clearance of the former was observed.[5] However, current clinically used small molecule extracellular MRI contrast agents have relatively short blood half-lives and easily extravasate into muscle or are quickly excreted from the body due to their low molecular weight.
A well known strategy to increase the in vivo relaxation efficiency involves conjugation of a small molecule contrast agent to a larger macromolecule. The main reason for this is to slow down the molecular tumbling time, also known as rotational correlation time τr, while also prolonging the intravascular retention time. The use of Gd(III) chelates conjugated to high molecular weight carriers such as a polyamidoamine (PAMAM) dendrimer is well documented.[6–8] PAMAM dendrimers are mono-dispersed in nature with defined structure, and possess a large number of available amine surface groups for conjugation. They have found uses for conjugation of high numbers of small molecule contrast agents for MRI,[9–12] and also to monoclonal antibodies for targeting.[13–16]
An alternative method of creating intravascular contrast agents with long blood circulation time is by covalently attaching the small molecule gadolinium chelates to large proteins, such as human serum albumin (HSA). Albumin (MW~66,800) binding will also increase the molecular rotational correlation time, prevent fast excretion of the agents, and enhance the efficacy of interaction between the electrons of the Gd(III) ion and the nucleus of water protons.[17] Albumin is a nearly perfect macromolecule to take advantage of for in vivo applications mainly because it is the most abundant protein in the blood, and also possesses 58 lysine residues, which then provides binding sites for appending small molecules.[18] It is estimated that only 5% of albumin leaves the blood per hour,[19] which indicates a prolonged retention time, and it is also known that albumim intensely accumulates in some malignant tumors.[20] Based on these observations, several albumin conjugates have been prepared for therapeutic and diagnostic applications,[21–25] and also for creation of MRI contrast agents.[26–31]
The present study reports the preparation and assessment of albumin- and dendrimer- based conjugates as intravascular contrast agents. The effect of these agents on water proton relaxation was studied comparatively in vitro whereas their performance as contrast agents was studied in vivo. The pre-formed complexes, (2-(4-isothiocyanatobenzyl)-6-methyl-diethylenetriaminepentaacetic acid gadolinium complex; (p-SCN-1B4M[Gd])) and (2-(4-isothiocyanatobenzyl)-1,4,7,10-tetraazacyclododecane-N,N’,N’’,N’’’-tetraacetic acid gadolinium complex (p-SCN-C-DOTA[Gd]), were directly conjugated to the macromolecules. The p-SCN-1B4M ligand was also attached to albumin first, and then followed by metallation with Gd(III). This will allow us to directly compare MRI property of albumin conjugates prepared using the new method (premetallation) versus the old method (postmetallation) which has never been done before.
2. Experimental
2.1 Materials and methods
Ethylenediamine (EDA) core Starburst® polyamidoamine (PAMAM) dendrimer generation-4, 5 and 6 in MeOH were obtained from Dendritech. Human serum albumin (HSA from this point on) and gadolinium nitrate pentahydrate (Gd(NO)3·5H2O) were purchased from Aldrich (St. Louis, MO). Phosphate buffered saline (1X PBS) at pH 7.4 was obtained from Digene (Gaithersburg, MD). Size-exclusion HPLC (SE-HPLC) was performed using a Beckman System Gold® (Fullerton, CA) equipped with model 126 solvent delivery module and a model 166NMP UV detector (λ 254 nm) controlled by 32 Karat software. A TSK-gel G3000SWxls 10 μm, 7.8 mm × 300 mm (Tosoh Bioscience, Montgomeryville, PA) column and a TSK-gel 10 μm guard column (Tosoh Bioscience, Montgomeryville, PA) were used for SE-HPLC with phosphate buffered saline (1X PBS) solution as the eluent at 1.0 mL/min, respectively. All water used was purified using a Hydro Ultrapure Water Purification system (Rockville, MD). The Sephadex® G-25 resin was purchased from Pharmacia (Sweden), pre-treated with 1X PBS, and loaded to a Pharmacia Biotech column 2.6 × 39.7 cm (Uppsala, Sweden). Elemental analyses were performed by Galbraith Laboratories, Inc. (Knoxville, TN) using inductively coupled plasma-mass spectrometry (ICP-MS) for Gd. The Bio-Rad gel filtration standard used to compare the molecular weight of the dendrimer conjugate was purchased from Bio-Rad (Hercules, CA). An Agilent 8453 UV-Visible spectrophotometer (Agilent Technologies; Foster City, CA) was employed to generate a standard curve. Preparation and characterization of the three dendrimer based agents, G4-(C-DOTA-Gd)28 (G4 in this report), G5-(C-DOTA-Gd)61 (G5) and G6-(C-DOTA-Gd)115(G6), has been reported elsewhere.[32]
2.2 Conjugation of albumin with 1 or 2
2.2.1 Pre-metallation method
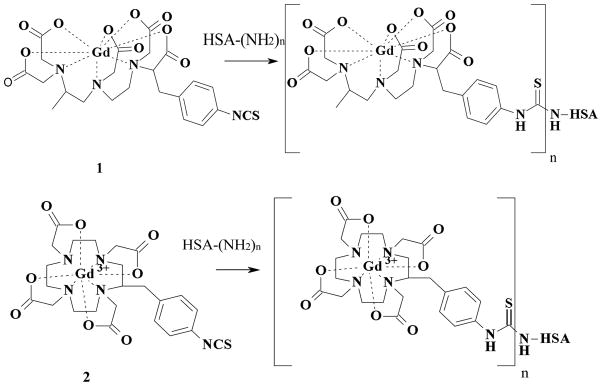
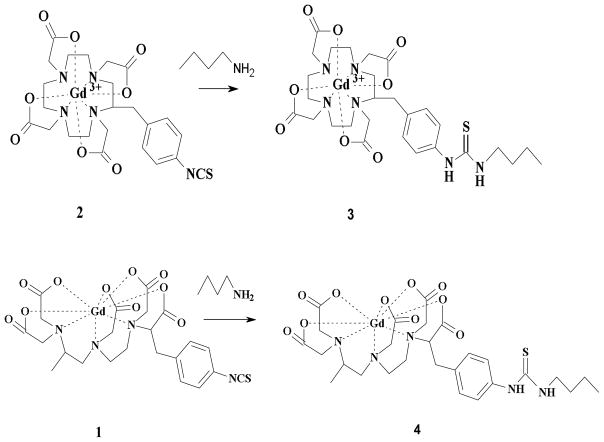
Compounds 1 (2-(4-isothiocyanatobenzyl)-6-methyl-diethylenetriaminepentaacetic acid gadolinium complex; (p-SCN-1B4M[Gd])) and 2 (2-(4-isothiocyanatobenzyl)-1,4,7,10-tetraazacyclododecane-N,N’,N’’,N’’’-tetraacetic acid gadolinium complex (p-SCN-C-DOTA[Gd]) were prepared as previously reported,[33–34] and they were conjugated to albumin as shown in Fig. 1. Human serum albumin (HSA) (100 mg) was dissolved in 50 mL 1X conjugation buffer with EDTA (48 mM NaHCO3 + 2.0 mM Na2CO3 + 0.15 M NaCl + 0.5 mM EDTA) (pH ~ 8.5). Compound 1 or 2 (160 mg, 110 eq.) was added in portions while the pH was adjusted to 8.5 with 1M NaOH. The mixture was rotated for 5–10 min after each addition and then 24 hr after the addition was complete at room temperature. The completion of the conjugation was monitored by SE-HPLC following the growth of a higher molecular weight peak. The solution was filtered through a 0.45 μm cellulose acetate membrane filter (Corning, NY). The albumin conjugate was purified by a Sephadex® G-25 column eluted with 1X PBS (pH 7.4). The first band was collected and the volume was reduced to half (75 %) (SE-HPLC tR =9.5 min). The final concentration of albumin was assessed by Lowry assay[35] while the Gd(III) content was determined by ICP-MS. For comparison mineralization followed by Arsenazo assay was performed to verified the Gd(III) content.[36–37] The number of chelate to albumin (chelate to albumin ratio) was spectroscopically determined using compound 3 or 4 (Fig. 2) as reported earlier.[32] A standard curve using compound 3 at 245 nm was generated and the absorbance of the Gd-albumin solution was compared. Note that the absorbance of free albumin at 245 nm, prepared in the same concentration as in the Gd-albumin solution, was used to correct for the albumin interference. A ratio of 1:18 was obtained for (HSA-(C-DOTA-Gd)18)(HSA-DOTApre) and 1:16 for (HSA-(1B4M-Gd)16)(HSA-1B4Mpre).
Fig. 1.
Synthetic scheme for albumin conjugates.
Fig. 2.
Synthetic scheme for 3 and 4.
2.2.2 Post-metallation method
(HSA-(1B4M)18-Gd13) (HSA-1B4Mpost) was prepared by modification of the previously described method.[38] 2.0 g of HSA was dissolved in 2000 mL pre-warmed conjugation buffer (48 mM NaHCO3 + 2.0 mM Na2CO3 + 0.15 M NaCl + 0.5 mM EDTA) (37o, pH 8.5). 1.2 g of ligand (2-(4-isothiocyanatobenzyl)-6-methyl-diethylenetriaminepentaacetic acid (p-SCN-1B4M; compound 1 without Gd(III)) (40 eq.) was added in portion while stirring. The mixture was incubated at 37o C for 4 hr after addition. The unreacted free ligand was separated by a Tangential Flow Filtration (TFF) system. The above literature reaction condition was followed for the incorporation of Gd (III) and the reaction mixture was also purified by TFF. The final albumin concentration was determined by Lowry assay,[35] and the number of chelating agents was determined by Arsenazo assay.[37] The number of chelates per albumin (18:1) was determined from the difference in the number of chelating agents before and after reaction with Gd(III) while the Gd(III) content was determined by ICP-MS. Note that 1–5 empty chelate(s), chelate(s) without Gd(III) was observed with this method.
2.3 Photon correlation spectroscopy (PCS) and Zeta (ζ) potential
Photon correlation spectroscopy (PCS) was used to determine the size of particles in solution in the submicron range (> 3 nm).[39–40] PCS measurements were performed with a Zetasizer Nano ZS (Malvern, Worcestshire, United Kingdom) with a fixed 173° scattering angle and external fiber angle, and a 633-nm helium-neon laser. Data were analyzed using the associated Zetasizer software (Dispersion Technology Software 4.2; Malvern). The size and zeta potential of conjugates determined here is based on 1 mM (based on Gd3+). Solutions containing albumin (diluted from stock solution in PBS) were prepared in double-deionized water (pH ~6.0) and PCS measurements were recorded 30 to 40 minutes after sample preparation. The ζ potential of solutions was measured using the Zetasizer Nano ZS using a ζ disposable clear cuvette. The determination of the ζ potential is based on a measure of the electrophoretic mobility of particles under an applied electric field.
2.4 Relaxometry
Relaxation measurements were made on a custom designed variable field T1–T2 analyzer (Southwest Research Institute, San Antonio, TX) at 23°C. The field strength was varied from 0.02 to 1.5 T (1–64 MHz). T1 was measured using a saturation recovery pulse sequence with 32 incremental recovery times. The relaxivities (relaxation rates per mM concentration of metal ion) were obtained after subtracting the buffer (PBS, 0.01 M phosphate, 0.01 M NaCl, pH 7.4) contribution. The same solution used for size measurements above were used for these measurements.
2.5 Molar Relaxivity Measurements
Solutions of [Gd(DTPA)]−2 used as a reference standard (MagnevistTM; Bayer, Montville, NJ) at 0.25, 0.50, 0.75, 1.0 and 2.0 mM, and 0.1, 0.25, 0.50, 0.75 and 1.0 mM of albumin containing samples were prepared in 1X PBS (300 μL). Relaxivity measurements were obtained at ~22° C using a 3-Tesla clinical scanner (Signa Excite, GE Medical System, Waukesha, WI) equipped with a human knee coil (GE Medical System, Waukesha, WI). A series of variable TR single slice 2D spin echo images of all the solutions were acquired at the same time with a TE around 9ms and using different repetition times (TR = 100, 350, 750, 1250, 2500, and 5000 ms). The R1 map was calculated from variable TR SE images in ImageJ (http://rsb.info.nih.gov/ij) using the MRI analysis plug-in (http://rsb.info.nih.gov/ij/plugins/mri-analysis.html). The molar relaxivities, r1, were obtained from the slope of 1/T1 vs. [Gd(III)] plots determined from region of interest measurements.
2.6 In Vivo Magnetic Resonance Imaging (MRI)
All animal studies were performed in accordance with the NIH guidelines for the humane use of animals and all procedures were reviewed and approved by the National Cancer Institute Animal Care and Use Committee. Normal 6–10 week old female nude mice (Charles Rivers Laboratories) were imaged two at a time to increase throughput using a 3T clinical scanner (Signa Excite, GE Medical System, Waukesha, WI) equipped with a human knee coil (GE Medical System, Waukesha, WI). Each mouse was placed in a physical restraint while a catheter line (30 gauge needle on a 0.010” ID × 6” long Tygon tubing) filled with 1X PBS was inserted into the tail vein, anesthetized using gas mixtures of 3% isoflurane in O2, and then carefully placed in a mouse bed equipped with a nose cone and a water pad which was heated to maintain the mice at 34°C. The mice were then positioned in the human knee coil while the anesthesia gas was adjusted between 1.5–2.5% isoflurane. After acquiring a tri-planar gradient echo survey, a coronal view T1-weighted 3D-fast spoiled gradient echo image with a low flip angle (repetition time of 10 ms, echo time of 3.3 ms, flip angle of 4o, field of view of 160 × 63 mm, matrix size of 512 × 256 pixels, 80 slices, slice thickness of 0.6 mm and 1 average; scan time of 2.3 min) was acquired followed by a dynamic series using a higher flip angle of 30o and 4 averages repeated every 3.2 min for 90 min. The contrast agent was injected (50 μL of solution in 1 X PBS based on Gd(III) pushed with 50 uL of 1 X PBS) after the first dynamic image. The injection doses were 10 μmol/kg and 20 μmol/kg for the dendrimer- and albumin-based agents respectively. Blood clearance rates were determined from ROI intensity measurements of the jugular vein in the dynamic images using Image J. The intensity values during the dynamic scans were then converted to Gd(III) concentration and the resulting [Gd] time curves were fitted to a single exponential function using an Igor Pro (Wavemetrics) macro.
3. Results and discussion
Fig. 1 shows the premetallation method preparative scheme for the two albumin conjugates (HSA-DOTApre) and (HSA-1B4Mpre) while (HSA-1B4Mpost) was prepared by the post-metallation method. Preparation and characterization of the three dendrimer based agents; G4-(C-DOTA-Gd)28 (G4 in this report), G5-(C-DOTA-Gd)61 (G5) and G6-(C-DOTA-Gd)115(G6) has been reported elsewhere.[32] We have recently reported a preference for the premetallation method for the conjugation of these Gd(III) chelates to macromolecules in which non-specific binding of the Gd(III) can be eliminated as well as the elimination of the population of vacant appended chelating agents that might interact with endogenous metal ions.[33] Non-specific binding of metal ions to protein has been observed,[26–27] which might not be as stable as the specific binding through a bifunctional ligand. The stability of Gd(DOTA) and Gd(DTPA) are well documented and both have also been well defined as MRI contrast agents.[17, 41] A UV-Vis spectrophotometric titration method was used to assess the number of chelates per protein for the two conjugates prepared by the pre-metallation method (see experimental).[32] We have previously shown this method to correlate well with combustion analysis methods.[32]
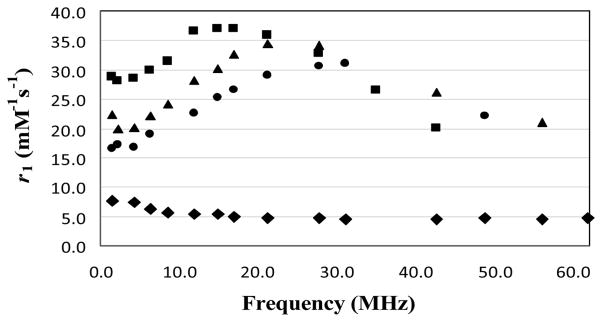
A plot of the inverse of longitudinal relaxation time (1/T1) versus Gd(III) concentration for the Gd-Albumin conjugates (0.1–1 mM) and MagnevistTM (0.25–2mM) is shown in Fig. 3. The data showed that the relaxivity of the three albumin based agents (8.8–10.4 mM−1s−1) is comparable and slightly more than two times higher than that of the MagnevistTM. The 1/T1 NMRD profiles of the three albumin conjugates at 23°C are depicted in Fig. 4, wherein the relaxivity for HSA-1B4Mpost, HSA-1B4Mpre and HSA-DOTApre peaked at ~17, ~22 and ~27 MHz, respectively. These values are well within the range of the field strength of clinical MRI instrumentations (2–180 MHz).
Fig. 3.
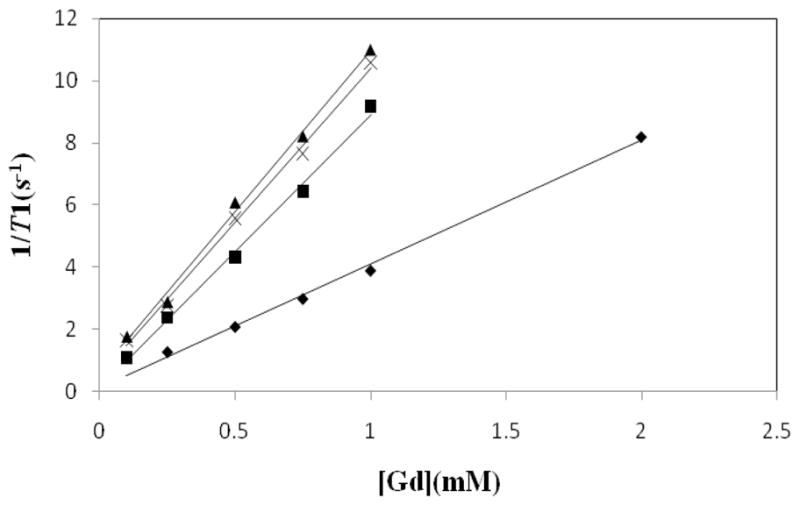
Molar relaxivity plots of MagnevistTM (◆; 4.0 mM−1s−1 ), (HAS-1B4Mpost)(■; 8.8 mM−1s−1 ), (HSA-1B4Mpre)(×; 9.7 mM−1s−1 ), (HSA-DOTApre)(▲; 10.4 mM−1s−1 ) measured at 3T.
Fig. 4.
1/T1 NMRD profiles of 1 mM MagnevistTM(◆), HSA-1B4Mpost (●), HSA-1B4Mpre (▲) and HSA-DOTApre (■), as a function of frequencies (0.02 to 1.5 T; 1–64 MHz) at 23°C.
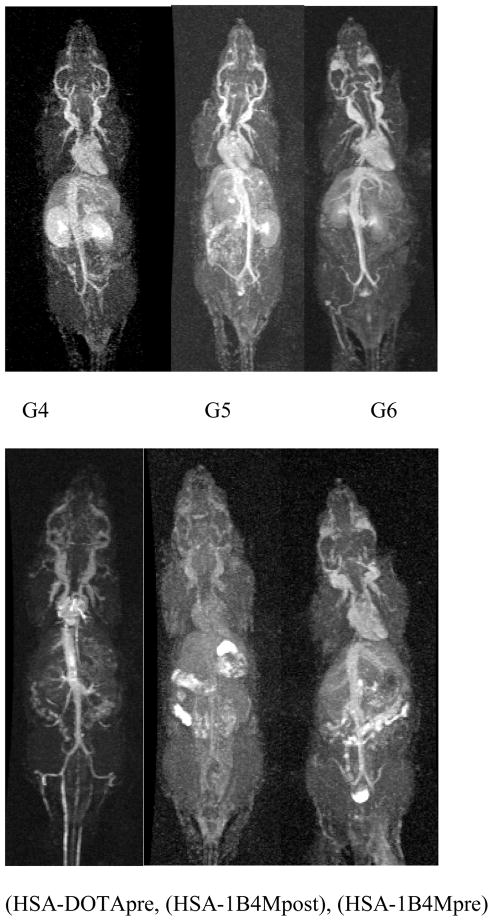
Dynamic contrast-enhanced MR images of the six agents at 16–24 min post-injection are shown in Fig. 5. Based on the images one notes that the circulation properties between the dendrimer and albumin based agents are different. As expected, the dendrimer series showed a progression of accumulation in the kidney wherein the G5 conjugate was bracketed in between the slower clearing G6 and the faster G4 agents. The G6 agent, however, allowed a clearer and finer visualization of the blood vessels, as well as higher signal intensity in the cranial region as compared to the others, which could be useful as a brain imaging agent. Among the three albumin conjugates HSA-DOTApre conjugate produced a higher whole body contrast image including the root of the tail vein region. This indicates the macrocyclic based agent to be more suitable for in vivo applications. To the best of our knowledge this is the first time that the MRI properties of two different albumin-based agents have been directly compared.
Fig. 5.
Whole body dynamic MR images of mice injected with 10 μmol/kg of G4–6 (top; left to right) and 20 μmol/kg of (HSA-DOTApre), (HSA-1B4Mpost), (HSA-1B4Mpre) (bottom; left to right). Images were acquired at 16–24 min post-injection.
The in vivo average blood clearance rates were measured at the jugular vein for all agents with the clearance data fit to a single exponential decay (Fig. 6). Table 1 summarizes the overall results for the six agents. The three albumin based agents have comparable values of protein to chelate ratio (1:16–18) and molar relaxivity (8.8–10.4 mM−1s−1), as well as the blood clearance half-lives (40–47 min) whereas the differences in the ranges of dendrimer to chelate ratios (28–115), their respective molar relaxivities (29–89 mM−1s−1), and their respective blood clearance half-lives (17–66 min) are large for dendrimer conjugates as expected correlating with the increase in generation number which then related directly to their size. Kobayashi et al has reported two phases of blood clearance, the faster (earlier time point) and the slower (later time point), using 153Gd-labeled dendrimer conjugates.[42] The blood clearance half-lives obtained for G5, G6 and the three albumins with MRI did not cover the complete clearance profile. Unfortunately, it is not possible to anesthetize and scan the animals for the hours necessary to obtain the whole clearance curve, a major limitation with the dynamic MRI condition. The preparation of all the current agents labeled with a radioactive gadolinium to unequivocally obtain their full blood clearance profiles is planned for future studies. Also we plan to study the potential immune-response behavior of the albumin and dendrimer conjugates reported here. This is an issue that needs to be considered carefully given any interest existing in actual clinical translation of such agents.
Fig. 6.
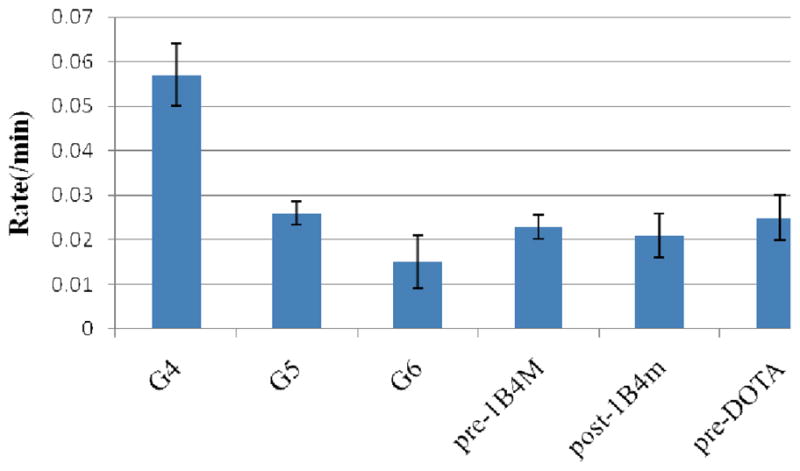
Average blood clearance rates measured at the jugular vein of the dendrimer and albumin conjugates.
Table 1.
Summary of results for dendrimer and albumin conjugates
| Agent | No. of chelates | r1 (mM−1s−1) | Half life (min) | Rate of clearance (min−1) |
|---|---|---|---|---|
| G4 | 28 a | 29.6 a | 17.5 ± 3 | 0.057 ± 0.007 |
| G5 | 61 a | 49.8 a | 38.5 ± 7 | 0.026 ± 0.0026 |
| G6 | 115 a | 89.1a | 67.7 ± 10 | 0.015 ± 0.006 |
| HSA-DOTApre | 18 | 10.4 | 40.1 ± 6 | 0.025 ± 0.0027 |
| HSA-1B4Mpre | 16 | 9.7 | 43.5 ± 6 | 0.023 ± 0.005 |
| HSA-1B4Mpost | 18 | 8.8 | 47.6 ± 5 | 0.021 ± 0.005 |
From previous report.[32]
The blood clearance plot in Fig. 6 illustrates the differences in circulation properties between the six agents that were evaluated. As expected, the rate of clearance of G4is the fastest whereas that of the G6 is the slowest, unsurprisingly based on the molecular weight and size differences. However, the blood clearance half-life of the G6 with derivatized DOTA here is significantly shorter than the previously reported G6 with DTPA derivative (1B4M) (66 vs. 132 min) that was prepared by the post-metallation route as well.[43] The major reason for this lies in the difference in molecular weight (140,000 vs. 240,000) indicating a smaller and more compact agent,[44] and to a certain degree it might depend on a more overall hydrophobic nature of the current agent due to the lower number of chelates (256 vs. 115) and thus higher number of unoccupied free amines on the surface of the dendrimer. The amino surface groups of the dendrimer are known to be positively charged at neutral pH.[45] Hydrophobic agents are known to be rapidly excreted through the liver due to an increased rate of hepatocellular uptake.[46] This enhanced clearance rate eliminates concerns in the aspects of the deposition of the metal chelate in vivo due to a prolonged circulation and residence of the agent, and dissociation of the toxic metal ion from the ligand cavity due to the competition from other anionic ligands in vivo for metal binding. It also eliminates another concern of in vivo toxicity of cationic PAMAM dendrimers as pointed out by other researchers.[47] In addition, the dose employed for in vivo imaging (0.010 and 0.020 mmol/kg for both dendrimer and albumin conjugates) is much lower than that is routinely employed with the clinically approved agents such as MagnevistTM (0.1–0.3 mmol/kg), and is also ~1/3 the dose (Gd(III) concentration basis) used in the majority of our prior studies with dendrimer-based MR contrast agents.[48]
Table 2 compares molecular weights, sizes, and the ζ potentials of the six agents. The size and ζ potential of the albumin conjugates determined here is based on a 1 mM (based on Gd3+) solution prepared in ambient water at pH = 6 to eliminate buffer interference (Table 2), a condition that is similar to what was previously used for the three dendrimer conjugates.[32] As noted earlier, size measurement based on photon correlation spectroscopy (PCS) is sensitive to concentration,[39] and also buffer.[49] As expected, the G6 conjugate was found to have the largest size and molecular weight (Table 2) and thus correlates to having the highest impact on the relaxivity (Table 1). This reinforces the statement that the subsequent increases in size and molecular weight results in increased relaxivity.[49–51] As reported earlier, relaxivity is linearly correlated to the size of the dendrimer based agents.[32] This is a major benefit from attaching a small chelate to a large macromolecule in which the associated tumbling time of the molecule increases leading to increases in relaxation enhancement.[52]
Table 2.
Values of molecular weight, size and ζ potential for the agents.
| Agent | Molecular Weight | Measured Diameter (nm) | ζ Potential |
|---|---|---|---|
| G4 | 34,066 | 5.2 | −60 |
| G5 | 72,057 | 6.5 | −65 |
| G6 | 139,571 | 7.8 | −69 |
| HSA-DOTApre | 76030a | 6.3 | −55 |
| HSA-1B4Mpre | 75320a | 6.2 | −53 |
| HSA-1B4Mpost | 75320a | 5.9 | −53 |
Based on average albumin molecular weight of 66,800.
However, the size and molecular weight to relaxivity comparison failed to hold true between albumin and dendrimer conjugates. For example, the G5 and the albumin conjugates have comparable sizes (~6 nm) as well as molecular weight (~75,000), but their differences in relaxivity (9–10 vs. 50 mM−1s−1) are rather large. The explanation for the difference lies on the significant difference in the number of chelates attached between the two types of agents (12 vs. 61). Relaxivity was observed to be linearly correlated to the number of conjugated chelates; the greater the number of chelates, the greater the relaxivity (Fig. 7). This indicates that the size, molecular weight and the number of chelates are all important parameters to consider when designing macromolecular MRI contrast agents.
Fig. 7.
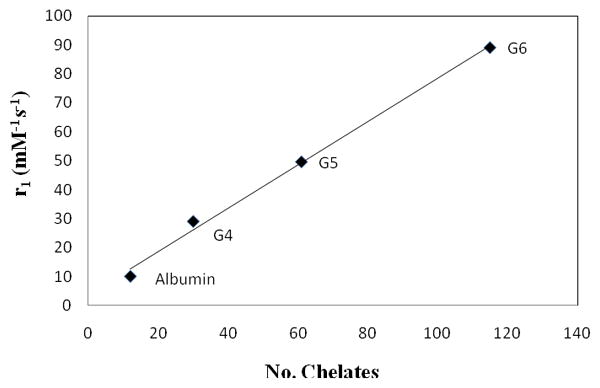
A plot of relaxivity as a function of the number of chelates.
Zeta potential (ζ) indicates the accumulation of ions at the particle surface.[39] The overall surface charge or ζ potential of the G6 agent is the highest due to the highest density of surface charge as expected (Table 2). Also, high positive or negative charge ζ potential is indicative of high electrostatic repulsion between particles and provides an energy barrier against aggregation.[39] The ζ potentials of the three albumin conjugates are virtually the same, but slightly lower than that of the dendrimer conjugates. This might have to do with their once again possessing a diminished number of chelates and thus a lower number of carboxylates from the bifunctional ligands, or maybe more likely that there are a lot of charged peptide residues at the surface. Since all of the agents have negative ζ potential (53–69) based on the data obtained, one can assume the likelihood of each agent to aggregate to be low. This will be advantageous for in vivo applications where aggregation could interfere with glomerular filtration clearance through kidney, which would be the preferred excretion route.[53]
In summary, our study demonstrates that the pre-metallation method, either with the DOTA or DTPA bifunctional ligand, can be applied to form either dendrimer- or protein-based conjugates. This method is far more convenient and significantly more advantageous in areas including species distribution, ease of characterization, stability, and solubility. This study also shows that macromolecular MRI contrast agents composed of multiple Gd(III) chelates assembled on either a dendrimer or a protein platform are much more efficient and effective in modulating and relaxing water protons as compared to a single chelate unit analogue. Gd(DOTA)−1 is thermodynamically stable and kinetically inert,[1–3, 54] and has been used as a contrast agent to study central nervous system such as intracranial lesions.[4] A characteristic that is similar to Gd(DTPA), such as mild contrast uptake in patient with recent cerebellar infarct,[55–56] was observed. Based on these results, the macrocycle-based MRI contrast agents continue to be the major focus of future studies.
Acknowledgments
This research was supported by the Intramural Research Program of the NIH, National Cancer Institute, Center for Cancer Research.
References
- 1.Cacheris WP, Nickle SK, Sherry AD. Inorg Chem. 1987;26:958–960. [Google Scholar]
- 2.Brücher E, Laurenczy G, Makra ZS. Inorg Chim Acta. 1987;139:141–142. [Google Scholar]
- 3.Geraldes CFGC, Sherry AD, Lázár I, Miseta A, Bogner P, Berenyi E, Sumegi B, Kiefer GE, McMillan K, Maton F, Muller RN. Magnetic Resonance in Medicine. 1993;30:696–703. doi: 10.1002/mrm.1910300607. [DOI] [PubMed] [Google Scholar]
- 4.Parizel PM, Degryse HR, Gheuens J, Martin J-J, Vyve MV, De La Porte C, Selosse P, Van de Heyning P, De Schepper AM. J Comput Assist Tomogr. 1989;13:378–385. doi: 10.1097/00004728-198905000-00002. [DOI] [PubMed] [Google Scholar]
- 5.Runge VM, Jacobson S, Wood ML, Kaufman D, Adelman LS. Radiol. 1988;166:835–838. doi: 10.1148/radiology.166.3.3401296. [DOI] [PubMed] [Google Scholar]
- 6.Koyama Y, Talanov VS, Bernardo M, Hama Y, Regino CAS, Brechbiel MW, Choyke PL, Kobayashi H. J Magn Reson Imaging. 2007;25:866–871. doi: 10.1002/jmri.20852. [DOI] [PubMed] [Google Scholar]
- 7.Sato N, Kobayashi H, Hiraga A, Saga T, Togashi K, Konishi J, Brechbiel MW. Magn Reson Med. 2001;46:1169–1173. doi: 10.1002/mrm.1314. [DOI] [PubMed] [Google Scholar]
- 8.Kobayashi H, Brechbiel MW. Mol Imaging. 2003;2:1–10. doi: 10.1162/15353500200303100. [DOI] [PubMed] [Google Scholar]
- 9.Bourne MW, Margerun L, Hylton N, Campion B, Lai J-J, Derugin N, Higgins CB. J Magn Reson Imaging. 1996;6:305–310. doi: 10.1002/jmri.1880060209. [DOI] [PubMed] [Google Scholar]
- 10.Erik W, Brechbiel MW, Brothers H, Magin RL, Gansow OA, Tomalia DA, Lauterbur PC. Magn Reson Med. 1994;31:1–8. doi: 10.1002/mrm.1910310102. [DOI] [PubMed] [Google Scholar]
- 11.Kobayashi H, Kawamoto S, Jo S-K, Bryant HL, Brechbiel MW, Star RA. Bioconjugate Chem. 2003;14:388–394. doi: 10.1021/bc025633c. [DOI] [PubMed] [Google Scholar]
- 12.Tomalia DA, Reyna LA, Svenson S. Biochem Soc Trans. 2007;035:61–67. doi: 10.1042/BST0350061. [DOI] [PubMed] [Google Scholar]
- 13.Barth RF, Adams DM, Soloway AH, Alam F, Darby MV. Bioconjugate Chem. 1994;5:58–66. doi: 10.1021/bc00025a008. [DOI] [PubMed] [Google Scholar]
- 14.Kobayashi H, Wu C, Kim M-K, Paik CH, Carrasquillo JA, Brechbiel MW. Bioconjugate Chem. 1998;10:103–111. doi: 10.1021/bc980091d. [DOI] [PubMed] [Google Scholar]
- 15.Singh P, Moll F, 3rd, Lin SH, Ferzli C, Yu KS, Koski RK, Saul RG, Cronin P. Clin Chem. 1994;40:1845–1849. [PubMed] [Google Scholar]
- 16.Wu C, Brechbiel MW, Kozak RW, Gansow OA. Bioorg Med Chem Lett. 1994;4:449–454. [Google Scholar]
- 17.Lauffer RB. Chem Rev. 1987;87:901–927. [Google Scholar]
- 18.Peters T, Jr, Oscar B, Stewart CP. Advances in Clinical Chemistry. Vol. 13. Elsevier; 1970. pp. 37–111. [DOI] [PubMed] [Google Scholar]
- 19.Peters T., Jr . Academic Press. Vol. 1. New York: 1975. pp. 133–181. [Google Scholar]
- 20.Kiessling F, Fink C, Hansen M, Bock M, Sinn H, Schrenk HH, Krix M, Egelhof T, Fusenig NE, Delorme S. Invest Radiol. 2002;37:193–198. doi: 10.1097/00004424-200204000-00004. [DOI] [PubMed] [Google Scholar]
- 21.Sinn H, Schrenk HH, Friedrich EA, Schilling U, Maier-Borst W. Int'l J Rad Appl Inst Part B Nuc Med Biol. 1990;17:819–825. 827. doi: 10.1016/0883-2897(90)90031-u. [DOI] [PubMed] [Google Scholar]
- 22.Schilling U, Friedrich EA, Sinn H, Schrenk HH, Clorius JH, Maier-Borst W. Int'l J Rad Appl Inst Part B Nuc Med Biol. 1992;19:685–691. 693–695. doi: 10.1016/0883-2897(92)90103-6. [DOI] [PubMed] [Google Scholar]
- 23.Stehle G, Sinn H, Wunder A, Schrenk HH, Stewart JCM, Hartung G, Maier-Borst W, Heene DL. Crit Rev Oncol/Hematol. 1997;26:77–100. doi: 10.1016/s1040-8428(97)00015-2. [DOI] [PubMed] [Google Scholar]
- 24.Marzola P, Degrassi A, Calderan L, Farace P, Crescimanno C, Nicolato E, Giusti A, Pesenti E, Terron A, Sbarbati A, Abrams T, Murray L, Osculati F. Clin Cancer Res. 2004;10:739–750. doi: 10.1158/1078-0432.ccr-0828-03. [DOI] [PubMed] [Google Scholar]
- 25.Marzola P, Degrassi A, Calderan L, Farace P, Nicolato E, Crescimanno C, Sandri M, Giusti A, Pesenti E, Terron A, Sbarbati A, Osculati F. Clin Cancer Res. 2005;11:5827–5832. doi: 10.1158/1078-0432.CCR-04-2655. [DOI] [PubMed] [Google Scholar]
- 26.Unger EC, Totty WG, Neufeld DM, Otsuka FL, Murphy WA, Welch MS, Connett JM, Philpott GW. Invest Radiol. 1985;20:693–700. doi: 10.1097/00004424-198510000-00008. [DOI] [PubMed] [Google Scholar]
- 27.Hnatowich DJ, Layne WW, Childs RL. Int'l J Appl Rad Iso. 1982;33:327–332. doi: 10.1016/0020-708x(82)90144-2. [DOI] [PubMed] [Google Scholar]
- 28.Niemi P, Koskinen S, Reisto T. Invest Radiol. 1991;26 doi: 10.1097/00004424-199107000-00012. [DOI] [PubMed] [Google Scholar]
- 29.Wang Z, Su M-Y, Najafi A, Nalcioglu O. Magn Reson Imaging. 2001;19:1063–1072. doi: 10.1016/s0730-725x(01)00431-3. [DOI] [PubMed] [Google Scholar]
- 30.Boschi F, Marzola P, Sandri M, Nicolato E, Galiè M, Fiorini S, Merigo F, Lorusso V, Chaabane L, Sbarbati A. Magn Reson Mat Phys, Biol Med. 2008;21:169–176. doi: 10.1007/s10334-008-0106-6. [DOI] [PubMed] [Google Scholar]
- 31.Ogan MD, Schmiedl U, Moseley ME, Grodd W, Paajanen H, Brasch RC. Invest Radiol. 1987;22:665–671. [PubMed] [Google Scholar]
- 32.Nwe K, Bryant LH, Brechbiel MW. Bioconjugate Chem. 2010;21:1014. doi: 10.1021/bc1000802. [DOI] [PMC free article] [PubMed] [Google Scholar]
- 33.Nwe K, Xu H, Regino CAS, Bernardo M, Ileva L, Riffle L, Wong KJ, Brechbiel MW. Bioconjugate Chem. 2009;20:1412. doi: 10.1021/bc900057z. [DOI] [PMC free article] [PubMed] [Google Scholar]
- 34.Nwe K, Bernardo M, Regino CAS, Williams M, Brechbiel MW. Bioorg Med Chem. 2010 doi: 10.1016/j.bmc.2010.06.086. in press. [DOI] [PMC free article] [PubMed] [Google Scholar]
- 35.Lowry OH, Rosebrough NJ, Farr AL, Randall RJ. J Biol Chem. 1951;193:265. [PubMed] [Google Scholar]
- 36.Barge A, Cravotto G, Gianolio E, Fedeli F. Contrast Media Mol Imaging. 2006;1:184–188. doi: 10.1002/cmmi.110. [DOI] [PubMed] [Google Scholar]
- 37.Pippin CG, Parker TA, McMurry TJ, Brechbiel MW. Bioconjugate Chem. 1992;3:342. doi: 10.1021/bc00016a014. [DOI] [PubMed] [Google Scholar]
- 38.Murad GJA, Walbridge S, Morrison PF, Garmestani K, Degen JW, Brechbiel MW, Oldfield EH, Lonser RR. Clin Cancer Res. 2006;12:3145. doi: 10.1158/1078-0432.CCR-05-2583. [DOI] [PubMed] [Google Scholar]
- 39.Suvarna S, Espinasse B, Qi R, Lubica R, Poncz M, Cines DB, Wiesner MR, Arepally GM. Blood. 2007;110:4253–4260. doi: 10.1182/blood-2007-08-105098. [DOI] [PMC free article] [PubMed] [Google Scholar]
- 40.William Wilson W. J Struct Biol. 2003;142:56–65. doi: 10.1016/s1047-8477(03)00038-8. [DOI] [PubMed] [Google Scholar]
- 41.Kumar K, Tweedle MF. Inorg Chem. 1993;32:4193–4199. [Google Scholar]
- 42.Kobayashi H, Sato N, Hiraga A, Saga T, Nakamoto Y, Ueda H, Konishi J, Togashi K, Brechbiel MW. Magn Reson Med. 2001;45:454. doi: 10.1002/1522-2594(200103)45:3<454::aid-mrm1060>3.0.co;2-m. [DOI] [PubMed] [Google Scholar]
- 43.Kobayashi H, Sato N, Kawamoto S, Saga T, Hiraga A, Haque TL, Ishimori T, Konishi J, Togashi K, Brechbiel MW. Bioconjugate Chemistry. 2000;12:100–107. doi: 10.1021/bc000075s. [DOI] [PubMed] [Google Scholar]
- 44.Chang RL, Ueki IF, Troy JL, Deen WM, Robertson CR, Brenner BMBM. Biophys J. 1975;15:887–906. doi: 10.1016/S0006-3495(75)85863-2. [DOI] [PMC free article] [PubMed] [Google Scholar]
- 45.Adamson RH, Clough G. The Journal of Physiology. 1992;445:473–486. doi: 10.1113/jphysiol.1992.sp018934. [DOI] [PMC free article] [PubMed] [Google Scholar]
- 46.Schuhmann-Giampieri G, Schmitt-Willich H, Press WR, Negishi C, Weinmann HJ, Speck U. Radiology. 1992;183:59–64. doi: 10.1148/radiology.183.1.1549695. [DOI] [PubMed] [Google Scholar]
- 47.Neermana MF, Zhanga W, Parrishb AR, Simaneka EE. Int J Pharm. 2004;281:129–132. doi: 10.1016/j.ijpharm.2004.04.023. [DOI] [PubMed] [Google Scholar]
- 48.Xu H, Regino CAS, Bernardo M, Koyama Y, Kobayashi H, Choyke PL, Brechbiel MW. J Med Chem. 2007;50:3185–3193. doi: 10.1021/jm061324m. [DOI] [PubMed] [Google Scholar]
- 49.Margerum LD, Campion BK, Koo M, Shargill N, Lai J-J, Marumoto A, Christian Sontum P. J Alloys Compd. 1997;249:185–190. [Google Scholar]
- 50.Weiner EC, Brechbiel MW. Magn Reson Med. 1994;31:1–8. doi: 10.1002/mrm.1910310102. [DOI] [PubMed] [Google Scholar]
- 51.Bryant LH, Jr, Martin WB, Wu C, Bulte JWM, Herynek V, Frank JA. J Magn Reson Imaging. 1999;9:348–352. doi: 10.1002/(sici)1522-2586(199902)9:2<348::aid-jmri30>3.0.co;2-j. [DOI] [PubMed] [Google Scholar]
- 52.Koenig SH, Brown RD. Prog Nuc Magn Res Spect. 1990;22:487–567. [Google Scholar]
- 53.Vexler VS, Clément O, Schmitt-Willich H, Brasch RC. J Magn Reson Imaging. 1994;4:381. doi: 10.1002/jmri.1880040325. [DOI] [PubMed] [Google Scholar]
- 54.Wang X, Jin T, Comblin V, Lopez-Mut A, Merciny E, Desreux JF. Inorg Chem. 1992;31:1095–1099. [Google Scholar]
- 55.Virapongse C, Mancuso A, Quisling R. Radiol. 1986;161:785–794. doi: 10.1148/radiology.161.3.3786734. [DOI] [PubMed] [Google Scholar]
- 56.Imakita S, Nishimura T, Naito H, Yamada N, Yamamoto K, Takamiya M, Yamada Y, Sakashita Y, Minamikawa J, Kikuchi H, Terada T. Neuroradiol. 1987;29:422–429. doi: 10.1007/BF00341737. [DOI] [PubMed] [Google Scholar]


