Abstract
The inferior colliculus has been well studied for its role of transmitting information from the brainstem to the thalamocortical system. However, it is also the source of a major pathway to the cerebellum, via the pontine gray (PG). We compared auditory responses from single neurons in the medial geniculate body (MGB) and PG of the awake big brown bat. MGB neurons were selective for a variety of stimulus types whereas PG neurons only responded to pure tones or simple FM sweeps. Best frequencies (BF) in MGB ranged from 8 KHz to > 80 kHz. BFs of PG neurons were all above 20 kHz with a high proportion above 60 kHz. The mean response latency was 19 ms for MGB neurons and 11 ms for PG neurons. MGB and PG contained neurons with a variety of discharge patterns but the most striking difference was the proportion of neurons with responses that lasted longer than the stimulus duration (MGB 13%, PG 58%). Both nuclei contained duration-sensitive neurons; the majority of those in MGB were band pass whereas in the PG they were long pass. Over half of the neurons in both nuclei were binaural. Differences between these nuclei are consistent with the idea that the thalamocortical pathway performs integration over time for cognitive analysis, thereby increasing selectivity and lengthening latency, while the colliculo-pontine pathway, which is more concerned with sensory-motor control, provides rapid input and a lasting trace of an auditory event.
Keywords: medial geniculate, pontine gray, auditory, electrophysiology, temporal processing, binaural processing
1. Introduction
One important function of sound, including communication signals, is to direct attention and motor behavior toward stimuli that are of potential interest to the organism. The inferior colliculus (IC) is the first level at which there are integrative processes that could perform something akin to cognitive processing [1,2,3,4] and distribute this information to pathways that access different functional systems.
It is a well-known fact that one of the principal targets of output from the IC is the medial geniculate body (MGB), which in turn projects to the auditory cortex (AC). The MGB of echolocating bats is structurally similar to that of other mammals, and large relative to total brain size. It has been extensively studied for its cytoarchitecture, basic response properties, and input and output pathways [5.6.7,8,9,10,11,12]. In bats, the MGB neurons that pass information from the IC to the auditory cortex have been shown to be highly selective for duration, binaural properties, and sound frequency [13]. Both MGB and AC retain some order of tonotopic organization, but orthogonal to this there may be other topographic organizations such as binaural properties [9].
The auditory ponto-cerebellar pathway is less well known than the thalamocortical pathway. Projections from the IC to the pontine grey (PG) have been shown to be robust in the bat [9,14,15,16], but limited in the guinea pig [17], and cat [18,19], and reportedly absent in the rat [20,21]. The PG projects to certain areas in the cerebellum that control flight motion and vocalization, suggesting that it plays an important role in coordinating or fine-tuning echolocation calls, perception of objects in the environment, and flight patterns [16,22]. In all of the bats that have been studied, tonotopy appears to be limited or absent in the PG [16,23]. Wu and Jen [24] reported that IC and PG neurons follow higher pulse repetition rates than cortical neurons, suggesting that they have a shorter recovery time. Kamada et al. [23] found that there were more non-monotonic neurons in the PG than monotonic, suggesting that neurons in this area are most responsive to low intensity sounds. Kamada and Jen [22] reported that cerebellar neurons were more sensitive to FM tones than pure tones, they were onset responders, and tended to focus predominantly on sound sources located near the midline of the auditory field.
The goal of our study was to compare the basic response properties of neurons in the MGB and PG of the same species, using the same stimulus paradigms. Our hypothesis was that these two pathways process information differently, with the MGB performing enhancement and filtering necessary for cognitive processing, and the PG extracting information necessary for ongoing regulation of motor responses.
2. Methods
18 big brown bats (Eptesicus fuscus) of both sexes were used in this study. To prepare a bat for electrophysiological recording, a small stainless steel post was attached to the skull. This surgical procedure has previously been described by Miller et al. [25]. On the day that the post was attached, a small opening was made in the skull overlying both the MGB and PG for insertion of the electrode. The opening was then sealed with bone wax until the day of the recording. Recording began 1–4 days after surgery. Each bat was used in 2 to 8 recording sessions lasting ~6 hr/day. Experiments were terminated if the bat showed signs of discomfort. Between sessions, the opening was covered with Gelfoam and coated with sterile petroleum jelly. Bats were housed in individual cages in a temperature- and humidity-controlled environment and were given ad libitum access to food and water. All procedures were approved by the University of Washington Institutional Animal Care and Use Committee.
2.1 Acoustical Stimuli
Acoustical stimuli were synthesized in the same manner as previously described by Faure et al. [26]. Stimuli were presented to the two ears via two Bruel & Kjaer (B&K) type 4135 1/4-inch condenser microphones modified for use as loudspeakers with a circuit to correct for nonlinearities in the transfer function [27]. The transducer was positioned so that its diaphragm was ~1 mm in front of the external auditory meatus. The output of the loudspeaker, measured with a B&K type 4138 1/8-inch condenser microphone calibrated with a B&K Type 4220 sound level calibrator, is expressed in decibels of sound pressure level (SPL root mean square with regard to 20 μPa) equivalent to the peak amplitude of continuous tones of the same frequency [28]. The transfer function of the transducer was flat ±5 dB from 26 to 118 kHz (measured 1 to 134 kHz). All signals had rise-fall times of 0.4 ms and were presented randomly at a repetition rate of 2 or 3 pulses per second. Stimuli included pure tones, broadband noise, frequency sweeps (FM) and sinusoidally frequency-modulated tones (SFM). Cross talk between the two ears was tested as previously described by Ehrlich et al. [29] Attenuation at the ear opposite the sound source was determined to be 30 dB or greater.
When a single unit was isolated, we conducted routine tests to determine whether it responded best to pure tones, noise, FM, or SFM, and whether its responses were monaural or binaural. Neurons were defined as selective for a given stimulus type if they responded exclusively to that class of stimulus. If the unit responded to pure tones, the best frequency (BF) and minimum threshold were determined. If the response was exclusively to sweeps, we determined the best sweep depth, center frequency, and minimum threshold. If the response was specific to SFM, we varied modulation rates (10–300 Hz) and modulation depths (1–10 kHz). All units were tested for duration sensitivity by varying duration in two tests (1–20 ms in 1ms increments and 10–100 ms in 10 ms increments) using stimuli 20 dB above threshold at the unit’s BF or best sweep parameters. A neuron was considered duration sensitive if it responded best over a specific range of durations. To be considered duration-sensitive, the spike count in response to non-optimal durations had to be less than 50% of the spike count in response to the optimal duration range. Short pass units fired at all durations under a specific length, long pass units fired at all durations longer than a specific length, and band-pass units fired most strongly at some intermediate range of durations with decreased response on either side. If the unit responded binaurally (as determined by comparing average binaural level to interaural level difference [30], we determined its binaural class according to the nomenclature provided by Fuzessery et al. [31]. Units were classified as binaurally suppressed if the firing rate decreased by ≥20%, or binaurally facilitated if the firing rate increased by ≥20% of the monaural firing rate. Rate-level functions plotted spike counts as a function of sound level for stimuli at BF or best sweep/SFM parameters, and best duration. Nonmonotonic rate-level functions were defined as those in which an initial increase in spike count was followed by ≥25% decrease in spike count at higher levels.
2.2 Electrophysiology
Electrophysiological recordings were conducted in a double-walled, sound-attenuating chamber (Industrial Acoustics Co., Inc, New York, NY). Before recording, each bat was given a subcutaneous injection of a neuroleptic (19.1 mg/kg Fentanyl/Droperidol mixture, Abbott Laboratories, North Chicago, IL). Bats were then placed in a foam-lined body restraint that was suspended in a flexible sling supported by springs within a stereotaxic frame (ASI Instruments, Warren, MI) mounted atop a floating vibration table (TMC, Inc., Peabody, MA). The head post was clamped in a customized holder mounted on a stereotaxic micromanipulator (David Kopf Instruments, Tujunga, CA). A chlorided silver wire was placed under the temporal musculature to serve as a reference electrode. The bone wax that covered the opening in the skull was removed and the dura was cut for insertion of the recording electrode. Neural responses were recorded with glass micropipettes filled with one of the following solutions: 5% Fluororuby (FR, tetramethylrhodamine dextran, 10000 MW, Invitrogen, Carlsbad, CA, in 0.9% sterile saline), 5% Fluorogold (FG, 2-hydroxy-4, 4′-diamidinostilbene; Fluorochrome Inc, Denver, CO, in 0.9% sterile saline), or a 0.9% solution of sterile saline. The tip diameters of the electrodes ranged from ~1 to 10 μm with impedances that varied from 10MΩ to 80 MΩ. Electrodes were aimed and lowered to MGB or PG based on stereotaxic coordinates. Electrodes were advanced with a stepping hydraulic micropositioner (David Kopf Instruments model 650). Action potentials were recorded with a Neuroprobe amplifier (A-M Systems model 1600), the 10x output of which was further amplified and band-pass-filtered (Tucker Davis Technologies (TDT), Alachua, FL, PC1; filter cutoff, 700 Hz and 3 kHz), and passed through a spike discriminator (TDT SD1). Spike times were logged on a computer by feeding the output of the spike discriminator into an event timer (TDT ET1) synchronized to a timing generator (TDT TG6). Stimulus generation and on-line data visualization were controlled by custom software. Spike times were displayed as dot rasters ordered by the acoustic parameter that was randomized during testing.
Recordings were made in both the PG and MGB of each animal tested.
2.3 Histology
Injections of FG and FR were made into selected recording sites in the MGB or PG. Both tracers were injected iontophoretically using pulsed (7 sec on/off) positive current (4–5 μA) for 5–10 minutes. Afterwards, electrodes were removed while applying a small continuous negative current (−2 μA) to reduce leakage. After 5 to 7 days animals were deeply anesthetized and transcardially perfused with 0.9% saline followed by 4% paraformaldehyde solution. Brains were cryoprotected (30% sucrose in 0.1 M phosphate buffered saline) overnight, and the next day 40 μm sections were cut on a freezing microtome and placed into 0.1M phosphate buffered saline. Sections were mounted onto chrome-alum slides, air-dried, dehydrated in a concentration series of ethanol and xylene, and then coverslipped for subsequent microscopic analysis. Once the brain was removed from the skull all procedures were performed in low-light conditions to prevent photo-bleaching of fluorescent tracers. Additionally, two coronally sectioned, cresyl violet-stained brains from previous experiments were used to examine cytoarchitecture.
2.4 Data analysis and image processing
All injection locations were plotted using fluorescent microscopy, with Chroma Technology Corp. (Rockingham, VT) filter cubes 11000 (FG) and 31004 (FR). Digital photomicrographs were taken using a Leica 300F digital camera on a Leica DMR microscope (Leica Microsystems, Bannockburn, IL). Digital photo-montages were created using Photoshop 7.0 (Adobe Inc., San Jose, CA). Locations of injections were plotted and digital reconstructions of electrode tracks and all recording sites were made using Neurolucida software by MBF Bioscience (Williston, VT).
3. Results
3.1 Recording locations
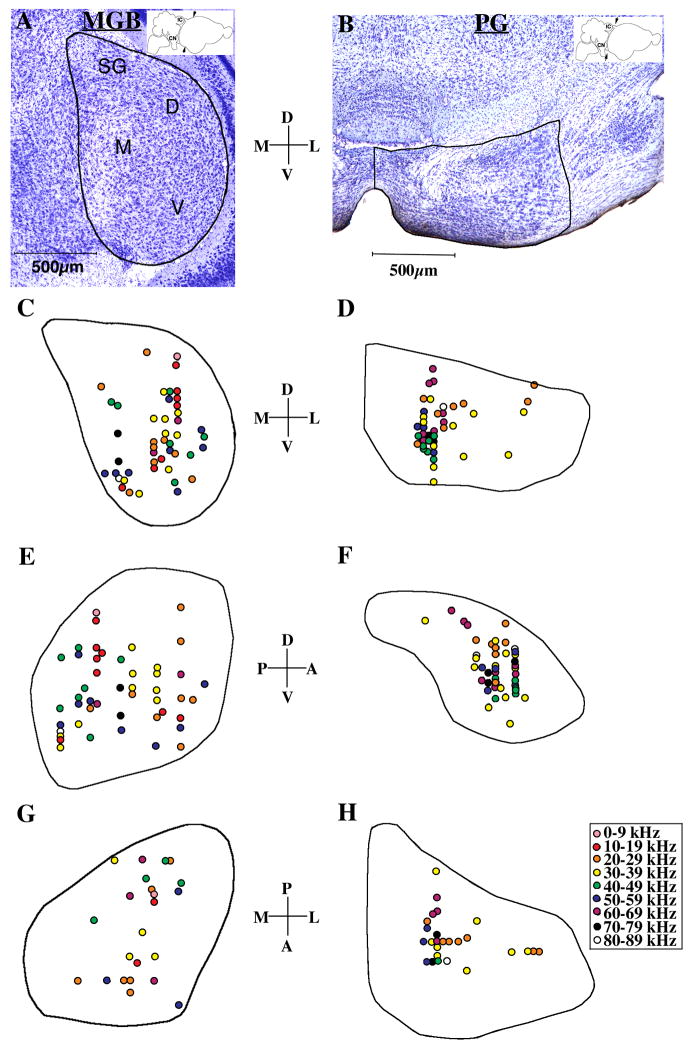
Figure 1A and B shows representative photomicrographs of nissl-stained coronal sections through the central portion of both the MGB and PG. We based our identification of subdivisions in the MGB on those described by Razak et al. [8]. The major subdivisions, MGBd (dorsal), MGBv (ventral), MGBm (medial), and suprageniculate nucleus, SG, are labeled in the nissl-stained section in figure 1A. Fifty-two recording sites were plotted in MGB and forty-three in PG. Reconstructions showing the locations of these recording sites were made in the coronal (1C and D), parasagittal (1E and F), and horizontal (1G and H) planes. The best frequency at each recording site was plotted in order to look for evidence of tonotopic organization.
Figure 1.
Tonotopy in MGB and PG. A, B: Low-power photomicrographs through the central portion of MGB and PG; sections were cut in the coronal plane and stained with cresyl violet. Cartoon drawings of Eptesicus brain with arrows indicate location of section and plane. Subdivisions of MGB are: suprageniculate nucleus (SG), dorsal nucleus (D), medial nucleus (M), and ventral nucleus (V). Representative coronal (1C, 1D), parasagittal (1E, 1F) and horizontal (1G, 1H) reconstructions through the central part of the MGB (C, E, G) and PG (D, F, H), with collapsed locations of recording sites. Neurons are labeled according to best frequency (kHz).
In the collapsed coronal reconstruction of the MGB (Figure 1C), there does not appear to be a clear, continuous tonotopic organization within any subdivision. However, neurons responding to 10–19 kHz and 30–39 kHz are restricted to the medial and central portion of the MGBd and MGBv. The highest frequency neurons were recorded in the medial portion of the MGBv and MGBm. In the collapsed parasagittal reconstruction of MGB (Figure 1E), medium to high frequency (40–89 kHz) neurons are mostly located posteroventrally, with a just a few 50–69 kHz neurons in the anteroventral portion of the MGB. No clear tonotopic organization was observed in the horizontal plane (Figure 1G). No recordings were made in the SG.
In the PG, recording in the most medial portion was restricted due to electrode angle limitations. The most lateral portion of the PG contained very few auditory neurons. Figure 1D and 1H show that high frequency neurons (40–89 kHz) were found only in the medial portion of the recorded area while neurons lateral to this responded best to sounds in the range of 20–39 kHz, suggesting that there is a loose medial-to-lateral tonotopic organization.
3.2 Basic Response Properties
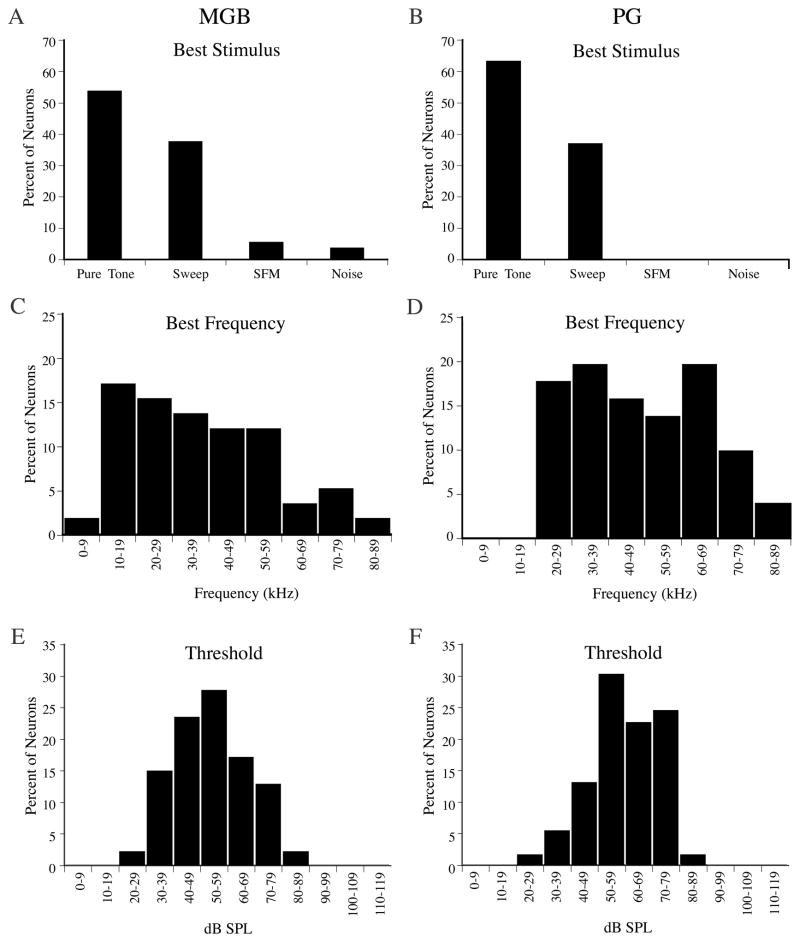
In the MGB, 54% of neurons responded to pure tones, 38% were selective for simple frequency modulated (FM) sweeps, 5% were selective for broadband noise, and 4% were selective for sinusoidally frequency modulated (SFM) tones (Figure 2A). Table 1 shows a breakdown of MGB subdivisions and percent response types. In the PG, 63% of neurons responded to pure tones and 37% were selective for simple FM sweeps (Figure 2B). This distribution was not significant (P=0.142, Fisher exact test). Neurons that were selective for sweeps were much more direction-specific in the MGB than in the PG. 76% of FM-selective neurons in MGB responded exclusively to downward sweeps, 14% responded exclusively to upward sweeps, and only 10% were not direction-specific. Sweep selective neurons in the PG were more varied; 47% responded exclusively to downward sweeps, 20% responded exclusively to upward sweeps, and 33% responded to both directions.
Figure 2.
Response properties of neurons in the MGB (n=56) and PG (n=57). A, B) Selectivity for different classes of auditory stimuli in MGB (A) and PG (B). C, D) Distribution of BFs in MGB (C) and PG (D). E, F) Distribution of minimum threshold levels (dB SPL) for neurons in MGB (E) and PG (F).
Table 1.
| MGB subdivisions | MGBd | MGBrn | MGBv |
|---|---|---|---|
| % PT | 67 | 50 | 45 |
| % Sweep | 28 | 50 | 42 |
| %SFM | 6 | 0 | 3 |
| % Noise | 0 | 0 | 9 |
| Average latencies (ms) | 15 | 6 | 24 |
| % Duration tuned | 11 | 0 | 0 |
| % Transient | 39 | 25 | 24 |
| % Sustained | 6 | 0 | 0 |
| % Burst | 11 | 25 | 33 |
| % Prolonged | 6 | 0 | 9 |
| % Irregular | 11 | 0 | 21 |
| % Monotonic | 18 | 100 | 13 |
| % Nonmonotonic | 82 | 0 | 88 |
| % Monaural | 44 | 100 | 30 |
| % Binaural | 56 | 0 | 70 |
MGB contained a complete representation of frequencies throughout the bat’s audible range, from 8 kHz to > 80 kHz (Figure 2C). In the PG, we found no neurons with BFs below 20 kHz, and a high proportion of neurons had BFs above 60 kHz (Figure 2D). The mean best frequency in MGB was 37kHz±17kHz but in the PG the mean was 46kHz±18kHz (significant; P=0.002, t-test). The median best frequencies were 35 kHz and 45 kHz, respectively (Figure 2C and D).
Figure 2E and 2F show that thresholds at each units BF were slightly different (significant; P=0.004, t-test). Excluding two MGB units and one PG unit with unusually high thresholds, the average mean and median threshold in MGB were 51 dB SPL. In PG the average threshold was 58 dB SPL, and the median 54 dB SPL. Threshold ranges were 19–83 dB SPL in MGB and 27–83 dB SPL in PG.
3.3 Temporal Properties
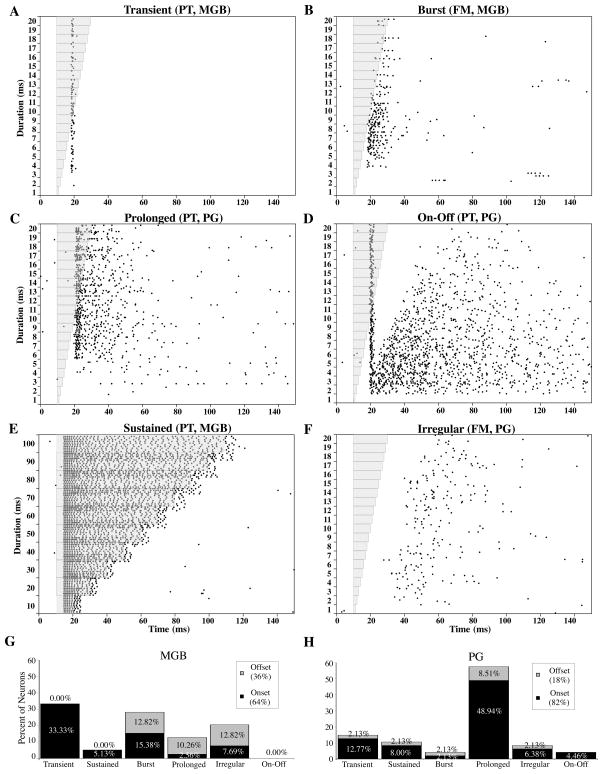
Both nuclei contained neurons with a variety of discharge patterns, examples of which are shown in Figure 3. Discharge patterns were classified as transient (one or two spikes per stimulus, Figure 3A), burst (alternating periods of high- and low-rate firing throughout the stimulus duration, Figure 3B), prolonged (firing that continued longer than the stimulus duration, Figure 3C), on-off (transient onset response followed by a prolonged offset response, Figure 3D), sustained (continuous firing throughout the duration of the stimulus, Figure 3E), and irregular (a firing pattern that could not be classified into any of the previous categories, Figure 3F). Irregular neurons only fired in response to the stimulus, but in a weak, prolonged fashion with no clear pattern. Excluding the on-off neurons found in the PG which only responded to PT’s, neurons exhibiting these other discharge patterns consisted of both PT and FM selective neurons.
Figure 3.
Examples of different discharge patterns encountered in the MGB and PG. A) Transient response, B) Burst response, C) Prolonged response, D) On-Off response, E) Sustained response, F) Irregular response. Gray shading indicates stimulus duration. G and H) Comparison of the relative proportions of each discharge pattern in MGB (G) and PG (H) plotted in terms of response to onset (black) or offset (gray) of stimuli.
Figure 3G and H summarize the distribution of these discharge patterns in MGB and PG. The most noticeable difference between these two nuclei was in the proportion of prolonged responses. In the MGB, only 13% of cells had prolonged responses while in the PG, 58% of cells had prolonged responses. Transient, burst, and irregular responses were typical of cells in the MGB (33%, 28%, and 21% respectively) but made up a smaller percentage in PG (15%, 4%, and 8% respectively). On-off responses were only found in the PG (4%). The distribution of discharge patterns in MGB and PG are statistically significant (P = 0.1 × 10⁵, Chi-square test). In the MGB, the majority of transient and sustained responses were found in the dorsal subdivision, while the majority of burst, prolonged, and irregular responders were in the ventral division (Table 1). In both nuclei, the majority of responses were to the onset of the stimulus (64% for MGB and 82% for PG).
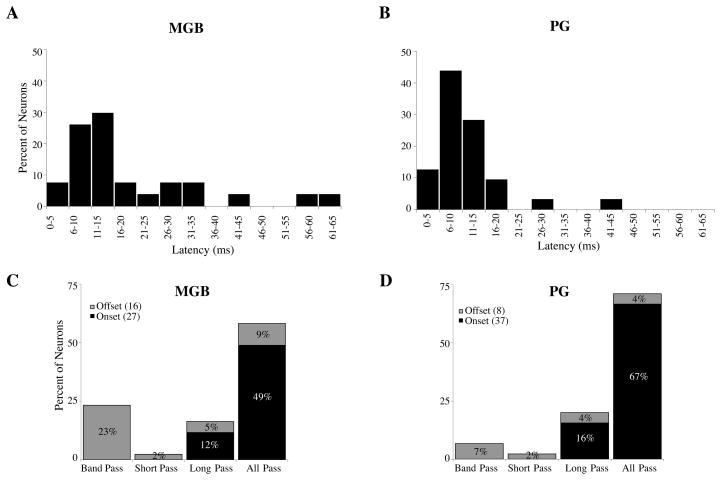
Mean first spike latencies for onset responders are shown in Figure 4A and B. Latencies were measured based on responses to the best stimulus 20 dB above threshold. Neurons in MGB had a wider range of latencies (5–65 ms) than those in the PG (3–42 ms) and on average were considerably longer. (MGB 19 ms ± 16 ms, PG 11 ms ± 7 ms, P= 0.029, t-test) Median first spike latency in MGB was 13 ms; in PG it was 10 ms. MGBv had the longest average first spike latencies of 24 ms, while MGBd had an average first spike latency of 15ms, and MGBm had a considerably shorter average first spike latency (6 ms, table 1).
Figure 4.
A and B) Distribution of first spike latencies in MGB (A) and PG (B) for all PT neurons with onset responses. Neurons in the MGB had a broader range of first spike latencies than those of the PG and on average, responded with longer latencies. C and D) Distribution of different forms of duration sensitivity in MGB (C) and PG (D) plotted according to response to stimulus onset (black) or offset (gray). The MGB contained a much larger proportion of duration-sensitive neurons than PG, with almost a quarter of all neurons having band pass characteristics. Of the duration-sensitive neurons in the PG, the majority were long-pass. In both nuclei, all short-pass and band-pass neurons responded at sound offset.
Both MGB and PG contain some duration sensitive neurons (MGB 41%, PG 28%, Figure 4C and D, P = 0.081, Chi-square test). MGB had a greater percentage of band pass neurons (61% of duration tuned neurons), while in the PG the majority of duration sensitive neurons were long pass (56%). The majority of duration sensitive neurons were located in the MGBv (table 1). In both nuclei, band pass and short pass neurons were all offset responders, while the majority of long pass and all pass neurons were onset responders. Two neurons in the PG had an on-off discharge pattern, where the onset response was transient and all pass, but the offset response was prolonged and short pass.
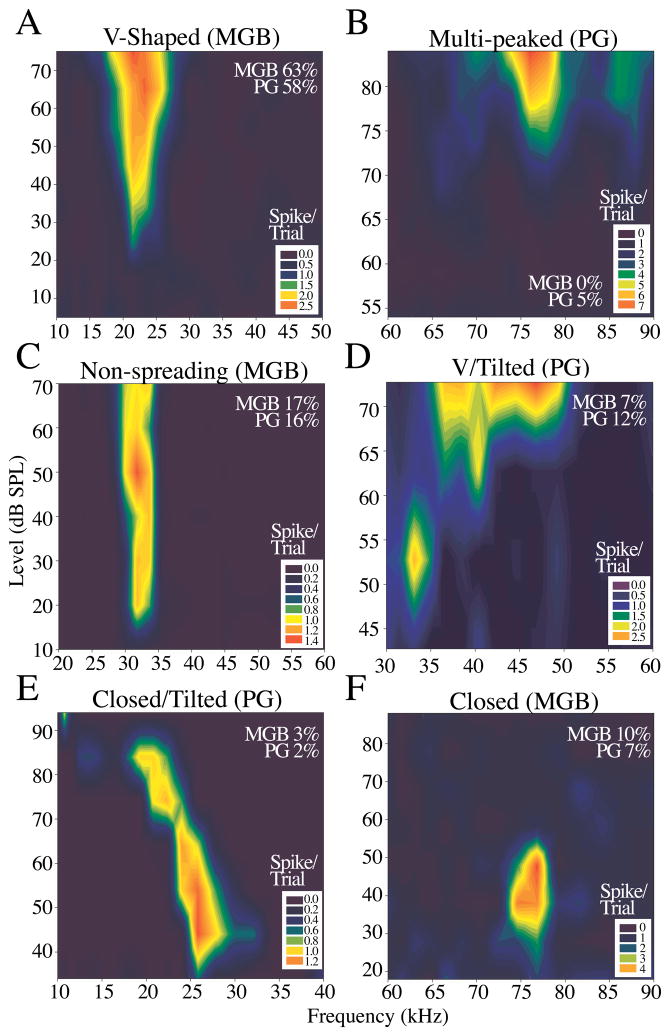
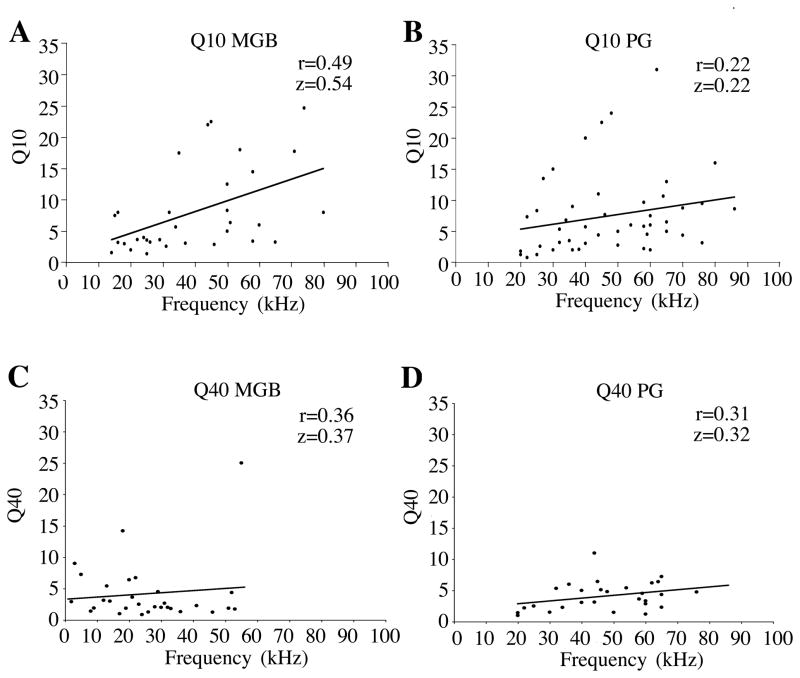
Frequency response areas (FRAs) were measured for all neurons in MGB and PG. For each neuron, FRAs were a measure of the range of frequencies encompassing the response area at different intensity levels at the neuron’s best duration (if it was sensitive) and it’s best sweep depth if it responded only to sweeps. Examples of the different types of FRAs recorded are shown in Figure 5. The majority of neurons in both MGB and PG had V-shaped tuning curves (frequency range that widens as intensity increases, 63% and 58% respectively; Figure 5A). Other examples include multi-peaked (two or more frequency response areas that merge at higher intensities, 5% in PG only, Figure 5B), non-spreading (frequency range that did not increase by more than 5 kHz over entire intensity range, MGB 17%, PG 16%, Figure 5C), V/tilted (frequency range for which both borders shifted in parallel at louder intensities, MGB 7%, PG 12%, 5D), closed/tilted (frequency range for which both borders shifted in parallel with a cessation of response at some upper intensity, MGB 3%, PG 2%, Figure 5E), and closed (response ceased at some upper threshold, MGB 10%, PG 7%, Figure 5F). We also examined Q values (Q10 = BF/Frequency range at 10 dB above threshold) to determine whether neurons in the MGB and PG were narrowly or broadly tuned. Scatter plots of Q10 and Q40 as a function of frequency for both MGB and PG are shown in Figure 6. At every frequency there was a wide range of Q values, and a tendency for Q to increase slightly with increasing frequency. Both distributions had positive correlations between Q values and BF, with both R and Fisher Z values that were higher for MGB than for PG, as illustrated in figure 6.
Figure 5.
Examples of frequency response areas (FRAs) and distributions for neurons in the MGB and PG. A) V-shaped. B) Multi-peaked. C) Non-spreading. D) V/tilted. E) Closed/tilted. F) Closed.
Figure 6.
Q10dB (A, B) and Q40dB (C, D) as a function of frequency, plotted for MGB (A, C) and PG (B, D). R values and Z-Fisher values suggest a positive correlation as Q value and frequency increase.
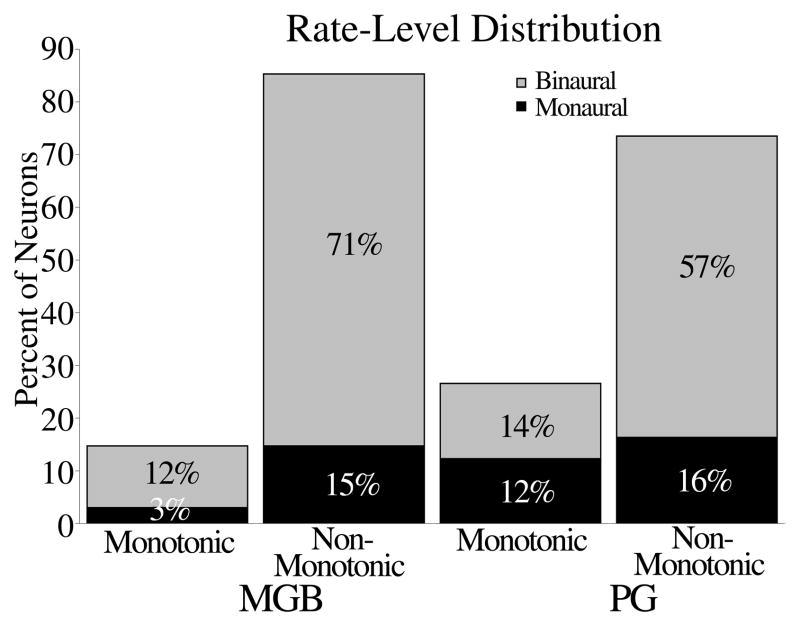
We examined rate level functions for neurons in both nuclei to determine whether neurons were selective for sound level. Figure 7 shows the distribution of monotonic and non-monotonic rate level functions in the MGB and PG, broken down by whether the neurons were monaural or binaural. In both MGB and PG, the majority of cells had non-monotonic rate level functions, indicating that they responded preferentially to low sound levels. Only 15% of neurons tested in the MGB were monotonic, compared to 26% in the PG. Of the four neurons tested in the MGBm, all were monotonic. MGBd and MGBv contained mostly non-monotonic neurons (82% and 88%, respectively, table 1). In both nuclei, binaural and monaural responses were not related to type of rate level function.
Figure 7.
Distribution of rate-level function types for monaural and binaural neurons in the MGB and PG.
3.4 Binaural properties
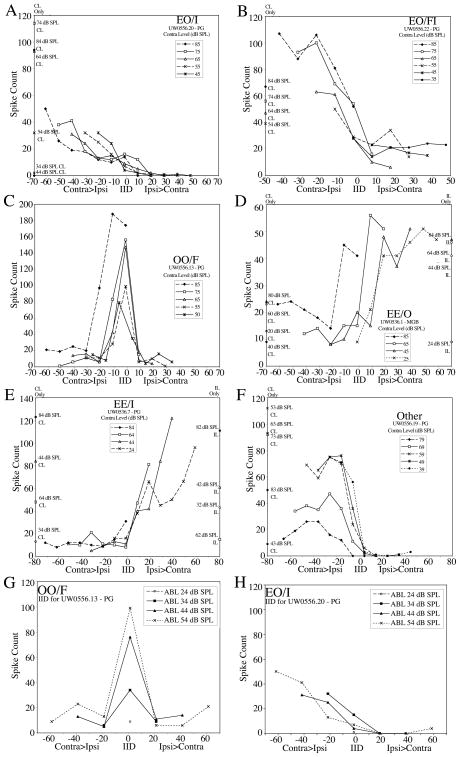
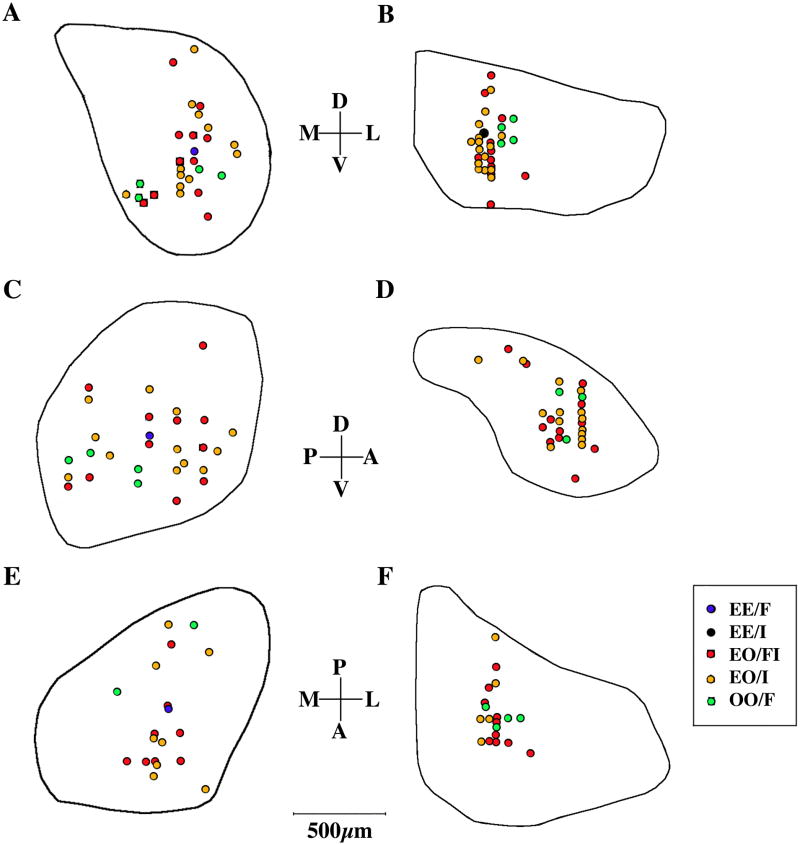
The classification terms used here loosely follow the definitions provided by Fuzessery et al., [31], and refer to the response to contralateral stimulation (E, excitatory; O, not excitatory), response to ipsilateral stimulation (E, O), followed by the type of binaural interaction (F, facilitation; I, inhibition). Figure 11 shows examples of interaural intensity difference (IID) functions for each binaural type in the PG and MGB. For neurons that had monaural responses, the number of spikes evoked by a sound presented to the excitatory ear was plotted as points along the corresponding ordinate. Each graph plots the number of spikes evoked by a given contralateral level, while varying ipsilateral level as indicated on the abscissa. The distribution of binaural neurons in MGB and PG is considered significant (P=0.029, chi-square test).
The majority of neurons in both nuclei responded to the contralateral ear alone, and were either inhibited by the addition of ipsilateral stimulation (EO/I, MGB 39%, PG 44%, Figure 8A), or facilitated at low ipsilateral levels but inhibited by higher levels (EO/FI, MGB 33%, PG 36%, Figure 8B, F). Neurons recorded in the MGBm were all monaural, while in the MGBd and MGBv the majority were binaural (table 1). The average BF of EO/I neurons in the MGB was 38 kHz ± 15kHz and in the PG it was 54 kHz ± 13 kHz. For EO/FI neurons, the average BF in the MGB was 43 kHz ± 18kHz and in the PG it was 58 kHz ± 16kHz. In comparison, the average BF for monaural (EO) neurons was 28.5 kHz ± 16kHz in the MGB and 37 kHz ± 16 kHz in the PG. In the MGB, 62% of EO/I neurons and 50% of EO/FI neurons responded to sound onset and the remainder to sound offset. In the PG, 87.5% of EO/I neurons and 75% of EO/FI neurons responded to the onset of the stimulus, and the remainder to the offset. The majority of EO/I neurons in both nuclei had inhibition that grew continuously larger as the ipsilateral sound became louder (e.g., Figure 8A). Of the EO/I neurons, 33% in the MGB and 7% in the PG were almost completely inhibited by any ipsilateral sound level presented.
Figure 8.
Examples of different classes of IID functions in the MGB and PG. A) EO/I; B) EO/FI; C) OO/F; D) EE; E) EE/I; F) example of an unusual EO/FI function. Points on left and right vertical axes indicate responses to monaural contralateral (left) and ipsilateral (right) stimuli. G and H) Plots of IID obtained at different average binaural level (ABL) for two neurons in the PG.
All EO/FI neurons in the MGB showed facilitation by ipsilateral sounds at all contralateral levels tested (e.g., Figure 8B). In the PG, 55% of EO/FI neurons showed facilitation at all contralateral levels tested, and 45% showed facilitation at only some contralateral levels.
A sizeable percentage of neurons in both nuclei failed to respond to either ear alone, but did respond to a combination of contralateral and ipsilateral stimulation (OO/F; Figure 8C). OO/F neurons made up 18% of MGB neurons and 17% of PG neurons. The average BF of OO/F neurons was 46 kHz ± 19kHz in the MGB and 34 kHz ±15kHz in the PG. In both the MGB and PG, the majority of these neurons (67%) were duration sensitive. In the MGB all but one had band pass characteristics, while in the PG, the duration sensitive OO/F neurons were either short-pass (50%) or long-pass (50%). The majority of binaural neurons in the PG (72%) had prolonged responses.
Three neurons in the MGB responded to either ear (EE, figure 8D). One neuron in PG responded to either contralateral or ipsilateral stimulation alone; combining both ears caused inhibition (EE/I, Figure 8E).
Figure 8G and H provide examples of two binaural cells (from Figure 8C and A) showing spike counts at each average binaural level (ABL) as a function of IID. In these units, as in others that were examined, plots based on ABL were almost identical to plots for each contralateral sound level indicating that binaural interactions were largely determined by IID rather than overall sound level.
Binaural neurons were plotted onto collapsed sections of MGB and PG to determine whether there was any topographic organization of binaural types. In the MGB (Figure 9A, C, E), neurons did not appear to be organized by subdivision. OO/F neurons were located posteriorly and ventrally (Figure 9C). In the PG (Figure 9B, D, F), binaural cells were only found in the central portion of the nucleus. OO/F cells were only found anteriorly in the PG. In both cases, EO/I and EO/FI neurons were distributed evenly throughout the area in which binaural cells were found.
Figure 9.
Binaural topography in MGB and PG. Locations of binaural cells in the MGB (A, C, E) and PG (B, D, F) collapsed onto representative coronal (A, B), parasagittal (C, D), and horizontal (E, F) sections.
4. Discussion
4.1 General response properties
Both the MGB and PG receive direct input from the IC. The data presented here suggest that in some respects, response properties in these regions reflect different forms of processing. Perhaps the most notable difference between MGB and PG was the large proportion of neurons in PG with prolonged responses that lasted considerably longer than stimulus duration. This response type has not previously been described in PG. The functional role of long-lasting responses is not entirely clear. However, there is no doubt that they provide a persistent trace of a sound for some time after it is over, a trace that outlasts the actual duration of the sound. If the neuron with the persistent response is inhibitory, it could prevent further activity in its target for some time following a sound, thereby regulating the rate at which information is processed, and/or providing a window during which processing can occur without interference from subsequent sounds. If excitatory, it could provide a “canvas” on which subsequent sounds could leave an imprint, contributing to ongoing temporal integration.
Although the ranges of latencies in MGB and PG were largely overlapping, a larger proportion of neurons in PG had latencies in the 6–10 ms range than in MGB. As a result, the average first-spike latency for neurons in PG was 8 ms less than in MGB. The latency range that we found is similar to that previously reported in the PG [23] and cerebellum [22] of Eptesicus. In order for any type of temporal integration to occur, there needs to be some sort of coincidence between inputs evoked by auditory events that occur at different times. The fact that the range of latencies in the inferior colliculus, MGB, auditory cortex, and PG largely overlap (e.g., [34]; [35]) emphasizes this point and suggests that all of these structures may participate in feedback loops. However, the different response properties and latency ranges in MGB and PG suggest that integration of inputs evoked by different sounds may be primarily accomplished through delay lines in MGB, but through coincidence of the onset component of one response with the late part of a persistent response in PG, not necessarily requiring delay lines. Thus, the mechanisms for integration and the time frame over which integration occurs are likely to be different in MGB and PG. This is consistent with the idea that PG is concerned with the ongoing mechanics of echolocation and sound-guided navigation, which would require rapid and continuous motor adjustments, possibly operating through a continuous sliding integrator mechanism. It is also consistent with the idea that MGB is concerned with pattern analysis, which might require integration of information throughdelay lines.
In Eptesicus, the MGB appears to have a convoluted tonotopic organization. Neurons with higher frequencies tended to be found in the MGBv, and neurons with low frequencies more dorsal and anterior in both MGBv and MGBd. Neurons with the highest frequencies were found ventromedially within the MGBv, similar to Pteronotus, however, a few low frequency neurons were also found in this area. No clear tonotopic organization was evident in the mediolateral dimension within any subdivision. This arrangement is somewhat different from that in the MGB of Pteronotus [10] where low frequencies were found in the most ventral and posterior portion of the MGBv, and high frequencies medially and anteriorly. In Pteronotus, the MGBd contained only low frequencies, which is similar to what we found in Eptesicus. The MGB of Eptesicus contained neurons that responded to frequencies throughout the entire audible range, including low frequencies that are not contained in the echolocation calls but are components of communication sounds.
In the PG, we found that high frequency neurons were located medially and low frequency neurons laterally. Kamada et al. [23] reported an absence of tonotopy in the dorsoventral axes of the PG of Eptesicus, with a range of BFs nearly identical to the one that we found. Schuller et al. [16] suggest that topographic organization in the PG of the horseshoe bat may emphasize elements such as sound location at the expense of tonotopy. They also found that in Rhinolophus, there was a great overrepresentation of higher frequencies within the FM1 and FM2 range of the echolocation call. In Eptesicus, we found that the mean best frequency in the PG was 46 kHz, which was 9 kHz higher than the MGB, and no neurons with BFs below 20 kHz were found. This suggests that the PG in Eptesicus is concerned only with processing sounds in the echolocation range, with special emphasis on the higher harmonics, similar to the PG of Rhinolophus.
The majority of cells in both nuclei responded to pure tones, but those in MGB showed a larger number of different types of selectivity for specific sound patterns, including SFM stimuli. This finding is consistent with the idea that the thalamocortical pathway integrates information over time for spectrotemporal feature detection. For example, the neurons that responded only to noise may be specialized to signal the presence of broadband components of sounds made by insects, or broadband components of bats’ communication calls. Our finding that the majority of PG neurons responded to pure tones indicates that neurons in the ponto-cerebellar pathway respond to any sound within their frequency response area rather than specific spectrotemporal patterns.
The PG contained considerably more neurons that responded to the onset of the stimulus than to its offset, consistent with the finding of few short-pass or band pass duration selective neurons. The majority of neurons in the PG were not sensitive to duration, but those that were, were mainly long pass. The majority of duration sensitive neurons in MGB were band pass duration tuned. All of these band pass neurons responded to the offset of the stimulus. This is similar to the offset responses that have been reported in band pass duration tuned neurons in the IC [29,32,33], suggesting that duration-tuning in the MGB is created through mechanisms similar to those shown to operate in the IC, or that MGB neurons simply inherit their response properties from input neurons in the IC.
The finding that the majority of neurons in both the MGB and PG had non-monotonic rate-level functions is consistent with previous reports (PG: [23]) and suggests that neurons in both of these areas are sensitive to specific sound levels or sound level changes. It is possible that some of these neurons are responsive to low-level sounds, including echoes, but not to the bat’s high intensity outgoing vocalization.
4.2 Binaural properties and sound localization
Our data showed that the majority of binaural neurons in the MGB and PG responded to the contralateral ear alone. Most of these were inhibited by sound at the ipsilateral ear, although some showed facilitation by ipsilateral sounds at low intensities and inhibition by ipsilateral sounds at high intensities.
Given the fact that most PG neurons had relatively high BFs, it was surprising that OO/F neurons in the PG had lower BFs than OO/F neurons in the MGB. We could speculate that the OO/F neurons in the PG may be specialized to respond to low frequency sounds from the center of the auditory field, perhaps to distinguish the lower frequency buzzing associated with the end of the pursuit phase of the echolocation call sequence, a time when echoes would originate from an object near the midline. The binaural neurons that are focused on sounds on either side of auditory space (EO/I, EO/FI), may be responding to higher frequency sounds during the search and pursuit phases, when the bat is presumably scanning its peripheral environment for prey or pursuing an erratically flying insect.
The range of IID experienced by Eptesicus and other echolocating bats is, in general steepest near the midline, and highly dependent on sound frequency. For Eptesicus fuscus, the range of IIDs measured in a preserved head was found to be about 35 dB at 45 kHz [36], but increases at higher frequencies. The pinna of bats is highly directional with the point of maximal sound pressure in the frontal ipsilateral field [37], and would be expected to enhance IIDs for sounds located near the midline. Under natural conditions, the echolocation signal is emitted in a directional beam in which sound is restricted to a cone with a half-amplitude angle of 25 degrees at 40 kHz and 14 degrees at 70 kHz [38], probably corresponding the range over which IID functions are steepest for these frequencies. It has been shown that insectivorous bats control the beam width in a dynamic fashion when actively echolocating, broadening the maximum half-width from about 40 degrees to 90 degrees by lowering the frequency range of their echolocation signals [39]. However, bats not only echolocate, they listen passively to prey-generated sounds and communication vocalizations of conspecifics, which may come from any direction at any frequency. Thus, it is difficult to determine a single relevant range of IIDs for the bat. It is possible that some of the IIDs used in our experiments were outside the physiological and/or behaviorally relevant range, but they nevertheless provide useful information about the binaural interaction of excitation and inhibition in the neurons tested.
A greater proportion of binaural neurons in PG responded to the onset of the stimulus than in the MGB, perhaps reflecting the general population trend of all cells, both monaural and binaural. The majority of binaural cells in the PG showed systematically increasing inhibition as the ipsilateral sound increased relative to a fixed contralateral level, whereas the MGB contained more binaural neurons that were completely inhibited by any ipsilateral stimulation. This suggests that EO/I and EO/FI neurons in PG are more broadly tuned to the bat’s central auditory space, whereas those in MGB are more sensitive to lateralized stimuli. The findings in the PG are consistent with those of Kamada et al 1992 [23], who reported that PG neurons are most sensitive to sounds originating in the central portion of auditory space. However, in our study binaural neurons specifically tuned to the bat’s frontal auditory space (OO/F) were represented almost equally in the MGB and PG. The majority of OO/F neurons were duration sensitive. In the MGB they were band-pass tuned and in the PG they were long-pass or short-pass. OO/F neurons appear to be topographically organized; in the MGB they were located posteroventrally, while in the PG they were confined to the anterior part.
4.3 Comparison to other species
Previous studies examining processing in MGB and PG have been done in bat species that use different echolocation strategies than Eptesicus; Pteronotus (MGB, [6.7,10] and Rhinolophus (PG, [16]). Both of these bats echolocate by emitting constant frequency pulses followed by FM sweeps, whereas Eptesicus emits FM sweeps of varying durations dependent on the phase of the hunt. In Pteronotus, the MGB devotes much of its organization to combination-sensitive neurons that span the range of social and sonar calls [6,7,10]. While this study did not examine combination sensitivity of neurons in Eptesicus MGB, we can surmise that tonotopy is somewhat similar in the two species. In addition we can generalize that the MGB of both bat species processes and transmits complex information from both communication and echolocation calls. In comparison, Rhinolophus PG was found to contain a bimodal distribution of neurons responsive to frequencies found only in the echolocation range of the FM1 and FM2 portion of their call. In Eptesicus, the PG also appears limited to neurons responding to frequencies at or above 20 kHz, with the majority responding to frequencies in the range of the second harmonic around 60 kHz. One difference between the PG of the two bat species is the proportion of binaural neurons. Rhinolophus contained mostly EE neurons while Eptesicus contained more EI neurons. This difference might be accounted for by the different movement patterns of their pinnae, the different structure of their echolocation calls, or their different foraging strategies.
4.4 Conclusions
In summary, we conclude that MGB not only relays information contained from both communication and echolocation calls, but also integrates information over a longer range of time, resulting in feature detection. The PG focuses on echolocation calls and provides a short-latency but long lasting trace of auditory events.
Research Highlights.
Eptesicus MGB contains a complete representation of frequencies spanning the entire range of social and echolocation frequencies.
PG appears to be specialized for high frequency processing (no responses to <20 kHz). The mean best frequency of PG neurons (46 kHz) is higher than that of MGB neurons (37 kHz).
MGB neurons respond to more types of stimuli, including complex stimuli, than PG neurons, and have longer average first spike latencies than neurons in PG.
A large proportion of neurons in PG have prolonged responses, which have not previously been described in PG.
Acknowledgments
Research supported by NIH grant DC-00287 and NSF grant IOS-0719295.
Abbreviations
- μA
micro-ampere
- μPa
micro pascal
- ABL
average binaural level
- AC
auditory cortex
- BF
best frequency
- dB
decibel
- E
excitatory
- F
facilitation
- FG
fluoro-gold
- FM
frequency modulation
- FR
fluoro-ruby
- FRAs
frequency response area
- I
inhibition
- IC
inferior colliculus
- KHz
kilohertz
- MGB
medial geniculate body (d, v, m; dorsal, ventral, medial subdivisions)
- ms
millisecond
- O
not excitatory
- PBS
phosphate buffered saline
- PG
pontine gray
- SFM
sinusoidally frequency-modulated tone
- SG
suprageniculate nucleus
- SPL
sound pressure level
Footnotes
Publisher's Disclaimer: This is a PDF file of an unedited manuscript that has been accepted for publication. As a service to our customers we are providing this early version of the manuscript. The manuscript will undergo copyediting, typesetting, and review of the resulting proof before it is published in its final citable form. Please note that during the production process errors may be discovered which could affect the content, and all legal disclaimers that apply to the journal pertain.
References
- 1.Bergan JF, Knudsen EI. Visual modulation of auditory responses in the owl inferior colliculus. J Neurophysiol. 2009;101:2924–2933. doi: 10.1152/jn.91313.2008. [DOI] [PMC free article] [PubMed] [Google Scholar]
- 2.Malmierca MS, Cristaudo S, Perez-Gonzalez D, Covey E. Stimulus-specific adaptation in the inferior colliculus of the anesthetized rat. J Neurosci. 2009;29:5483–5493. doi: 10.1523/JNEUROSCI.4153-08.2009. [DOI] [PMC free article] [PubMed] [Google Scholar]
- 3.Metzger RR, Greene NT, Porter KK, Groh JM. Effects of reward and behavioral context on neural activity in the primate inferior colliculus. J Neurosci. 2006;26:7468–7476. doi: 10.1523/JNEUROSCI.5401-05.2006. [DOI] [PMC free article] [PubMed] [Google Scholar]
- 4.Perez-Gonzalez D, Malmierca MS, Covey E. Novelty detector neurons in the mammalian auditory midbrain. Eur J Neurosci. 2005;22:2879–2885. doi: 10.1111/j.1460-9568.2005.04472.x. [DOI] [PubMed] [Google Scholar]
- 5.Llano DA, Feng AS. Response characteristics of neurons in the medial geniculate body of the little brown bat to simple and temporally-patterned sounds. J Comp Physiol [A] 1999;184:371–385. doi: 10.1007/s003590050336. [DOI] [PubMed] [Google Scholar]
- 6.Olsen JF, Suga N. Combination-sensitive neurons in the medial geniculate body of the mustached bat: encoding of relative velocity information. J Neurophysiol. 1991;65:1254–1274. doi: 10.1152/jn.1991.65.6.1254. [DOI] [PubMed] [Google Scholar]
- 7.Olsen JF, Suga N. Combination-sensitive neurons in the medial geniculate body of the mustached bat: encoding of target range information. J Neurophysiol. 1991;65:1275–1296. doi: 10.1152/jn.1991.65.6.1275. [DOI] [PubMed] [Google Scholar]
- 8.Razak KA, Shen W, Zumsteg T, Fuzessery ZM. Parallel thalamocortical pathways for echolocation and passive sound localization in a gleaning bat, Antrozous pallidus. J Comp Neurol. 2007;500:322–338. doi: 10.1002/cne.21178. [DOI] [PubMed] [Google Scholar]
- 9.Wenstrup JJ, Larue DT, Winer JA. Projections of physiologically defined subdivisions of the inferior colliculus in the mustached bat: targets in the medial geniculate body and extrathalamic nuclei. J Comp Neurol. 1994;346:207–236. doi: 10.1002/cne.903460204. [DOI] [PubMed] [Google Scholar]
- 10.Wenstrup JJ. Frequency organization and responses to complex sounds in the medial geniculate body of the mustached bat. J Neurophysiol. 1999;82:2528–2544. doi: 10.1152/jn.1999.82.5.2528. [DOI] [PubMed] [Google Scholar]
- 11.Winer JA, Wenstrup JJ. The neurons of the medial geniculate body in the mustached bat (Pteronotus parnellii) J Comp Neurol. 1994;346:183–206. doi: 10.1002/cne.903460203. [DOI] [PubMed] [Google Scholar]
- 12.Winer JA, Miller LM, Lee CC, Schreiner CE. Auditory thalamocortical transformation: structure and function. Trends Neurosci. 2005;28:255–263. doi: 10.1016/j.tins.2005.03.009. [DOI] [PubMed] [Google Scholar]
- 13.Shen JX, Chen QC, Jen PH. Binaural and frequency representation in the primary auditory cortex of the big brown bat, Eptesicus fuscus. J Comp Physiol A. 1997;181:591–597. doi: 10.1007/s003590050142. [DOI] [PubMed] [Google Scholar]
- 14.Frisina RD, O’Neill WE, Zettel ML. Functional organization of mustached bat inferior colliculus: II. Connections of the FM2 region. J Comp Neurol. 1989;284:85–107. doi: 10.1002/cne.902840107. [DOI] [PubMed] [Google Scholar]
- 15.Schweizer H. The connections of the inferior colliculus and the organization of the brainstem auditory system in the greater horseshoe bat (Rhinolophus ferrumequinum) J Comp Neurol. 1981;201:25–49. doi: 10.1002/cne.902010104. [DOI] [PubMed] [Google Scholar]
- 16.Schuller G, Covey E, Casseday JH. Auditory Pontine Grey: Connections and Response Properties in the Horseshoe Bat. Eur J Neurosci. 1991;3:648–662. doi: 10.1111/j.1460-9568.1991.tb00851.x. [DOI] [PubMed] [Google Scholar]
- 17.Thompson AM. Inferior colliculus projections to pontine nuclei in guinea pig. Brain Res. 2006;1100:104–109. doi: 10.1016/j.brainres.2006.05.014. [DOI] [PubMed] [Google Scholar]
- 18.Andersen RA, Roth GL, Aitkin LM, Merzenich MM. The efferent projections of the central nucleus and the pericentral nucleus of the inferior colliculus in the cat. J Comp Neurol. 1980;194:649–662. doi: 10.1002/cne.901940311. [DOI] [PubMed] [Google Scholar]
- 19.Hashikawa T. The inferior colliculopontine neurons of the cat in relation to other collicular descending neurons. J Comp Neurol. 1983;219:241–249. doi: 10.1002/cne.902190209. [DOI] [PubMed] [Google Scholar]
- 20.Aas JE. Subcortical projections to the pontine nuclei in the cat. J Comp Neurol. 1989;282:331–354. doi: 10.1002/cne.902820303. [DOI] [PubMed] [Google Scholar]
- 21.Mihailoff GA, Kosinski RJ, Azizi SA, Border BG. Survey of noncortical afferent projections to the basilar pontine nuclei: a retrograde tracing study in the rat. J Comp Neurol. 1989;282:617–643. doi: 10.1002/cne.902820411. [DOI] [PubMed] [Google Scholar]
- 22.Kamada T, Jen PH. Auditory response properties and directional sensitivity of cerebellar neurons of the echolocating bat, Eptesicus fuscus. Brain Res. 1990;528:123–129. doi: 10.1016/0006-8993(90)90203-n. [DOI] [PubMed] [Google Scholar]
- 23.Kamada T, Wu M, Jen PH. Auditory response properties and spatial response areas of single neurons in the pontine nuclei of the big brown bat, Eptesicus fuscus. Brain Res. 1992;575:187–198. doi: 10.1016/0006-8993(92)90079-o. [DOI] [PubMed] [Google Scholar]
- 24.Wu MI, Jen PH. Responses of pontine neurons of the big brown bat, Eptesicus fuscus, to temporally patterned sound pulses. Hear Res. 1995;85:155–168. doi: 10.1016/0378-5955(95)00042-3. [DOI] [PubMed] [Google Scholar]
- 25.Miller KE, Casseday JH, Covey E. Relation between intrinsic connections and isofrequency contours in the inferior colliculus of the big brown bat, Eptesicus fuscus. Neuroscience. 2005;136:895–905. doi: 10.1016/j.neuroscience.2005.04.032. [DOI] [PubMed] [Google Scholar]
- 26.Faure PA, Fremouw T, Casseday JH, Covey E. Temporal masking reveals properties of sound-evoked inhibition in duration-tuned neurons of the inferior colliculus. J Neurosci. 2003;23:3052–3065. doi: 10.1523/JNEUROSCI.23-07-03052.2003. [DOI] [PMC free article] [PubMed] [Google Scholar]
- 27.Frederiksen E. Condenser microphones used as sound sources. Bruel and Kjaer Technical Review. 1977:3–23. [Google Scholar]
- 28.Stapells DR, Picton TW. Technical aspects of brainstem evoked potential audiometry using tones. Ear Hear. 1981;2:20–29. doi: 10.1097/00003446-198101000-00006. [DOI] [PubMed] [Google Scholar]
- 29.Ehrlich D, Casseday JH, Covey E. Neural tuning to sound duration in the inferior colliculus of the big brown bat, Eptesicus fuscus. J Neurophysiol. 1997;77:2360–2372. doi: 10.1152/jn.1997.77.5.2360. [DOI] [PubMed] [Google Scholar]
- 30.Nakamoto KT, Zhang J, Kitzes LM. Response patterns along an isofrequency contour in cat primary auditory cortex (AI) to stimuli varying in average and interaural levels. J Neurophysiol. 2004;91:118–135. doi: 10.1152/jn.00171.2003. [DOI] [PubMed] [Google Scholar]
- 31.Fuzessery ZM, Wenstrup JJ, Pollak GD. Determinants of horizontal sound location selectivity of binaurally excited neurons in an isofrequency region of the mustache bat inferior colliculus. J Neurophysiol. 1990;63:1128–1147. doi: 10.1152/jn.1990.63.5.1128. [DOI] [PubMed] [Google Scholar]
- 32.Casseday JH, Ehrlich D, Covey E. Neural tuning for sound duration: role of inhibitory mechanisms in the inferior colliculus. Science. 1994;264:847–850. doi: 10.1126/science.8171341. [DOI] [PubMed] [Google Scholar]
- 33.Casseday JH, Ehrlich D, Covey E. Neural measurement of sound duration: control by excitatory-inhibitory interactions in the inferior colliculus. J Neurophysiol. 2000;84:1475–1487. doi: 10.1152/jn.2000.84.3.1475. [DOI] [PubMed] [Google Scholar]
- 34.Covey E, Casseday JH. Timing in the auditory system of the bat. In: Hoffman JF, De Weer P, editors. Ann Rev Physiol. Palo Alto, CA: 1999. pp. 457–476. Annual Reviews. [DOI] [PubMed] [Google Scholar]
- 35.Covey E. Brainstem mechanisms for analyzing termporal patterns of echolocations sounds: A model for understanding early stages of speech processing? Speech Communication. 2003;41:151–163. [Google Scholar]
- 36.Obrist MK, Fenton MB, Eger JL, Schlegel PA. What ears do for bats: A comparative study of pinna sound pressure transformation in chiroptera. J Exp Biol. 1993;189:119–152. doi: 10.1242/jeb.180.1.119. [DOI] [PubMed] [Google Scholar]
- 37.Jen PH, Chen DM. Directionality of sound pressure transformation at the pinna of echolocating bats. Hear Res. 1988;34(2):101–17. doi: 10.1016/0378-5955(88)90098-6. [DOI] [PubMed] [Google Scholar]
- 38.Surlykke A, Boel Pedersen S, Jakobsen L. Echolocating bats emit a highly directions sonar sound beam in the field. Proc Biol Sci. 2009;276(1658):853–60. doi: 10.1098/rspb.2008.1505. [DOI] [PMC free article] [PubMed] [Google Scholar]
- 39.Jakobsen L, Surlykke A. Vespertilionid bats control the width of their biosonar sound beam dynamically during prey pursuit. Proc Nat Aca Science. 2010;107(31):13930–35. doi: 10.1073/pnas.1006630107. [DOI] [PMC free article] [PubMed] [Google Scholar]


