Abstract
The ameliorating effects of Mango (Mangifera indica L.) flesh and peel samples on plasma ethanol level were investigated using a mouse model. Mango fruit samples remarkably decreased mouse plasma ethanol levels and increased the activities of alcohol dehydrogenase and acetaldehyde dehydrogenase. The 1H-NMR-based metabolomic technique was employed to investigate the differences in metabolic profiles of mango fruits, and mouse plasma samples fed with mango fruit samples. The partial least squares-discriminate analysis of 1H-NMR spectral data of mouse plasma demonstrated that there were clear separations among plasma samples from mice fed with buffer, mango flesh and peel. A loading plot demonstrated that metabolites from mango fruit, such as fructose and aspartate, might stimulate alcohol degradation enzymes. This study suggests that mango flesh and peel could be used as resources for functional foods intended to decrease plasma ethanol level after ethanol uptake.
Keywords: mango, Mangifera indica, plasma ethanol level, metabolomics, 1H-NMR
Introduction
Alcohol (ethanol) metabolism in the liver has been known to be mostly performed by the NAD-linked enzymes-alcohol dehydrogenase (ADH) and acetaldehyde dehydrogenase (ALDH).(1) These enzymes produce acetaldehyde and acetate, respectively. The acetate is transformed into acetyl-CoA and goes through the tricarboxylic acid (TCA) cycle to produce energy or to synthesize cholesterol or fatty acids. Acetaldehyde, one of the major breakdown products of alcohol, is responsible for hangover effects, which include headache, diarrhea, anorexia, nausea, vomiting, and rigor after drinking. Also, the objective symptoms of excess drinking include a decline in perception and movement ability and changes in blood and hormone levels.(2) For relieving symptoms of hangover, materials that inhibit alcohol absorption in the early stage or that promote the activity of alcohol-degrading enzymes, ADH and ALDH are suggested.(3) Previous reports have demonstrated that various foods,(4,5) plants,(6,7) traditional Asian medicinal preparations,(8,9) sugars,(10,11) amino acids,(12–14) inorganic compounds,(15,16) and drug(17) affect alcohol metabolism and alleviate alcohol-induced hangover.
Mango (Mangifera indica L.), from the family Anacardiaceae, originated over 4,000 years ago in India and Myanmar, and its cultivation has spread to Malaysia, eastern Asia, and eastern Africa.(18) Previous studies of mango fruit have shown that it contains various classes of polyphenols, terpenoids, carotenoids, and ascorbic acid, demonstrating various health-promoting properties, mainly due to the antioxidant activities.(19,20) Moreover, mango fruit has exhibited various other beneficial bioactivities including antiproliferative effects,(21) prothyroid effects,(22) and hepatoprotective effects.(23,24) However, the ethanol-decreasing activity of mango flesh and peel in mouse plasma has not yet been reported. In mango fruit, the fleshy parts have been used in various food resources in particular—but the peel of the mango has been generally discarded.
The main hypothesis of this study was that mango flesh and peel might have ethanol-decreasing activity in mouse plasma, and the bioactivity could be assessed by 1H-NMR based metabolic profiling. In the current study, the ethanol-decreasing activities of mango flesh and peel was assessed in mouse model. The ethanol-treated subjects were administered with mango flesh and peel, and their plasma was subjected to metabolic profiling by 1H-NMR based metabolomic techniques. The aim of the present study was to investigate the effects of mango flesh and peel on plasma ethanol levels and the activities of alcohol-degrading enzymes. Further, the ethanol-decreasing activities of mango flesh and peel were assessed using a 1H-nuclear magnetic resonance spectrometry (NMR)-based metabolic profiling approach.
Materials and Methods
Plant materials
Mango (M. indica L.) fruits were acquired from a local farm in Pyoseon-myeon located in Jeju Province (latitude 33° 19' N, longitude 126° 49' E, altitude 35 m), Republic of Korea. The ten mature mango fruits were pooled to reduce the variability between fruit samples. Mature mango fruit flesh (MF) and mature mango fruit peel (MP) were obtained by manually removing the peels and the edible flesh from the seed kernels. A kitchen peeler was utilized to separate the flesh from the peel. After lyophilization for two days, the samples were stored at −70°C before analysis. For the animal experiments, 10 g each of the dried fruit powder was extracted with one liter of 80% ethanol for three days at room temperature. The extracted material was filtered, and the residue was dried in a rotary vacuum evaporator. The concentrated solid was freeze-dried.
Chemicals and reagents
First-grade methanol, ethanol, D2O [99.9%, containing 0.05% 3-(trimethylsilyl)-propionic-2,2,3,3-d4 acid sodium salt (TSP)], phosphate buffered saline (PBS), tris-HCl, 2-mercaptoethanol, sodium phosphate, 4-methylpyrazole hydrochloride, and acetaldehyde purchased from Sigma (St. Louis, MO). An alcohol kit was obtained from R-Biopharm (Darmstadt, Germany). NaOD was purchased from Cortec (Paris, France). Potassium dihydrogen phosphate and sucrose were purchased from Daejung Chemicals and Metals Co., Ltd. (Gyonggi-do, Republic of Korea).
Animal handling procedure and sample preparation
Twenty male eight-week-old International Cancer Research (ICR) mice were individually housed in plastic cages. All animals were maintained on a 12-h light/12-h dark cycle, 22–23°C and 55 ± 15% humidity with food and water available ad libitum. The day before the experiment, the water supplies were suspended, and on the morning of the experiment, food supplies were also suspended. Mice were randomly divided into four groups. The experimental groups were fed with either MF (MF group) or MP (MP group). In the control group (PBS group), PBS was administered instead of the sample. The sample used in the experimental group was suspended in PBS to make 500 µg per 1 g of mouse weight. The total volume was adjusted to 150 µl and was administered orally. One hundred fifty microliters of PBS was administered in the same manner. An hour after feeding, 150 µl of 50% ethanol was administered orally. An hour after the ethanol was given, blood was drawn from the heart, and plasma was obtained by centrifuging the blood at 1,000 × g for 30 min at 4°C. The animal care, handling, and experimental procedures were performed in accordance with a protocol approved by the Animal Care and Use Committee of Cheju National University, Republic of Korea.
Determination of plasma ethanol concentration, hepatic ADH and ALDH activity
The plasma ethanol level was determined using an alcohol assay kit (R-Biopharm, Germany) according to the manufacturer’s instructions. To prepare sources of ADH and ALDH, a piece of liver was homogenized in a buffer solution containing 2 mM mercaptoethanol, 10 mM sodium phosphate and 250 mM sucrose (pH 7.4). The homogenate was centrifuged at 600 × g for 10 min followed by further centrifugation of the supernatant at 10,000 × g for 10 min. The supernatant was ultracentrifuged at 105,000 × g for 1 h to obtain the cytosolic fraction for the ADH assay. The precipitate obtained after centrifugation at 10,000 × g was used for the cytosolic ALDH assay. The ADH and ALDH activities were determined using the methods described by Blandino, Caro, and Cantero(25) and Bostian and Betts,(26) respectively, with minor modifications. Briefly, the reaction mixture used for the ADH assay consisted of 0.1 M Tris-HCl (pH 8.8), 5 mM NAD+, 100 µl ethanol, and 100 µl ADH fraction. The mixture was incubated at 30°C for 5 min, and the absorbance at 340 nm was measured to verify the NADH production rate. The ALDH activity was measured in 60 mM sodium phyrophosphate buffer (pH 8.8), 4 mM NAD+, 4-methylpyrazole, and acetaldehyde in a final concentration of 0.1 M, and then 100 µl cytosolic ALDH fraction was added. After incubation for 5 min at 30°C, the production rate of NADH from NAD+ was determined at 340 nm.
Sample preparation for 1H-NMR
For extraction of samples, 5 ml of an 80% ethanol–water mixture was added to 100 mg of powdered mango samples in a centrifuge tube, vortexed for 1 min, and sonicated for 1 min. The materials were then centrifuged at 500 × g for 20 min. The supernatant was transferred to a 50-ml round-bottomed flask. The extraction procedure was performed twice followed by concentration with a vacuum rotary evaporator (Eyela, Tokyo, Japan) under reduced pressure. To act as a buffering agent, 1.232 g of KH2PO4 was added to 100 ml of D2O (containing 0.05% 3-(trimethylsilyl)-propionic-2,2,3,3-d4 acid, sodium salt; TSP was an internal standard for D2O). The pH of the D2O used for NMR measurements was adjusted to 6.0 using 520 µl of 1 N NaOD. One mililiter of prepared D2O was added to the extracts in the flask. The dissolved solutions were then filtered and pipetted into a 5-mm NMR tube (Norell, NJ).
For plasma analysis, the frozen plasma samples were thawed in a water bath at 40°C, and 0.3 ml of each plasma sample was pipetted into a 5-mm NMR tube with 0.2 ml of D2O (containing 0.05% TSP, as an internal standard for D2O) and vortexed for several seconds to ensure thorough mixing.
NMR spectroscopy
The 1H-NMR spectra of mango extracts were acquired at 600.13-MHz and a temperature of 298 K on a Bruker Avance 600 spectrometer (Bruker Analytische GmbH, Rheinstetten, Germany) using broad band observe (BBO) probe. A zgcppr pulse sequence was applied to suppress the residual water signal. A total of 128 transients were collected into 64 K data points with a relaxation delay of 1 sec. A spectral width of 11363.6 Hz and an acquisition time per scan of 3.04 sec were used. Prior to Fourier transformation (FT), an exponential line broadening function of 0.3-Hz was applied to the free induction decay (FID).
The 1H-NMR spectra of the plasma samples were measured using an NMR spectrometer (Avance 600 FT-NMR, Bruker Analytische GmbH, Rheinstetten, Germany) operating at a proton NMR frequency of 600.13 MHz and a temperature of 298 K, using a triple-axis inverse (TXI) cryoprobe. The spectra were recorded using zgpr as a presaturation pulse sequence for water suppression. For each sample, 128 scans were recorded with the following parameters: 0.155 Hz/point, pulse width of 4.0 µsec (30°), and a relaxation delay of 2.0 sec.
Statistical analysis
All NMR spectra were automatically reduced to ASCII files using AMIX (version 3.7, Bruker Biospin, Rheinstetten, Germany). In the mango spectra, the spectral 1H-NMR region from δ = 0.52 to δ = 10.00 was segmented into regions with widths of 0.04 ppm, producing giving 237 integrated regions in each NMR spectrum. The region from 4.6 to 4.9 ppm was excluded to remove variations in the suppression of the water resonance, and each spectral intensity data set was normalized to the total sum of the spectral regions. In the plasma spectra, the spectral region δ = 4.8–5.0 was excluded from the analysis due to the presence of a signal from residual water in the aqueous extracts. The spectral regions from δ = 1.16 to δ = 1.24 and from δ = 3.64 to δ = 3.72 were excluded, because of the signals of the ethanol administered to the mice.
The resultant data sets were converted to the Microsoft Excel format and then imported into SIMCA-P software (version 12.0, Umetrics, Umeå, Sweden) for multivariate analysis. 1H-NMR signal assignments were performed by comparing their chemical shifts and splitting patterns to those in the Chenomx NMR suite (version 5.1, Chenomx, Edmonton, Canada) library.
All the results obtained by biochemical analyses were performed in triplicate. The results were analyzed using Statistical Package of Social Science Software (SPSS 12.0 for Windows 2003, SPSS Inc., Chicago, IL). The data were also analyzed using one-way ANOVA, followed by least significant difference analysis for multiple comparisons. The data were expressed as means ± SD, and values of p<0.05 were determined to be significant. In addition, independent t test was also performed using the SPSS software to assess the statistically significant differences of relative intensities of fructose and aspartate between MF and MP.
Multivariate statistical analysis was performed using mean-centered data and unit variance (UV) scaling. Principal component analysis (PCA), an unsupervised clustering method, was performed to observe the overview of the information contained in a data set from the statistical point of view. PCA was performed using the spectral data of 80% ethanol extracts of the flesh and the peel of mango. Partial least squares-discriminant analysis (PLS-DA) is one of the classification tools where the response variable is a ’dummy’ Y matrix expressing an orthogonal unit vector of each class.(27,28) In the current work, PLS-DA was applied to the spectrum data of plasma samples in order to observe the changes in metabolic profiling of the ethanol intake groups after the feeding of mango flesh, peel, or PBS only.
Results
Effects of mango fruit extract on plasma ethanol concentration, hepatic ADH and ALDH activity
We used mouse model in this study, therefore the total amount of plasma sample in one individual mouse was just good for one time NMR analysis. In preliminary experiments, we measured the ethanol levels in plasma of mice, according to time course by using different individual mice. In time point of two or three hours after ethanol administration, there was no significant difference among various samples, so we selected the time point as one hour after ethanol administration.
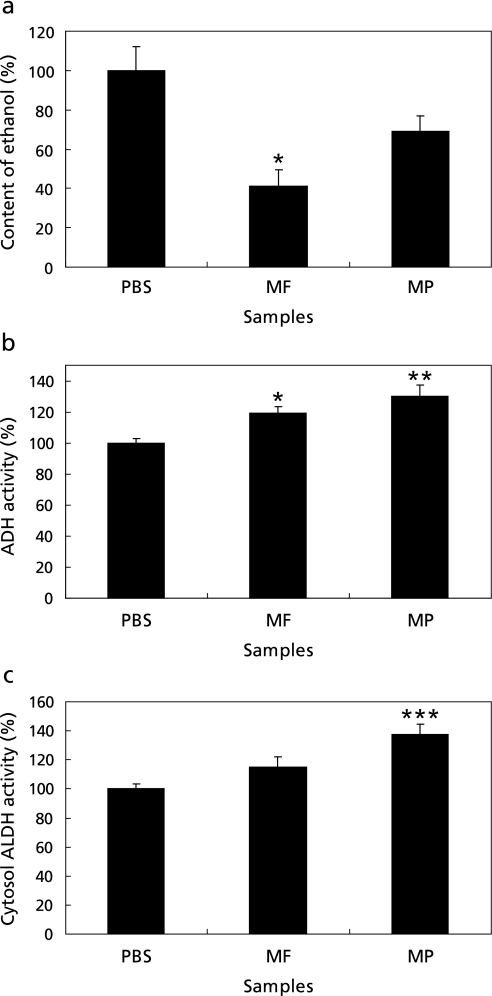
As shown in Fig. 1a, when the amount of ethanol in plasma of the PBS group was 100%, those were 41.28 ± 7.99% in the MF group, and 68.95 ± 7.89 in the MP group, respectively. The ethanol level in the MF group was decreased by over 50% of the total amount of ethanol compared to that of the PBS group. The relative ethanol level of the MF group was significantly different from that of the PBS group.
Fig. 1.
The relative concentrations (%) of plasma ethanol (a), ADH activity (b), cytosol ALDH activity (c) in the experimental groups fed with PBS, mature mango fruit flesh (MF) and mature mango fruit peel (MP). The error bars are expressed as the SEM *p<0.05 vs PBS control, **p<0.01 vs PBS control, ***p<0.001 vs PBS control.
The ADH activity assay result of each group, shown in Fig. 1b demonstrated that the group injected with the mango sample had higher ADH activities than did the PBS group. The MF and MP groups were significantly different than the PBS group at p<0.01 and 0.05, respectively. The MP group showed the highest activity at 129.76 ± 7.49%, followed by those of the MF group with 119.29 ± 3.95% ADH activities. Fig. 1c shows that the MP group had the highest activity of 137.73 ± 6.78%, significantly different from that of the PBS control at p<0.001. In summary, MF was the most effective for decreasing plasma ethanol levels, and MP was superior at stimulating ALDH activity.
Identification of the chemical constituents in mango fruit and plasma of mice fed mango fruit extract
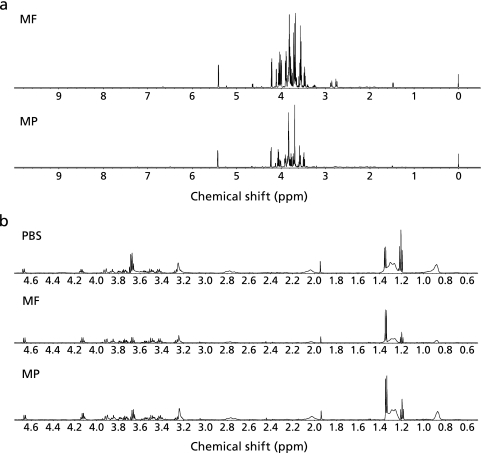
The representative 1H-NMR spectra of the aqueous fractions of MF and MP are shown in Fig. 2a. The peaks in the sugar region (δ 3.00–5.50 ppm) were higher in MF than in MP. Particularly, MF contained more sucrose than did in MP. Also, Fig. 2b shows the representative 1H-NMR spectra of mouse plasma from the PBS, MF, and MP groups. The ethanol peaks (δ = 1.16–1.24 ppm and δ = 3.64–3.72 ppm) in the MF and MP groups were lower than that in the PBS group, while the lactate peaks (δ = 1.34 ppm) in the MF and MP groups were higher than that in the PBS group.
Fig. 2.
The 600-MHz 1H-NMR spectra of (a) the 80% ethanol extracts of MF and MP and (b) the mouse plasma from the PBS, MF, and MP groups.
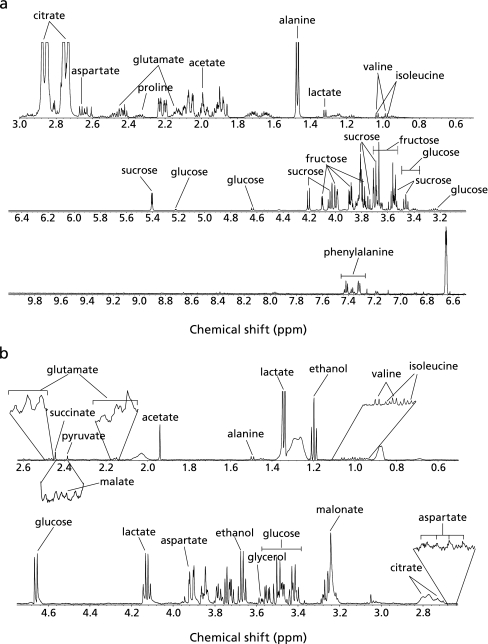
Fig. 3a shows a representative NMR spectrum of the 80% ethanol extract of MF. Twelve metabolites belonging to the categories of sugars, organic compounds, and amino acids were assigned as follows: the sugar compounds including glucose at δ = 3.20–3.25 (m), 3.36–3.50 (m), 4.63 (d, J = 8.4 Hz) and 5.22 (d, J = 3.6 Hz), fructose at δ = 3.51–3.61 (m), 3.63–3.72 (m), 3.76–3.80 (m), 3.88 (dd, J1 = 10.2 Hz, J2 = 3.6 Hz), 3.95–3.98 (m), 4.01 (dd, J1 = 12.0 Hz, J2 = 1.2 Hz) and 4.06–4.10 (m) and sucrose at δ = 3.46 (t, J = 9.6 Hz), 3.55 (dd, J1 = 9.93 Hz, J2 = 3.84 Hz), 3.65 (s), 3.75 (t, J = 9.6 Hz), 3.77–3.92 (m), 4.04 (t, J = 8.7 Hz), 4.20 (d, J = 8.4 Hz), and 5.40 (d, J = 4.2 Hz) were detected. Also, the amino acids including isoleucine at δ = 0.91 (t, J = 7.4 Hz), 0.98 (d, J = 7.14 Hz), valine at δ = 0.98 (d, J = 6.6 Hz) and 1.03 (d, J = 6.6 Hz), alanine at δ = 1.47 (d, J = 7.2 Hz), aspartate at δ = 2.67 (dd, J1 = 15.9 Hz, J2 = 7.92 Hz), glutamate at δ = 2.09–2.15 (m), 2.36–2.47 (m), proline at δ = 2.29–2.36 (m) and phenylalanine at δ = 7.32 (d, J = 6.6 Hz), 7.34–7.39 (m), 7.39–7.44 (m) were detected. In addition, several organic compounds including lactate at δ = 1.32 (d, J = 6.6 Hz), acetate at δ = 1.96 (s), and citrate at δ = 2.74 (d, J = 15.0 Hz) and 2.86 (d, J = 15.6 Hz) were detected.
Fig. 3.
Representative total 1H-NMR spectra (600-MHz, D2O) of (a) the 80% ethanol extracts of the mature mango flesh (MF) and (b) the mouse plasma from the MF group.
The representative NMR spectrum of the mouse plasma from the MF group is shown in Fig. 3b. The compounds were assigned as follows: glucose at δ = 3.37–3.57 (m), 4.66 (d, J = 8.4 Hz) and 5.24 (d, J = 3.6 Hz) was detected as the sugar compound. The amino acids including isoleucine at δ = 0.95 (t, J = 7.2 Hz) and 1.01 (d, J = 7.2 Hz), valine at δ = 1.00 (d, J = 7.2 Hz) and 1.05 (d, J = 6.6 Hz), alanine at δ = 1.49 (d, J = 7.2 Hz), glutamate at δ = 2.14–2.18 (m) and δ = 2.45–2.49 (m), and aspartate at δ = 2.66 (dd, J1 = 16.2 Hz, J2 = 8.4 Hz), and δ = 3.89 (dd, J1 = 8.5 Hz, J2 = 3.9 Hz) were detected. Many organic compounds including lactate at δ = 1.34 (d, J = 6.6 Hz) and 4.12 (q, J = 6.6 Hz), acetate at δ = 1.94 (s), malate at δ = 2.39 (dd, J1 = 14.7 Hz, J2 = 10.6 Hz), pyruvate at δ = 2.37 (s), succinate at δ = 2.44 (s), citrate at δ = 2.71 (d, J = 15.6 Hz) and 2.78 (d, J = 15.6 Hz), malonate at δ = 3.24 (s), and glycerol at δ = 3.57 (m) were also detected.
PCA and PLS-DA
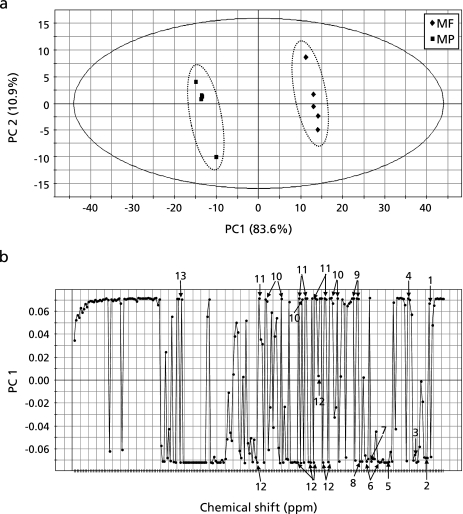
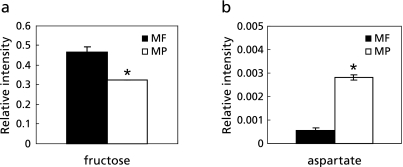
PCA was applied to the 1H-NMR spectral data of 80% ethanol extracts of the mango samples. Figure 4a shows the score plot of two principal components PC1 and PC2, which shows that separation of the plots from flesh and peel was mainly achieved by PC1. MF samples were located in a positive position along PC1, whereas the MP samples were in a negative position. This means that the metabolic profiles of the two groups were quite different. The corresponding loading plot of PC1 showed that MF contained higher amounts of isoleucine, alanine, citrate, glucose, fructose, and phenylalanine, whereas the levels of valine, lactate, acetate, glutamate, aspartate and sucrose were relatively higher in MP than those in MF (Fig. 4b). Among those compounds, relative intensities of fructose and aspartate were shown in Fig. 5, and statistically significant differences were analyzed by analysis of variance (ANOVA).
Fig. 4.
PCA score plot of the second PC versus the first PC (a), and PCA loading plot of the PC1 (b) of the 80% ethanol extracts of mature mango extracts data set. The first component explains 83.6% of the variation and the second component 10.9%. The solid ellipse indicates the 95% confidence region for Hotelling’s T2 statistic. The numbers in (b) was as follows: 1, isoleucine; 2, valine; 3, lactate; 4, alanine; 5, acetate; 6, glutamate; 7, proline; 8, aspartate; 9, citrate; 10, glucose; 11, fructose; 12, sucrose; 13, phenylalanine.
Fig. 5.
Relative intensities of fructose (a) and aspartate (b) in mango peel (MP) and flesh (MF). Error bars represent the standard deviations. *Significantly different at p<0.05.
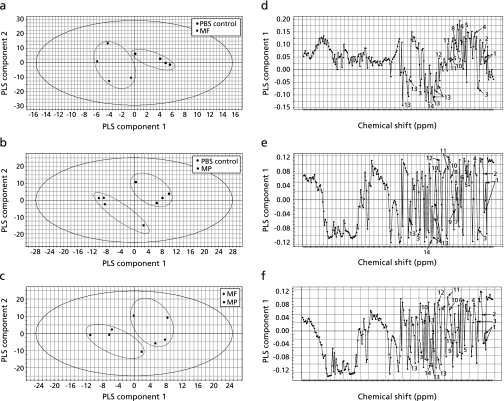
PLS-DA was performed using the data from the mouse plasma samples of the control (fed PBS only), MF (fed mango fruit flesh in PBS), and MP (fed mango fruit peel in PBS) groups. Outlier samples in preliminary PCA of the mouse plasma samples were deleted before PLS-DA (data not shown). There was a clear separation between the PBS and MF groups in the PLS-DA derived score plot (Fig. 6a). Higher amounts of lactate, glucose, and glycerol in the MF group were observed from the loading plot of the PLS-DA results (Fig. 6d), whereas lower amounts of isoleucine, valine, alanine acetate, glutamate, pyruvate, malate, succinate, aspartate, citrate, and malonate were seen in the MF group compared to those in the PBS control group. Figure 6b also showed the separation between PBS and MP groups. The corresponding loading plot (Fig. 6e) of the PLS-DA results showed similar tendency as that in Fig. 6d. Compared to the PBS group, the MP group tended to show increased levels of metabolites, such as lactate, succinate, glucose, and glycerol but reduced levels of isoleucine, valine, alanine acetate, glutamine, pyruvate, malate, aspartate, citrate, and malonate. In addition, MF and MP group were also discriminated in the score plot (Fig. 6c). The corresponding loading plot of PLS component 1 (Fig. 6f) shows that valine, lactate, alanine, glutamine, malate, aspartate, citrate, and malonate were highly abundant in the MF group, whereas isoleucine, acetate, succinate, glucose, and glycerol were more highly present in the MP group.
Fig. 6.
PLS-DA score plot of the second PLS component versus the first PLS component (a–c), and PLS-DA loading plot of the PLS component 1 (d–f) of the mouse plasma samples from the PBS vs MF group, PBS vs MP group, and MF group vs MP group, respectively. The solid ellipse indicates the 95% confidence region for Hotelling’s T2 statistic. The numbers in (b) are as follows: 1, isoleucine; 2, valine; 3, lactate; 4, alanine; 5, acetate; 6, glutgmate; 7, pyruvate; 8, malate; 9, succinate; 10, aspartate; 11, citrate; 12, malonate; 13, glucose; 14, glycerol.
Discussion
Mitochondrial ALDH2 in humans is the major acetaldehyde-oxidizing enzyme with a very low Km value for acetaldehyde. In contrast, it was reported that both cytosolic ALDH and mitochondrial ALDH2 in rodents are involved in the metabolism of acetaldehyde at physiological concentrations because rodent cytosolic ALDH isozymes exhibit relatively-low Km values for acetaldehyde.(29) We measured ALDH activity both in cytosol and mitochondria. However, there was no significant difference in the mitochondrial ALDH. Therefore only the cytosolic ALDH activities were described in the manuscript. The liver was taken from the mice one hour after ethanol administration together with plasma as mentioned above. In further studies, we will also validate the effect of mango on ethanol- metabolizing enzyme activities according to time course using rat or human model.
ADH and ALDH activities were increased in mature mango fruit sample-fed mouse groups, and it can be suggested that the ethanol degradation process was promoted by the administration of mature mango fruit extract (Fig. 1 b and c). As shown in Fig. 1c, MP showed remarkably higher levels of cytosol ALDH activity compared to those of the control group fed with PBS only. The ALDH is more important for preventing hangover symptoms by degrading acetaldehyde; therefore, MP might be a good resource for overcoming hangover. It was reported that glycerol and NAD+ are produced in a catalytic process for the degradation of fructose, and the speed of NAD+ supplement controls the speeds of degradation of alcohol and acetaldehyde.(30) Higher levels of glycerol were observed in the plasma of MP and MF group than PBS group, even though fructose was not observed in the plasma samples (Fig. 6 d and e). The fructose in MF and MP samples might be used actively for producing glycerol and NAD+. Therefore, it is suggested that the increased activities of ADH and ALDH in mature mango fruit-fed mouse groups could be caused by fructose. However, Fig. 4b and 5a shows that fructose was more abundant in MF samples than in MP samples. This means that there was another mechanism of activation of alcohol-degrading enzymes due to the ingestion of mango fruits. As shown in Fig. 4b and 5b, MP has a higher level of aspartate than MF. In Fig. 6f, however, the MP group plasma contained a lower level of aspartate than those of the MF group. It has been known that the NAD+ which was generated in aspartate degradation process stimulated alcohol degradation enzymes.(31) This demonstrates that aspartate in MP might be metabolized in the mouse body, and in this process, NAD+ was produced, and alcohol degradation was promoted.
Kim and Park(3) reported that Rhodiola sachalinenesis extract contains active ingredients, which strongly adsorbs alcohol, thus preventing absorption of alcohol in the gastrointestinal tracts of animals. Though the levels of ADH and ALDH activity were higher in the mature mango fruit-fed mouse group than in the PBS group, acetate contents, the end-product of alcohol degradation, were higher in the PBS control (Fig. 6 d and e). These findings suggest that the absorbed amounts of ethanol in the mango fruit-fed mouse groups were much smaller than those in the PBS group in early stage of ethanol intake. It is well-known that acetic acid derived from alcohol is released into plasma from the liver. It is also reported that the acetic acid level in blood can be used as an indicator of enhanced ethanol elimination.(32)
In this study, it was assumed that mature mango fruit extract also inhibited ethanol absorption into the mouse body by adsorbing it itself. In conclusion, the mechanism by which mango fruits decrease plasma ethanol levels could be through the stimulation of ethanol degradation processes or the inhibition of ethanol absorption. Mango fruit extract affected the activities of hepatic ADH and ALDH involved in ethanol metabolism. The 1H-NMR based metabolomic profile data showed a difference in composition between mature mango fruit flesh and peel, and there were also metabolic differences in mouse plasma samples of the control, MF, and MP groups after the ethanol treatment. It was assumed that the fructose and aspartate contained in mango fruit produced NAD+, which stimulates ethanol degradation enzymes, during the breakdown into other metabolites. It was already reported that the catabolism of ethanol was enhanced by fructose and aspartate,(30,31) however the exact dose of those compounds to stimulate the catabolism of ethanol was not reported. The quantification and effective dose of fructose and aspartate in mango will be performed in further studies.
Furthermore, though higher levels of ADH and ALDH activity were present in mature mango fruit-fed mouse groups, higher levels of acetate in the PBS control group demonstrated that the level of ethanol absorbed into the mouse body was higher in the PBS group than those in the mature mango fruit-fed mouse groups. To summarize, the ethanol-decreasing activities of mature mango fruit extracts might be due to the stimulation of ethanol metabolism and the inhibition of ethanol absorption in the gastrointestinal tracts of mice. In particular, mature mango fruit peel (MP) remarkably increased the activity of ALDH, which is known to metabolize acetaldehyde into acetic acid, reducing hangover symptoms. Therefore, these findings imply that mature mango flesh and peel extracts could be used as resources for natural medicines or functional foods having ethanol-decreasing activity after ethanol uptake.
Acknowledgments
This work was supported by the Korea Science and Engineering Foundation (KOSEF) grant funded by the Korea government (MEST) (No. R01-2007-000-20492-0), Republic of Korea.
Abbreviations
- ADH
alcohol dehydrogenase
- ALDH
acetaldehyde dehydrogenase
- M. indica
Mangifera indica
- NMR
nuclear magnetic resonance spectrometry
- TCA
tricarboxylic acid
- TSP
3-(trimethylsilyl)-propionic-2,2,3,3-d4 acid sodium salt
- PCA
principal component analysis
- PC
principal component
- PLS-DA
partial least squares-discriminant analysis
References
- 1.Li TK. Enzymology of human alcohol metabolism. Adv Enzymol Relat Area Mol Biol. 1977;45:427–483. doi: 10.1002/9780470122907.ch6. [DOI] [PubMed] [Google Scholar]
- 2.Swift R, Davidson D. Alcohol hangover: mechanisms and mediators. Alcohol Health Res World. 1998;22:54–60. [PMC free article] [PubMed] [Google Scholar]
- 3.Kim MH, Park CK. Inhibition of ethanol absorption by Rhodiola sachalinensis in rats. Arch Pharm Res. 1997;20:432–437. doi: 10.1007/BF02973935. [DOI] [PubMed] [Google Scholar]
- 4.Sumi H, Yatagai C, Wada H, Yoshida E, Maruyama M. Effect of Bacillus natto-fermented product (BIOZYME) on blood alcohol, aldehyde concentrations after whisky drinking in human volunteers, and acute toxicity of acetaldehyde in mice. Arukoru Kenkyuto Yakubutsu Ison. 1995;30:69–79. [PubMed] [Google Scholar]
- 5.Lee HS, Song J, Kim TM, et al. Effects of a preparation of combined glutathione-enriched yeast and rice embryo/soybean extracts on ethanol hangover. J Med Food. 2009;12:1359–1367. doi: 10.1089/jmf.2008.1367. [DOI] [PubMed] [Google Scholar]
- 6.Yamazaki T, Hosono T, Matsushita Y, et al. Pharmacological studies on Puerariae flos. IV: effects of Pueraria thomsonii dried flower extracts on blood ethanol and acetaldehyde levels in humans. Int J Clin Pharm Res. 2002;22:23–28. [PubMed] [Google Scholar]
- 7.Sakai K, Saitoh Y, Ikawa C, Nishihata T. Effect of water extracts of aloe and some herbs in decreasing blood ethanol concentrations in rats. II. Chem Pharm Bull (Tokyo) 1989;37:155–159. doi: 10.1248/cpb.37.155. [DOI] [PubMed] [Google Scholar]
- 8.Haranaka R, Okada N, Kosoto H, et al. Effects of Wu-Ling-San on alcohol metabolism and alcohol liver. J Tradit Chin Med. 1985;5:171–178. [PubMed] [Google Scholar]
- 9.Seo KH, Kim SH. A study on the analysis of oriental functional beverage and on the blood alcohol concentration of rat after drinking liquors. Korean J Food Nutr. 2001;14:222–227. [Google Scholar]
- 10.Ylikahri RH, Leino T, Huttunen MO, Pösö AR, Eriksson CJP, Nikkilä EA. Effects of fructose and glucose on ethanol-induced metabolic changes and on the intensity of alcohol intoxication and hangover. Eur J Clin Invest. 1976;6:93–102. doi: 10.1111/j.1365-2362.1976.tb00498.x. [DOI] [PubMed] [Google Scholar]
- 11.Tygstrup N, Winkler K, Lundquist F. The mechanism of the fructose effect on the ethanol metabolism of human liver. J Clin Invest. 1965;44:817–830. doi: 10.1172/JCI105194. [DOI] [PMC free article] [PubMed] [Google Scholar]
- 12.Iimuro Y, Bradford BU, Forman DT, Thurman RG. Glycine prevents alcohol-induced liver injury by decreasing alcohol in the rat stomach. Gastroenterology. 1996;110:1536–1542. doi: 10.1053/gast.1996.v110.pm8613061. [DOI] [PubMed] [Google Scholar]
- 13.Lee JH, Kim NK, Lee DY, Lee CH. Protective effect of selected amino acids and food extracts on ethanol toxicity determent in rat liver. Korean J Food Sci Technol. 1999;31:802–808. [Google Scholar]
- 14.Cha JY, Jung HJ, Jeong JJ, Yang HJ, Kim YT, Lee YS. Effects of amino acids on the activities of alcohol metabolizing enzyme alcohol dehydrogenase (ADH) and acetaldehyde dehydrogenase (ALDH) J Life Sci. 2009;19:1321–1327. [Google Scholar]
- 15.Magonet E, Hayen P, Delfoge D, Delaive E, Remarcle J. Importance of the structural zinc atom for the stability of yeast alcohol dehydrogenase. Biochem J. 1992;287:361–365. doi: 10.1042/bj2870361. [DOI] [PMC free article] [PubMed] [Google Scholar]
- 16.Kelly M, Myrsten AL, Goldberg L. Intravenous vitamines in acute alcoholic intoxication: effects on physiological and psychological functions. Br J Addict Alcohol Other Drugs. 1971;66:19–30. doi: 10.1111/j.1360-0443.1971.tb02362.x. [DOI] [PubMed] [Google Scholar]
- 17.Jung TW, Lee JY, Shim WS, et al. Rosiglitazone relieves acute ethanol-induced hangover in Sprague-Dawley rats. Alcohol Alcohol. 2006;41:231–235. doi: 10.1093/alcalc/agl013. [DOI] [PubMed] [Google Scholar]
- 18.Mitra SK, Baldwin EA. Postharvest physiology storage of tropical and subtropical fruit. New York: CAB International; 1997. pp. 85–122. [Google Scholar]
- 19.Masibo M, He Q. Mango bioactive compounds and related nutraceutical properties—a review. Food Rev Int. 2009;25:346–370. [Google Scholar]
- 20.Ribeiro SMR, Schieber A. Bioactive Compounds in Mango (Mangifera indica L.) In: Watson R, Preedy V, editors. Bioactive Foods in Promoting Health: Fruits and vegetables. Missouri: Academic Press; 2010. pp. 507–523. [Google Scholar]
- 21.Kim H, Moon JY, Kim H, et al. Antioxidant and antiproliferative activities of mango (Mangifera indica L.) flesh and peel. Food Chem. 2010;121:429–436. [Google Scholar]
- 22.Parmar HS, Kar A. Protective role of Mangifera indica, Cucumis melo and Citrullus vulgaris peel extracts in chemically induced hypothyroidism. Chem Biol Interact. 2009;177:254–258. doi: 10.1016/j.cbi.2008.11.006. [DOI] [PubMed] [Google Scholar]
- 23.Pourahmad J, Eskandari MR, Shakibaei R, Kamalinejad M. A search for hepatoprotective activity of fruit extract of Mangifera indica L. against oxidative stress cytotoxicity. Plant Food Hum Nutr. 2010;65:83–89. doi: 10.1007/s11130-010-0161-9. [DOI] [PubMed] [Google Scholar]
- 24.Tilak-Jain JA, Devasagayam TPA. Cardioprotective and other beneficial effects of some Indian medicinal plants. J Clin Biochem Nutr. 2006;38:9–18. [Google Scholar]
- 25.Blandino A, Caro I, Cantero D. Comparative study of alcohol dehydrogenase activity in flor yeast extracts. Biotech Lett. 1997;19:651–654. [Google Scholar]
- 26.Bostian KA, Betts GF. Kinetics and reaction mechanism of potassium-activated aldehyde dehydrogenase from Saccharomyces cerevisiae. Biochem J. 1978;173:787–798. doi: 10.1042/bj1730787. [DOI] [PMC free article] [PubMed] [Google Scholar]
- 27.Keun HC, Ebbels TMD, Antti H, et al. Improved analysis of multivariate data by variable stability scaling: application to NMR-based metabolic profiling. Anal Chim Acta. 2003;490:265–276. [Google Scholar]
- 28.Barker M, Rayens W. Partial least squares for discrimination. J Chemometrics. 2003;17:166–173. [Google Scholar]
- 29.Klyosov AA, Rashkovetsky LG, Tahir MK, Keung WM. Possible role of liver cytosolic and mitochondrial aldehyde dehydrogenases in acetaldehyde metabolism. Biochemistry. 1996;35:4445–4456. doi: 10.1021/bi9521093. [DOI] [PubMed] [Google Scholar]
- 30.Koolman J, Roehm KH. Color atlas of biochemistry. New York: Thieme; 2004. pp. 310–311. [Google Scholar]
- 31.Bremer J, Davis EJ. Studies on the active transfer of reducing equivalents into mitochondria via the malate-aspartate shuttle. Biochim Biophys Acta. 1975;376:387–397. doi: 10.1016/0005-2728(75)90161-9. [DOI] [PubMed] [Google Scholar]
- 32.Nuutinen H, Lindros K, Hekali P, Salaspuro M. Elevated blood acetate as indicator of fast ethanol elimination in chronic alcoholics. Alcohol. 1985;2:623–626. doi: 10.1016/0741-8329(85)90090-4. [DOI] [PubMed] [Google Scholar]


