

Non-technical summary
Recombinant human erythropoietin (rHuEPO) decreases circulating levels of renin and aldosterone, two hormones regulating water and salt homeostasis, but the effect of rHuEPO on renal function is unknown. This study demonstrates that rHuEPO reduces the reabsorption of water and sodium in the proximal renal tubules and, probably by activation of the tubuloglomerular feedback mechanism, also causes a fall in glomerular filtration rate. Thus, the decrease in plasma concentrations of renin and aldosterone may be secondary to increased end-proximal tubular delivery of water and sodium. In conclusion, the fall in proximal reabsorption together with a reduced filtered load and a decrease in angiotensin II and aldosterone-dependent tubular reabsorption are expected to increase the oxygen tension in the renal tissue. This may serve to down-regulate the endogenous renal synthesis of EPO in the presence of high levels of circulating rHuEPO.
Abstract
Abstract
Recombinant human erythropoietin (rHuEPO) elevates haemoglobin concentration both by increasing red blood cell volume and by a decrease in plasma volume. This study delineates the association of rHuEPO-induced changes in blood volumes with changes in the renin–aldosterone system and renal function. Sixteen healthy males were given rHuEPO for 28 days in doses raising the haematocrit to 48.3 ± 4.1%. Renal clearance studies with urine collections (N = 8) were done at baseline and at days 4, 11, 29 and 42. Glomerular filtration rate (GFR) was measured by 51Cr-EDTA. Renal clearance of lithium (CLi) was used as an index of proximal tubular outflow and to assess segmental renal tubular handling of sodium and water. rHuEPO-induced increases in haematocrit occurred from day 10 onwards and was caused by both an increase in red cell volume and a fall in plasma volume. Well before that (from day 2 and throughout the treatment time), rHuEPO decreased plasma levels of renin and aldosterone (N = 8) by 21–33% (P < 0.05) and 15–36% (P < 0.05), respectively. After cessation of rHuEPO, values returned to baseline. On days 11 and 29, CLi increased (P < 0.02) indicating a significant 10–16% decrease in absolute proximal reabsorption of sodium and water (APR = GFR −CLi, P < 0.05). GFR decreased slightly, albeit significantly, on day 4 (P < 0.05). In conclusion, rHuEPO promptly, and before any changes in blood volumes and haematocrit can be detected, causes a down-regulation of the renin–aldosterone system. The results are compatible with a rHuEPO-induced reduction in proximal reabsorption rate leading to activation of the tubuloglomerular feedback mechanism and a fall in GFR. Therefore, treatment with rHuEPO may result in suppression of endogenous EPO synthesis secondary to a decrease in intrarenal oxygen consumption.
Introduction
Erythropoietin (EPO) is a glycoprotein produced mainly in the kidney but also in the liver and other tissues (Jelkmann, 1992). After its release into the bloodstream EPO binds to its receptor predominantly located within the bone marrow where erythropoiesis is stimulated. Besides the well-known actions of recombinant human EPO (rHuEPO) on red blood cell production, we recently demonstrated that rHuEPO also increases haemoglobin concentration by decreasing plasma volume (Lundby et al. 2007). When calculating their relative contribution to the increase in haemoglobin over a 13 week period, the augmented red blood cell mass contributed between 46 and 62%, and the reduction in plasma volume 38–54% (Lundby et al. 2007). Thus, their respective effects on oxygen homeostasis were surprisingly similar, suggesting a strong mechanism for both systems.
A similar mechanism to increase arterial oxygen content is seen when humans are exposed to high altitude. Here haemoglobin concentration and the arterial oxygen content are increased by a fall in plasma volume within the first day of exposure, and after approximately 12 days an increase in red blood cell mass also contributes to the normalisation of haemoglobin concentration (Hannon et al. 1969). It appears beneficial that plasma volume is decreased in the acute presence of hypoxia since such a response increases oxygenation rapidly as compared with a mechanism depending exclusively on augmented erythropoiesis. At high altitude the decrease in plasma volume is unexpectedly associated with decreases in renin and aldosterone (Olsen et al. 1993). Although it remains at the speculative level if these changes are induced by endogenous EPO, our previous study using rHuEPO demonstrated that changes in plasma and red cell volumes were preceded by rapid decreases in these volume-regulating hormones (Lundby et al. 2007). Plasma volume is maintained within narrow limits in normal humans, and extracellular fluid volume is regulated through a feedback loop of afferent high and low pressure sensors located in cardiopulmonary, renal and hepatic tissues (Dunn & Donnelly, 2007). Thus, an increase in blood pressure will lead to renal sodium and water excretion. At altitude excessive sympathoexitation normally increases arterial blood pressure (Calbet, 2003; Hansen & Sander, 2003) and it is at present unknown if the changes in renin and aldosterone are related to this. In our previous study, however, rHuEPO-induced changes in renin and aldosterone levels occurred well before arterial pressure increased slightly (Lundby et al. 2007).
The receptor for EPO has in the last few years been localized in noumerous non-erythroid tissues such the brain, retina, heart, smooth muscle cells, and in the cortex, medulla and papilla regions of the kidneys in humans (reviwed in Arcasoy, 2008). In this context we have localized the receptor in human skeletal muscle samples and reported on induction of certain genes following EPO treatment, and hence suggesting a functional role of the receptor (Lundby et al. 2008b). Nevertheless, the functionality of the EPO receptor has recently been questioned (Sinclair et al. 2010). Based on the above, we speculate that rHuEPO may have distinct effects on renal function besides the effect on the renin–aldosterone system. To test this we administered rHuEPO for 4 weeks in 16 healthy volunteers and examined the effects on blood volumes, plasma concentrations of renin and aldosterone, glomerular filtration rate and renal tubular reabsorbtion.
Methods
Subjects
Sixteen healthy male volunteers, age 24 (3) years (mean (s.d.)), height 182 (6) cm, and body weight 78 (6) kg were included. The study was approved by the Ethics Committee of Copenhagen and Frederiksberg, Denmark, and conformed to the Declaration of Helsinki. All subjects gave written informed consent to participate.
Protocol
Each subject received 4 weeks treatment with rHuEpo (epoetin β, NeoRecormon, Roche, Mannheim, Germany). rHuEpo (5000 IU) was injected subcutaneously once every second day for 2 weeks, and thereafter once a week in experimental weeks 3 and 4, i.e. on days 0, 2, 4, 6, 8, 10, 12, 14, 21 and 28. All injections were administered between 08.00 and 10.00 am. The subjects did not receive any iron supplementation. We have used this protocol previously to increase the haematocrit from around 44% to just below 50% (Lundby et al. 2008a). Venous blood samples from an antecubital vein were obtained prior to the first administration of rHuEPO (baseline) on two occasions separated by 1 week and on days 2, 4, 6, 10, 14, 28, 35 and 42. All blood samples were taken between 08.00 and 10.00 am after at least 10 min of rest in the sitting position and before administration of rHuEPO. Blood samples were immediately centrifuged at 3000 g for 5 min and the plasma samples were stored at −80°C until analysis.
Measurements of total haemoglobin mass and blood volumes
Total red blood cell volume, haemoglobin mass, plasma volume and blood volume were determined/calculated in all subjects by a carbon monoxide (CO) re-breathing method (Lundby et al. 2007) at baseline and on four subsequent occasions between days 6–8, days 10–12, days 28–30 and days 42–43. On the same occasions, blood pressure (measured by sphygmomanometry) was recorded in the seated position after 10 min of rest. The administered volume of CO in each investigation was 1.3 ml (kg body weight)−1. Carboxyhaemoglobin (COHb), haemoglobin concentration and haematocrit were analysed in triplicate for each measurement by an automated system (Radiometer ABL 700, Radiometer, Copenhagen, Denmark). To access the variability of the method all subjects (N = 16) were investigated twice (separated by 24 h) at baseline before administration of rHuEPO. Coefficient of variation was 2.5% for red blood cell volume.
Renal clearance measurements
Renal clearance studies were performed in eight, randomly chosen subjects at baseline and on days 4, 11, 29 and 42. The subjects refrained from smoking, alcohol and caffeine-containing drinks for 24 h before the clearance measurements. Lithium carbonate (300 mg; 8.1 mmol) was given orally on the evening before each investigation. After an overnight fast, the clearance studies were started at 08.00 am by oral intake of tap water to facilitate urine collections (250 ml every hour without initial load). The water intake was mantained throughout the renal clearance studies to produce a state of water diuresis where the urine outflow approximately equalled the water intake. Except for briefly standing when voiding, the subjects were confined to a resting sitting position. After an equilibration period of at least 1 h and immediately before the investigation, the subjects emptied their bladder and the time was noted (T = 0 min). Thereafter, a 200 min clearance period was conducted. During the clearance period all urine was collected, and at the end of the investigation, the subjects emptied their bladder and the time was noted. Venous blood samples from an antecubital vein were drawn at 0, 100 and 200 min.
Glomerular filtration rate (GFR) was measured by the one-sample 51Cr-EDTA (3.7 MBq) clearance technique using a plasma sample drawn at 200 min after tracer injection (Groth, 1981). On two study days (at baseline and after 11 days of rHuEPO treatment), GFR was also calculated by a four-sample 51Cr-EDTA clearance technique (Bröchner-Mortensen, 1972). When comparing GFR data obtained by the two techniques a close correlation was observed with a mean coefficient of variation of 3.0%. All GFR data used in this study were generated by the one-sample method.
Measurements of the renal clearance of lithium, used in this study as an index of proximal tubular fluid outflow (Thomsen & Olesen, 1984), were done simultaneously with the measurements of GFR. Renal clearances of lithium (CLi) and sodium (CNa) were each calculated from the 200 min urinary excretion rates and representative values of plasma concentrations of lithium and sodium calculated as the mean from blood samples obtained at 0, 100 and 200 min.
Analytical methods
51Cr-EDTA activity in plasma and standards was measured in a well gamma-counter (Cobra-II, Pachard Instrument Company, Meriden, CT, USA). Plasma sodium was measured with a Technicon SMAC, and urinary sodium was determined with a Technicon RA 1000 (Tarrytown, NY, USA). Plasma and urinary lithium were measured by atomic absorption spectrophotometry (model 403, Perking-Elmer, Norwalk, CT, USA). Renin and aldosterone plasma concentrations (N = 8) were measured by ELISA kits (USCN Life Science Inc., China, and BioVendor Laboratory Medicine, Inc., Czech Republic, respectively).
Calculations
Reabsorption and excretion rates of sodium and water were calculated based on the assumption that CLi provides an accurate measurement of the rate of end-proximal delivery of fluid and sodium (Thomsen & Olesen, 1984): Absolute proximal reabsorption rate (APR) = GFR −CLi; proximal fractional reabsorption (FPR) = 1 − (CLi/GFR); absolute distal reabsorption of sodium (ADRNa) = (CLi−CNa) × PNa, where PNa is plasma concentration of sodium; absolute distal reabsorption of water  , where V is urine flow rate; fractional distal reabsorption of sodium (FDRNa) = (CLi−CNa)/CLi. Fractional excretions of sodium (FENa), lithium (FELi) and water (
 ) were calculated as CNa/GFR, CLi/GFR and V/GFR, respectively. Glomerular filtration rate of sodium and renal excretion rate of sodium were determined as GFR × PNa and UNa×V, respectively, where UNa is the urinary concentration of sodium.
Statistical analysis
The effect of rHuEpo was analysed by a one-way ANOVA for repeated measures and pair-wise comparisons versus baseline with t tests corrected for multible comparisons (Bonferoni). Results are expressed as means (s.d.).
Results
Haematocrit, haemoglobin and blood volumes (Table 1 and Fig. 1)
Table 1.
Haematocrit, haemoglobin concentration [Hb] and blood volumes before (baseline) and following 4 weeks of rHuEpo treatment
| Time after first rHuEPO administration | |||||
|---|---|---|---|---|---|
| Baseline | Days 6–8 | Days 10–12 | Days 28–30 | Days 42–43 | |
| Haematocrit (%) | 45.3 (2.6) | 46.6 (3.1)* | 47.4 (3.0)* | 48.3 (4.1)* | 46.1 (2.9) |
| [Hb] (g dl−1) | 14.8 (0.9) | 15.2 (1.0)* | 15.5 (1.1)* | 15.8 (1.4)* | 15.1 (1.0) |
| Plasma volume (ml) | 3558 (357) | 3455 (347) | 3268 (408)* | 3389 (516) | 3636 (381) |
| Red blood cell volume (ml) | 2949 (334) | 3019 (370) | 2941 (333) | 3151 (373)* | 3112 (351)* |
| Blood volume (ml) | 6508 (603) | 6474 (603) | 6210 (649)* | 6539 (726) | 6748 (616) |
N = 16. Values are means (s.d.).
P < 0.05 compared with baseline values.
Figure 1. Relative changes in blood volumes.
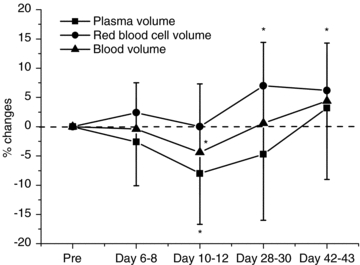
N = 16. Values are means (s.d.). *P < 0.05 compared with baseline.
Haematocrit increased gradually during administration of rHuEPO. Haemoglobin concentration increased by 2.9 ± 4.4%, 4.6 ± 3.8% and 6.6 ± 6.4%, respectively, on days 6–8, 10–12 and 28–30, and decreased toward pre-injection values by day 42–43, still being 1.9 ± 6.7% higher compared with baseline. These changes were the consequence of changes in plasma and red cell volumes. Plasma volume started to decrease by days 6–8 and was reduced by 8.0 ± 8.7% on days 10–12, after which plasma volume gradually returned toward pre-injection levels. Red blood cell volume increased on days 28–30 by 7.0 ± 7.4%, and remained elevated on days 42–43 by 6.2 ± 8.1%. Total blood volume remained stable, albeit being decreased 4.4 ± 7.3% on days 10–12.
Arterial blood pressures and heart rate (Table 2)
Table 2.
Arterial blood pressures and heart rate before (baseline) and following 4 weeks of rHuEpo treatment
| Time after first rHuEpo administration | |||||
|---|---|---|---|---|---|
| Baseline | Day 8 | Day 12 | Day 29 | Day 42 | |
| Systolic blood pressure (mmHg) | 127 (10) | 133 (8) | 131 (9) | 140 (12)** | 140 (8) ** |
| Diastolic blood pressure (mmHg) | 79 (7) | 78 (10) | 75 (7) | 72 (7) | 75 (5) |
| Mean arterial pressure (mmHg) | 95 (7) | 97 (9) | 94 (7) | 94 (8) | 97 (6) |
| Pulse pressure (mmHg) | 49 (6) | 55 (6) * | 56 (7) ** | 68 (7) ** | 66 (6) ** |
| Heart rate (beats min−1) | 72 (13) | 69 (14) | 61 (6) * | 65 (7) | 65 (5) |
N = 16. Values are means (SD).
P < 0.05
P < 0.01 compared with baseline values.
rHuEPO increased the systolic blood pressure in the post-treatment period but did not induce significant changes in diastolic pressure. Thus, mean arterial pressure remained unchanged throughout the study whereas pulse pressure increased on all study days following the initiation of rHuEpo injections. Heart rate decreased significantly on day 12.
Plasma concentrations of renin and aldosterone (Fig. 2)
Figure 2. Plasma concentrations or renin and aldosterone.
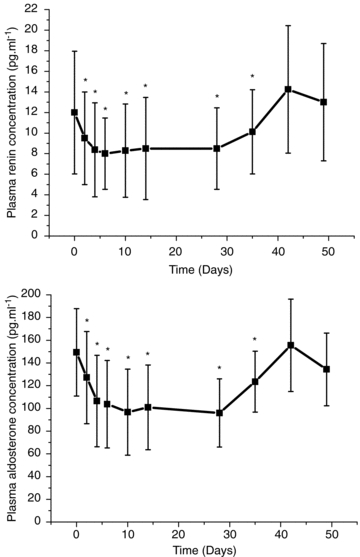
Plasma concentrations of renin and aldosterone before (0) and after 2, 4, 6, 10, 14, and 28 days of treatment with rHuEpo and after 1 week (Day 35), 2 weeks (Day 42), and 3 weeks (Day 49) after the last injection. N = 8. Values are means (s.d.). *P < 0.05 compared with baseline.
Renin and aldosterone concentrations decreased 2 days after the first injection of rHuEPO and remained reduced by 21–33% and 15–36%, respectively, throughout the injection period. After cessation of rHuEPO treatment both renin and aldosterone returned to pre-injection values by day 42.
Glomerular filtration rate (GFR), lithium clearance and absolute proximal reabsorbtion rate (APR) (Fig. 3)
Figure 3. Glomerular filtration rate, lithium clearance and absolute proximal reabsorbtion rate.
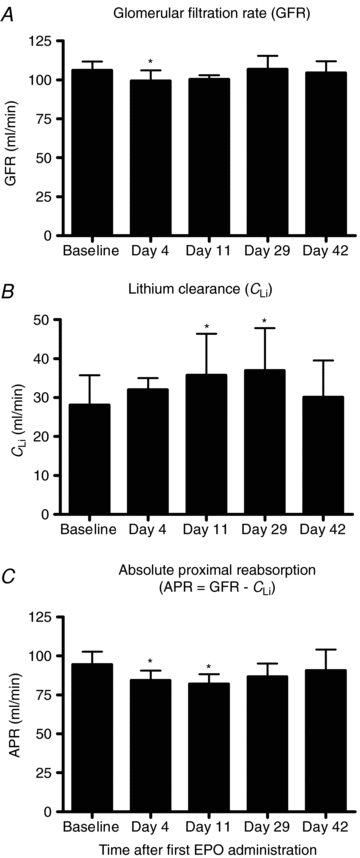
Glomerular filtration rate (A), lithium clearance (B), and absolute proximal reabsorbtion rate (C) before injections with rHuEpo (baseline) and following 4 weeks of rHuEpo treatment (days 11 and 29) and again after two weeks with no injections (day 42). N = 8. Values are means (s.d.). *P < 0.05 compared with baseline values.
GFR decreased by 5.8 ± 1.7% on day 4 but was unchanged compared with baseline on days 11, 29 and 42, the percentage changes being −3.8 ± 2.1, 1.0 ± 2.6 and −1.4 ± 2.6%, respectively. Lithium clearance increased throughout the study period, the percentage change being 13.5 ± 16.1, 28.0 ± 8.4, 33.1 ± 10.7 and 15.8 ± 17.6% compared with baseline on days 4, 11, 29 and 42, respectively. Fractional excretion of lithium (FELi=CLi/GFR) was 0.23 ± 0.06 at baseline and increased to 0.26 ± 0.06 (day 4, NS), 0.30 ± 0.08 (day 11, P = 0.003), 0.30 ± 0.08 (day 29, P = 0.007) and 0.25 ± 0.08 (day 42, NS), respectively. rHuEPO decreased APR by 8.6 ± 4.4 and 12.9 ± 2.6% on days 4 and 11, whereas rHuEPO had no statistically significant effects on APR on days 29 and 42, the percentage changes being −8.1 ± 2.7 and −3.5 ± 6.1%, respectively. Fractional proximal reabsorption (FPR = 1 −CLi/GFR) decreased significantly from 0.77 ± 0.06 (baseline) to 0.74 ± 0.06 (day 4, NS), 0.70 ± 0.08 (day 11, P = 0.003), 0.70 ± 0.08 (day 29, P = 0.007) and 0.75 ± 0.08 (day 42, NS), respectively.
Urine flow rate, absolute distal reabsorption of sodium (ADRNa) and water ( ), fractional distal reabsorption of sodium (FDRNa), fractional excretions of sodium (FENa) and water (
 ), and renal filtration and excretion rates of sodium (Table 3)
Table 3.
Urine flow rate, absolute distal reabsorption of sodium (ADRNa) and water ( ), fractional distal reabsorption of sodium (FDRNa), fractional excretions of sodium (FENa) and water (
 ), glomerular filtration rate of sodium and renal excretion rate of sodium before (baseline) and following 4 weeks of rHuEpo treatment
| Time after first rHuEpo administration | |||||
|---|---|---|---|---|---|
| Baseline | Day 4 | Day 11 | Day 29 | Day 42 | |
| Urine flow rate (ml min−1) | 7.1 (0.8) | 4.2 (0.6)** | 5.3 (0.6)** | 4.8 (1.5)** | 4.7 (2.2)** |
| ADRNa (mmol min−1) | 3.60 (0.97) | 3.92 (0.99) | 4.39 (1.01)* | 4.83 (1.38)* | 3.88 (1.18) |
 (ml min−1) (ml min−1) |
21.1 (7.8) | 24.7 (7.2) | 30.7 (11.2)+ | 31.9 (10.6)** | 25.0 (9.5) |
| FDRNa | 0.94 (0.01) | 0.95 (0.02)** | 0.96 (0.02)** | 0.95 (0.01)* | 0.95 (0.02)* |
| FENa | 0.014 (0.004) | 0.012 (0.005) | 0.012 (0.005) | 0.014 (0.006) | 0.012 (0.008) |
 |
0.057 (0.009) | 0.042 (0.015)** | 0.043 (0.009)* | 0.041 (0.013)** | 0.042 (0.018)** |
| Filtration rate of Na+ (mmol min−1) | 16.7 (1.2) | 16.1 (1.0) | 16.5 (1.0) | 17.0 (1.3) | 16.4 (1.2) |
| Excretion rate of Na+ (mmol min−1) | 0.23 (0.06) | 0.19 (0.10) | 0.20 (0.08) | 0.25 (0.10) | 0.21 (0.13) |
N = 8. Values are means ±s.d.
P < 0.05
P < 0.01
+P < 0.005 compared with baseline values.
Urine flow rate was consistently decreased by between 26.1 ± 35.7% (day 11) and 28.7 ± 34.4% (day 4) throughout the duration of the study compared with baseline measurements. ADRNa and  increased significantly on days 11 and 29. rHuEPO also significantly increased FDRNa from day 4 onwards. FENa remained unchanged but
  decreased in all experimental conditions following baseline measurements. rHuEPO had no effect on overall filtration and excretion rates of sodium.
Discussion
The haematopoietic effect of EPO and rHuEPO has been known for five decades (Erslev, 1953) but still the exact mechanisms for regulation of EPO synthesis in the kidneys remain unclear. The present study suggests that abundant levels of circulating EPO in normal subjects possess intrinsic effects in the kidneys, leading to a reduction in proximal tubular reabsorption rate and a fall in GFR. These effects were associated with marked decreases in circulating levels of renin and aldosterone. In addition, we confirmed our previous observation that rHuEPO in normal subjects produces arterial hypertension and a reduction in plasma volume (Lundby et al. 2007). Moreover, the current study delineated the time course of these changes: rHuEPO promptly, and before any changes in haematocrit, blood volumes and blood pressure can be detected, causes a down-regulation of the renin–aldosterone system, proximal tubular reabsorption and GFR.
The effect of rHuEPO on arterial blood pressure has been demonstrated to occur independent of its haematopoietic effect and subsequent effect on blood viscosity (Krapf & Hulter, 2009). Recently, we reported that also short-time administration of very high doses of rHuEPO (30,000 IU day−1 for 3 days) increases arterial blood pressure and the blood pressure response to exercise to a similar extent as prolonged, low-dose rHuEPO for 3 months (Rasmussen et al. 2010). The exact mechanisms remain unclear, but may involve rHuEPO-induced release of endothelin (Bode-Böger et al. 1996) and inhibition of eNOS-mediated production of NO (Wang & Vaziri, 1999; Scalera et al. 2005).
The early rHuEPO-induced reduction of renin and aldosterone was not caused by changes in plasma and blood volumes. A fall in intravascular volume normally leads to the opposite effect due to a decreased NaCl load to the macula densa and an increased sympathetic stimulation of the juxtaglomerular apparatus (Burns et al. 1993). Studies in patients with chronic kidney disease and end-stage renal disease mostly revealed unchanged levels of renin and aldosterone during treatment with rHuEPO (reviewed in Rosario & Epstein, 2006) but some studies have reported a reduction in plasma renin activity (Kokot et al. 1990; Hori et al. 1991; Yaqoob et al. 1992; Rosario & Epstein, 2006). The link between administration of rHuEPO and the renin–angiotensin–aldosterone system is interesting because the production of endogenous EPO is regulated by this system (Dunn & Donnelly, 2007). Administration of angiotensin II in humans stimulates EPO synthesis (Freudenthaler et al. 2000; Gossmann et al. 2001) and, conversely, inhibitors of angiotensin converting enzyme, and angiotensin II receptors decrease the plasma concentration of endogenous EPO (Pratt et al. 1992; Durmus et al. 2005). In patients with type-1 diabetes, an inherent high activity of the basal renin–angiotensin system (in part governed by genetic factors) was associated with higher levels of EPO compared with patients with a low activity of the basal renin–angiotensin system (Kristensen et al. 2009). Data from the present study confirm those obtained previously (Lundby et al. 2007) suggesting that rHuEPO may activate an opposite pathway so as to down-regulate the activity of the renin–angiotensin–aldosterone system independent of changes in red blood cell mass, blood volumes and blood pressure.
The present renal clearance data indicate that the rHuEPO-induced inhibition of the renin–angiotensin–aldosterone system is associated with a reduction of absolute proximal tubular reabsorption of fluid and a fall in GFR. Although a direct effect of rHuEPO on the renin producing cells in the juxtaglomerular apparatus cannot be excluded, it remains possible that plasma concentrations of renin decreased secondary to a decrease in absolute proximal reabsorption causing an increase in the end-proximal tubular delivery of sodium chloride and water to the macula densa. Changes in delivery of tubular fluid to the macula densa are well known to produce inverse changes in renin release (Schnermann & Briggs, 1986; Briggs et al. 1990; Burns et al. 1993). The decreased proximal tubular reabsorption by rHuEPO will also activate the tubuloglomerular feedback mechanism cauing a parallel decrease in GFR (Briggs & Schnermann, 1987; Holstein-Rathlou, 1991). The reduction in GFR is due to renal afferent arteriolar constriction mediated, in part, by increased NaCl uptake and production of adenosine in the macula densa cells (Donnelly, 2003). The mechanisms responsible for direct rHuEPO effects on the proximale tubule remain unknown but may involve enhanced release of renal endothelin-1 (Bode-Böger et al. 1996). In low doses, endothelin-1 may suppress proximal tubular reabsorption of sodium (Clavell et al. 1995).
In a study investigating methods to detect EPO isoforms by isoelectric focusing (IEF) in human urine, Lasne et al. (2002) provided evidence indicating that prolonged treatment with rHuEPO in a time-dependent manner renders the IEF patterns of endogenous EPO to fade away. This strongly suggests a progressive inhibition of endogenous EPO synthesis following prolonged administration of rHuEPO. Dunn & Donnelly (2007) have advanced a hypothesis by which the kidney operates as a ‘critmeter’ to sense the relative volumes of plasma and red blood cell mass and eventually regulates the EPO synthesis (and haematocrit) through the metabolic signal of renal tissue oxygen pressure (Donnelly, 2003). The hypothesis emphasizes the role of renal haemodynamics and angiotensin II in determining the balance between oxygen delivery and oxygen consumption in regions within the kidney responsible for EPO synthesis (Donnelly, 2003; Dunn & Donnelly, 2007). Thus, a decrease in filtered load by the glomeruli and a decrease in angiotensin II-mediated reabsorption of sodium will act to decrease renal oxygen consumption and increase renal oxygen partial pressure, thereby decreasing the hypoxia inducible factor-2-dependent production of EPO by interstitial fibroblast-like cells. Based on the present data, we suggest that rHuEPO by inhibiting proximal tubular reabsorption, which again results in a rapid decline in renin and aldosterone concentrations, and in GFR, may activate a feedback system that serves to down-regulate the endogenous renal synthesis of EPO in the presence of high levels of circulating rHuEPO. Tubular reabsorption of NaCl is the major oxygen-consuming process in the kidney, and the proximal tubule reabsorps approximately 70% of the filtered amount of NaCl. By acting on the proximal tubule, EPO directly reduces the major oxygen-consuming process in the kidney. In addition, inhibition of proximal reabsorption will, through the increased end-proximal delivery of NaCl to the macula densa, lead to a reduction in renin secretion and in GFR. The decreased renin secretion will decrease the angiotensin II and aldosterone-dependent reabsorptive processes in the more distal neprhon segments, and the reduced GFR will lower the filtered load, also contributing to an overall reduction in tubular reabsorption of NaCl. It is therefore to be expected that the result will be an increased oxygen tension in the renal tissue.
It has been suggested that the reduction in plasma volume induced by rHuEPO may be caused by the hyporeninaemic hypoaldosteronism leading to natriuresis (Lundby et al. 2007; Krapf & Hulter, 2009). In the present study we did not observe such an effect. In fact, the renal excretion of sodium remained unchanged throughout the study period. However, in the present study we did not perform actual sodium balance studies. It is therefore not possible to exclude that the net effect of rHuEPO was to cause a negative sodium balance during the entire 28 day treatment period. The renal sodium loss necessary to account for the observed decrease in plasma volume is small, and may easily escape detection by the present clearance protocol.
In summary, the present study for the first time demonstrates that prolonged treatment with rHuEPO in normal subjects produces a reduction of GFR and a decrease in the proximal tubular reabsorption rate. The results suggest that rHuEPO may have a direct effect on the proximal tubule leading to increased end-proximal tubular flow to the macula densa, thereby reducing renin secretion and GFR. The resulting fall in proximal reabsorption together with a reduced filtered load and a decrease in angiotensin II and aldosterone-dependent tubular reabsorption would increase oxygen tension in the environment of renal EPO-producing cells and in this way initiate an appropriate signal for down-regulation of endogenous EPO synthesis when circulating levels are high. Perhaps a similar mechanism is responsible for the rapid drop in high endogenous EPO levels observed after a short time in high-altitude hypoxia despite sustained exposure to hypoxia (Gunga et al. 2007). Further studies are warranted to explore intrarenal oxygen metabolism following administration of rHuEPO.
Acknowledgments
This study was funded by the Danish Agency for Science Technology and Innovation and Anti Doping Danmark, both obtained by C.L.
Glossary
Abbreviations
- APR
absolute proximal reabsorption
- C
clearance
- EPO
erythropoietin
- GFR
glomerular filtration rate
- IEF
isoelectric focusing
- rHuEPO
recombinant human erythropoietin
Author contributions
N.-J.A.-A., T.M.-A., A.B. and C.H. were involved in the collection, analysis and interpretation of data. N.-H.H.-R. was involved in analysis and interpretation of data and drafted parts of the manuscript. P.R. was involved in analysis and interpretation of data. N.V.O., P.O. and C.L. designed the experiments, interpretated the data and drafted the manuscript. All authors approved the final version of the manuscript.
References
- Arcasoy MO. The non-haematopoietic biological effects of erythropoietin. Br J Haematol. 2008;141:14–31. doi: 10.1111/j.1365-2141.2008.07014.x. [DOI] [PubMed] [Google Scholar]
- Bode-Böger SM, Böger RH, Kuhn M, Radermacher J, Frölich JC. Recombinant human erythropoietin enhances vasoconstrictor tone via endothelin-1 and constrictor prostanoids. Kidney Int. 1996;50:1255–1261. doi: 10.1038/ki.1996.435. [DOI] [PubMed] [Google Scholar]
- Briggs J, Skott O, Schnermann J. Cellular mechanisms within the juxtaglomerular apparatus. Am J Hypertens. 1990;3:76–80. doi: 10.1093/ajh/3.1.76. [DOI] [PubMed] [Google Scholar]
- Briggs JP, Schnermann J. The tubuloglomerular feedback mechanism: functional and biochemical aspects. Annu Rev Physiol. 1987;49:251–273. doi: 10.1146/annurev.ph.49.030187.001343. [DOI] [PubMed] [Google Scholar]
- Bröchner-Mortensen J. A simple method for the determination of glomerular filtration rate. Scand J Clin Lab Invest. 1972;30:271–274. doi: 10.3109/00365517209084290. [DOI] [PubMed] [Google Scholar]
- Burns KD, Homma T, Harris RC. The intrarenal renin-angiotensin system. Semin Nephrol. 1993;13:13–30. [PubMed] [Google Scholar]
- Calbet JAL. Chronic hypoxia increases blood pressure and noradrenaline spillover in healthy humans. J Physiol. 2003;551:379–386. doi: 10.1113/jphysiol.2003.045112. [DOI] [PMC free article] [PubMed] [Google Scholar]
- Clavell AL, Stingo AJ, Margulies KB, Brandt RR, Burnett JC., Jr Role of endothelin receptor subtypes in the in vivo regulation of renal function. Am J Physiol Renal Physiol. 1995;268:F455–460. doi: 10.1152/ajprenal.1995.268.3.F455. [DOI] [PubMed] [Google Scholar]
- Donnelly S. Why is erythropoietin made in the kidney? The kidney functions as a ‘critmeter’ to regulate the hematocrit. Adv Exp Med Biol. 2003;534:73–87. doi: 10.1007/978-1-4419-8997-0_6. [DOI] [PubMed] [Google Scholar]
- Dunn AMV, Donnelly SMM. The role of the kidney in blood volume regulation: the kidney as a regulator of the hematocrit. [Report] Am J Med Sci July. 2007;334:65–71. doi: 10.1097/MAJ.0b013e318095a4ae. [DOI] [PubMed] [Google Scholar]
- Durmus A, Dogan E, Erkoc R, Sayarlioglu H, Topal C, Dilek I. Effect of valsartan on erythropoietin and hemoglobin levels in stage III-IV chronic kidney disease patients. Int J Clin Pract. 2005;59:1001–1004. doi: 10.1111/j.1742-1241.2005.00606.x. [DOI] [PubMed] [Google Scholar]
- Erslev A. Humoral Regulation of Red Cell Production. Blood. 1953;8:349–357. [PubMed] [Google Scholar]
- Freudenthaler SM, Lucht I, Schenk T, Brink M, Gleiter CH. Dose-dependent effect of angiotensin II on human erythropoietin production. Pflügers Arch Eur J Physiol. 2000;439:838–844. doi: 10.1007/s004249900238. [DOI] [PubMed] [Google Scholar]
- Gossmann J, Burkhardt R, Harder S, Lenz T, Sedlmeyer A, Klinkhardt U, Geiger H, Scheuermann E-H. Angiotensin II infusion increases plasma erythropoietin levels via an angiotensin II type 1 receptor-dependent pathway. Kidney Int. 2001;60:83–86. doi: 10.1046/j.1523-1755.2001.00773.x. [DOI] [PubMed] [Google Scholar]
- Groth SAM. 51Cr-EDTA clearance determined by one plasma sample. Clin Physiol. 1981;1:417–425. doi: 10.1111/j.1475-097x.1981.tb00909.x. [DOI] [PubMed] [Google Scholar]
- Gunga HC, Kirsch KA, Roecker L, Kohlberg E, Tiedemann J, Steinach M, Schobersberger W. Erythropoietin regulations in humans under different environmental and experimental conditions. Respiratory Physiol Neurobiol. 2007;158:287–297. doi: 10.1016/j.resp.2007.03.006. [DOI] [PubMed] [Google Scholar]
- Hannon JP, Shields JL, Harris CW. Effects of altitude acclimatization on blood composition of women. J Appl Physiol. 1969;26:540–547. doi: 10.1152/jappl.1969.26.5.540. [DOI] [PubMed] [Google Scholar]
- Hansen J, Sander M. Sympathetic neural overactivity in healthy humans after prolonged exposure to hypobaric hypoxia. J Physiol. 2003;546:921–929. doi: 10.1113/jphysiol.2002.031765. [DOI] [PMC free article] [PubMed] [Google Scholar]
- Holstein-Rathlou NH. A closed-loop analysis of the tubuloglomerular feedback mechanism. Am J Physiol Renal Physiol. 1991;261:F880–889. doi: 10.1152/ajprenal.1991.261.5.F880. [DOI] [PubMed] [Google Scholar]
- Hori K, Iseki K, Fujimi S, Fujishima M. Hemodynamics and volume changes by recombinant human erythropoietin (rHuEPO) in teh treatment of anemic hemodialysis patients. Clin Nephol. 1991;33:293–298. [PubMed] [Google Scholar]
- Jelkmann W. Erythropoietin: structure, control of production, and function. Physiol Rev. 1992;72:449–489. doi: 10.1152/physrev.1992.72.2.449. [DOI] [PubMed] [Google Scholar]
- Kokot F, Wiecek A, Grzeszak W, Klin M. Influence of erythropoietin treatment on plasma renin activity, aldosterone, vasopressin and atrial natriuretic peptide in haemodialyzed patients. Miner Electrolyte Metab. 1990;16:25–29. [PubMed] [Google Scholar]
- Krapf R, Hulter HN. Arterial Hypertension Induced by Erythropoietin and Erythropoiesis-Stimulating Agents (ESA) Clin J Am Soc Nephrol. 2009;4:470–480. doi: 10.2215/CJN.05040908. [DOI] [PubMed] [Google Scholar]
- Kristensen PL, Høi-Hansen T, Olsen NV, Pedersen-Bjergaard U, Thorsteinsson B. Erythropoietin during hypoglycaemia in type 1 diabetes: Relation to basal renin-angiotensin system activity and cognitive function. Diab Res Clin Pract. 2009;85:75–84. doi: 10.1016/j.diabres.2009.01.008. [DOI] [PubMed] [Google Scholar]
- Lasne F, Martin L, Crepin N, de Ceaurriz J. Detection of isoelectric profiles of erythropoietin in urine: differentiation of natural and administered recombinant hormones. Anal Biochem. 2002;311:119–126. doi: 10.1016/s0003-2697(02)00407-4. [DOI] [PubMed] [Google Scholar]
- Lundby C, Achman-Andersen NJ, Thomsen JJ, Norgaard AM, Robach P. Testing for recombinant human erythropoietin in urine: problems associated with current anti-doping testing. J Appl Physiol. 2008a;105:417–419. doi: 10.1152/japplphysiol.90529.2008. [DOI] [PubMed] [Google Scholar]
- Lundby C, Hellsten Y, Jensen MBF, Munch AS, Pilegaard H. Erythropoietin receptor in human skeletal muscle and the effects of acute and long-term injections with recombinant human erythropoietin on the skeletal muscle. J Appl Physiol. 2008b;104:1154–1160. doi: 10.1152/japplphysiol.01211.2007. [DOI] [PubMed] [Google Scholar]
- Lundby C, Thomsen JJ, Boushel R, Koskolou M, Warberg J, Calbet JAL, Robach P. Erythropoietin treatment elevates haemoglobin concentration by increasing red cell volume and depressing plasma volume. J Physiol. 2007;578:309–314. doi: 10.1113/jphysiol.2006.122689. [DOI] [PMC free article] [PubMed] [Google Scholar]
- Olsen NV, Hansen JM, Kanstrup IL, Richalet JP, Leyssac PP. Renal hemodynamics, tubular function, and response to low-dose dopamine during acute hypoxia in humans. J Appl Physiol. 1993;74:2166–2173. doi: 10.1152/jappl.1993.74.5.2166. [DOI] [PubMed] [Google Scholar]
- Pratt MC, Lewis-Barned NJ, Walker RJ, Bailey RR, Shand Bl, Livesey J. Effect of angiotensin converting enzyme inhibitors on erythropoietin concentrations in healthy volunteers. Br J Clin Pharmacol. 1992;34:363–365. doi: 10.1111/j.1365-2125.1992.tb05644.x. [DOI] [PMC free article] [PubMed] [Google Scholar]
- Rasmussen P, Foged EM, Krogh-Madsen R, Nielsen J, Nielsen TR, Olsen NV, Petersen NC, Sorensen TA, Secher NH, Lundby C. Effects of erythropoietin administration on cerebral metabolism and exercise capacity in men. J Appl Physiol. 2010;109:476–483. doi: 10.1152/japplphysiol.00234.2010. [DOI] [PubMed] [Google Scholar]
- Rosario R, Epstein M. Review: Relationship between erythropoietin administration and alterations of renin-angiotensin-aldosterone. Journal of Renin-Angiotensin-Aldosterone System. 2006;7:135–138. doi: 10.3317/jraas.2006.022. [DOI] [PubMed] [Google Scholar]
- Scalera F, Kielstein JT, Martens-Lobenhoffer J, Postel SC, Tager M, Bode-Boger SM. Erythropoietin increases asymmetric dimethylarginine in endothelial cells: role of dimethylarginine dimethylaminohydrolase. J Am Soc Nephrol. 2005;16:892–898. doi: 10.1681/ASN.2004090735. [DOI] [PubMed] [Google Scholar]
- Schnermann J, Briggs J. Role of the renin-angiotensin system in tubuloglomerular feedback. Fed Proc. 1986;45:1426–1430. [PubMed] [Google Scholar]
- Sinclair AM, Coxon A, McCaffery I, Kaufman S, Paweletz K, Liu L, Busse L, Swift S, Elliott S, Begley CG. Functional erythropoietin receptor is undetectable in endothelial, cardiac, neuronal, and renal cells. Blood. 2010;115:4264–4272. doi: 10.1182/blood-2009-10-248666. [DOI] [PubMed] [Google Scholar]
- Thomsen K, Olesen OV. Renal lithium clearance as a measure of the delivery of water and sodium from the proximal tubule in humans. Am J Med Sci. 1984;288:159–161. doi: 10.1097/00000441-198411000-00002. [DOI] [PubMed] [Google Scholar]
- Wang XQ, Vaziri ND. Erythropoietin depresses nitric oxide synthase expression by human endothelial cells. Hypertension. 1999;33:894–899. doi: 10.1161/01.hyp.33.3.894. [DOI] [PubMed] [Google Scholar]
- Yaqoob M, Morris K, Bell GM, Ahmad R. Suppression of the renin-angiotensin-aldosterone axis with erythropoietin therapy by a negative feedback loop. Nephrol Dial Transplant. 1992;7:125–128. doi: 10.1093/oxfordjournals.ndt.a092081. [DOI] [PubMed] [Google Scholar]