Abstract
A new method is demonstrated to transport particles, cells, and other microorganisms using rectified ac electro-osmotic flows in open microchannels. The rectified flow is obtained by synchronous zeta potential modulation with the driving potential in the microchannel. Experiments were conducted to transport both neutral, charged particles, and microorganisms of various sizes. A maximum speed of 50 μm∕s was obtained for 8 μm polystyrene beads, without any electrolysis, using a symmetrical square waveform driving electric field of 5 V∕mm at 10 Hz and a 360 V gate potential with its polarity synchronized with the driving potential (phase lag=0°).
INTRODUCTION
The processing of biological specimens in microdevices typically involves transport of these objects precisely to different locations in the microdevice in order to perform various operations. A number of methods have been developed to transport particles and cells in closed channels using pressure-driven flow,1, 2 electrokinetics,3 electro-osmosis,4, 5, 6 electrowetting,7 and dielectrophoresis.8, 9, 10 Most of these methods are only applicable in closed microchannels, and cell transportation in open microfluidic devices is seldom reported. Open microchannels have their top side open to the ambient air and can provide advantages, such as maintaining the physiological conditions for normal cell growth and for introducing accurate amounts of chemical and biological materials. Currently, the use of optical tweezers11, 12 is the mainstream method to manipulate particles and cells in open plates and microchannels. However, it requires complex optical setups and expensive lens systems that limit their widespread use.
Rectified ac electro-osmotic flows13, 14, 15 have been used for fluid flow in closed microfluidic systems. Compared to traditional ac electro-osmosis where the flow is generated by the action of an electric field on its own induced diffuse charge near a polarizable surface and mostly operated at a frequency higher than 1 kHz, this rectified ac electro-osmotic flow is obtained by synchronization of zeta potential modulation of the walls of the microchannel with the ac axial driving voltage along the microchannel. The objective of this study was to demonstrate the use of this rectified flow to transport both neutral and charged particles of various sizes in an open microchannel. The technique that we have demonstrated here can potentially achieve the core functionality of optical tweezers in particle manipulation without its associated high cost.
WORKING PRINCIPLE
When a potential is applied across an open microchannel, the charges in the double layer induce fluid flow close to the bottom surface. The fluid motion near the bottom wall can transport particles and cells that are close to the surface through frictional drag. The flow velocity UEO near the bottom wall can be expressed by the product of electro-osmotic mobility μEO and the local electric field E as
| (1) |
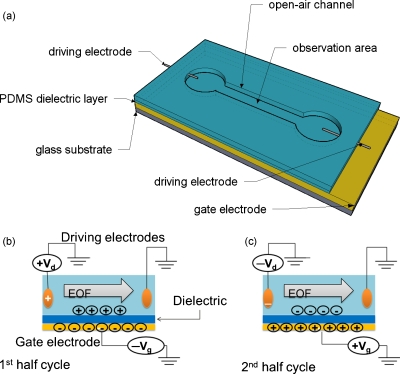
where ζ is the zeta potential, ε is the permittivity, and η is the viscosity of the working liquid. However, the application of a dc voltage in a local area can lead to gas evolution through electrolysis. Although the gases generated can be evacuated easily in open channels, they change the local pH and ionic concentrations as well as introduce convection due to the formation and release of gas bubbles. The application of an ac potential with simultaneous zeta potential modulation through a gate electrode at the walls of the microchannel has been shown to induce rectified fluid flow while avoiding gas evolution.13, 14, 15 The working principle of rectified ac electro-osmotic flow is depicted in Fig. 1. Here, a driving potential, which is a symmetric square voltage waveform (Vd), is applied along the axis of the microchannel. Another symmetric square voltage waveform, the gate potential (Vg), is applied on the gate electrode and phase synchronized with the driving voltage. The gate electrode is located at the bottom of the microchannel and is covered with a gate dielectric layer. The application of a gate potential causes accumulation of oppositely charged ions in the solution side of the gate dielectric, which changes the native charge in the double layer. The proper synchronization of the gate and driving potentials causes a simultaneous change in the axial electric field and the charge in the double layer, producing a rectified body force and thus fluid transport. This is illustrated for the case when the native zeta potential and the charge on the double layer are positive. During the first half cycle, as shown in Fig. 1b, the driving potential is positive and the gate potential is negative. The zeta potential of the walls of the microchannel close to the gate electrode is enhanced over its native state since more positive ions are attracted to the surface to balance the charges on the gate electrode. The electro-osmotic flow velocity in this half cycle is enhanced over the native state. During the second half cycle, the gate potential is positive, therefore, a lesser number of positive ions than in the native state will be attracted to the surface, which decreases the zeta potential and reduces the electro-osmotic flow velocity. When this positive gate potential is larger than a certain threshold potential, the negative counterions near the surface can be completely replaced by positive ions, which results in a positive zeta potential and reversal of electro-osmotic flow. Since the driving electric field is also reversed at this stage, the electro-osmotic flow [Eq. 1] under an alternating electric field can be rectified by this mechanism, while it would have a net-zero flow rate without the synchronization of the zeta potential modulation.
Figure 1.
Rectified electro-osmotic flow device and its mechanism. (a) Schematic of the microchannel device used. (b) Driving and gate electrode polarization during the first half cycle. The electro-osmotic flow velocity is enhanced over the native state due to the accumulation of positive ions near the surface. (c) Driving and gate electrode polarization during the second half cycle. The electro-osmotic flow is reduced or even reversed due to the accumulation of negative ions near the surface.
When the gate electrode is covered with an insulator that interacts with the solution in the microchannel, the zeta potential in the gate region can be controlled by the application of a gate potential. The insulator, the Stern, and the diffuse double layer can be represented by capacitors, as shown in Fig. 2. When a square wave ac potential is applied to the gate electrode, the influence of the gate potential on the local zeta potential can be described by16
| (2) |
where Cinsulator and Cd are the capacitance of the insulator and electric double layer, respectively, and Vg is the gate potential. Also,
The capacitance of the insulator is given by
| (3) |
where A is the surface area, dinsulator is the thickness of the insulator, and ε0 and εr are the dielectric constant of vacuum and of the solution, respectively.
Figure 2.
Three capacitor model for the zeta potential modulation at the solid∕liquid interface, where Vg is the gate potential applied on the gate electrode, Ψ0 is the surface potential, ζ is the zeta potential, and Vsol is the potential in the solution.
Multiplying Eq. 2 by ε∕η, the modified electro-osmotic mobility μEO is obtained as
| (4) |
When an ac square waveform driving potential Vd is applied along the channel length L, the flow along the bottom wall is generated by the native zeta potential of the bottom surface. The flow is propagated to the bulk fluid due to viscous drag. However, the net displacement is zero, unless the zeta potential is modulated. The net velocity ΔU induced by the zeta potential modulation can be expressed as
| (5) |
Here, the driving potential Vd has an angular frequency of ω and a phase lag of φ with respect to the gate potential. The influence of the driving potential Vd, gate potential Vg, applied frequency ω, phase lag φ, and dielectric constant ε on particle transportation in an ac rectified electro-osmotic flow in an open microchannel was experimentally determined in this study.
It should be noted that the rectified flow causes frictional drag on the particles close to the surface and enables their movement. In addition, the driving electric field will introduce electrophoretic transport of the particles themselves due to the charge present on them. However, the electrophoretic transport averages to zero for a symmetric ac driving voltage. This is clearly observed in cases where the zeta potential of the gate voltage is not modulated.
EXPERIMENTAL SETUP
The microfluidic device is fabricated using an insulating Pyrex glass substrate. A thin Cr∕Au (20 nm∕200 nm) layer is deposited on the glass substrate using e-beam evaporation and serves as the gate electrode. A thin layer of Polydimethylsiloxane (PDMS) prepolymer is spin coated on top of the Cr∕Au and thermally polymerized at 80 °C. Alternatively, silicon oxide is deposited by a chemical-vapor-deposition (CVD) process. This thin dielectric layer serves as the dielectric of a capacitor and modulates the charge on the double layer close to the bottom surface of the microchannel when a potential is applied to the gate electrode. Next, a PDMS channel (20 mm×2 mm×3 mm), open at the top and bottom, is fabricated using soft lithography processes. This channel is bonded on top of the gate electrode∕dielectric after surface activation. Two ∅250 μm platinum wires are inserted into the reservoirs of the open channel and used as driving electrodes. A schematic view of the experimental device is shown in Fig. 1a.
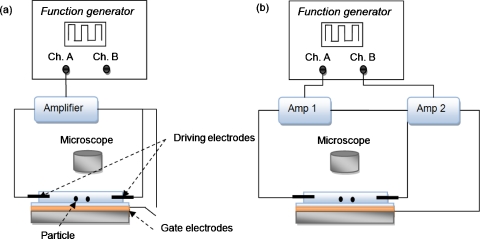
A 10 Hz symmetric ac square waveform from a function generator (Tektronix AFG3022B, Beaverton, OR) is connected to a voltage amplifier (Trek 677B, Medina, NY), as shown in Fig. 3. The driving and gate potentials were generated by amplifying the signal from a function generator, as shown in Fig. 3. The gate potential can be directly connected to one of the driving electrodes to synchronize the zeta potential modulation with the driving signal. However, this could result in an excess driving electric field (Ed) and electrolysis problems since the required gate potential to modulate charges in the double layer is much larger than the required driving potential. To avoid this problem, two separate amplifiers are used to control the driving potential Vd and gate potential Vg independently. The two outputs of the function generator are identical with an adjustable phase lag between the two channels.
Figure 3.
Experimental setup for synchronous zeta potential modulation: (a) configuration 1, where the driving and the gate potentials are coupled, and (b) configuration 2, where the driving and gate potentials are independently controlled.
Amplifier 1 (Falco Systems WMA-02, Amsterdam, The Netherlands, gain=20) is connected to driving electrodes and amplifier 2 (Trek 677B, gain=200) is connected to the gate electrodes since the required Vg is generally much larger than Vd. The gate potential is synchronized with the driving electrodes, as shown in Fig. 3b. The zeta potential is modulated as the driving potential varied, thus generating a nonzero flow rate under an alternating electric field.
The channel is filled with de-ionized (DI) water with 8 μm, 25 μm polystyrene and 11 μm, 18 μm hollow glass particles suspended in it in different experiments. When the driving signal is applied with the gate electrode disconnected and floating as shown in Fig. 3a, the particle moves back and forth and do not have a net motion since the zeta potential at the bottom surface is not modulated.
RESULTS AND DISCUSSION
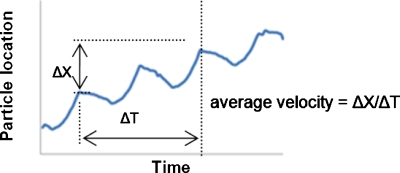
A series of experiments was performed using various particles (purchased from Kisker Biotech GmbH & Co. KG, Steinfurt, Germany) that are listed in Table 1. The transport of neutral and charged particles is demonstrated using polystyrene and glass beads. The effect of particle size on the particle transport was investigated using different sized particles. Particle movements are observed and recorded at 30 frames∕s under a microscope with a frame resolution of 1024×768. Each frame is then analyzed in IMAGEJ® software to measure the particle displacement. Since the frame rate is lower than the applied frequency, it was not possible to obtain the instantaneous velocity of the particle. Figure 4 shows the schematic of particle location versus time. The average velocity can be obtained from ΔX and ΔT over certain cycles that depend on the applied frequency and used in the study to represent the particle velocity in the following figures.
Table 1.
Material information of the various particles.
| Product | Size (μm) | Material | Density (g∕cm3) |
|---|---|---|---|
| PPs-8.0, Kisker | 8 | Polystyrene | 1.04 |
| PPs-25.0, Kisker | 25 | Polystyrene | 1.04 |
| PBGH-11, Kisker | 11 | Hollow glass | 1.1 |
| PBGH-18, Kisker | 18 | Hollow glass | 0.6 |
Figure 4.
Schematic of particle location vs time.
Effect of dielectric layer
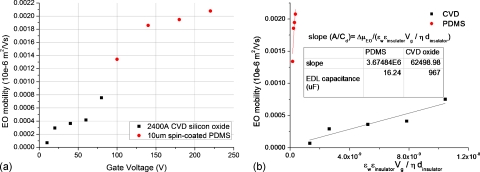
Since the gate electrode, the insulator, and the double layer form a capacitor, a dielectric layer with thinner thickness dinsulator, higher dielectric constant εr, and lower diffuse double layer capacitance Cd is preferable in terms of the effectiveness of the gate potential in inducing zeta potential modulation, as seen in Eqs. 3, 4. The effect of the dielectric layer was studied by comparing two different dielectric layers: CVD silicon oxide film (εr=5) and spin-coated PDMS film (εr=2.5). The CVD silicon oxide is grown on top of the gate electrodes under the conditions of SiH4=90 sccm (sccm denoted cubic centimeter per minute at STP), N2O=70 sccm, power=50 W, pressure=650 mT, temperature=300 °C, and duration=4 min in Technics Micro-PD series 900 chamber, resulting in an oxide film of 2400 Å thick. The spin-coated PDMS is prepared by mixing a 10:1 ratio of PDMS prepolymer∕curing agent (Sylgard 184, Dow Corning, Midland, MI) mixture with hexane (3:1 weight ratio). The mixture is dispensed on top of the gate electrode and spun at 7000 rpm for 30 s, resulting in a PDMS film of 12 μm thick.17 After that, the PDMS film is cured at 85 °C for 4 min. Since the CVD silicon oxide has a higher dielectric constant and is thinner, the CVD film can generate rectified ac electro-osmotic flow and subsequent particle movement at lower gate voltages (as low as 10 V), as shown in Fig. 5a. However, the CVD oxide film breaks down at higher voltages probably due to pinholes. In the case of the spin-coated PDMS insulator, there is no observable particle movement when Vg is less than 100 V. However, it was able to withstand higher gate voltages and produced particle movement above 100 V [Fig. 5a]. In order to obtain the double layer capacitance of the oxide and the PDMS surfaces, Fig. 5a is rearranged according to Eq. 4 and is shown in Fig. 5b. The slope of the curve then represents the inverse of the diffuse double layer capacitance density A∕Cd. Therefore, the capacitances Cd for the interfaces of DI water∕PDMS and DI water∕CVD oxide can be obtained as 16.24 and 967 μF, respectively. These parameters were then used to obtain the theoretical fluid flow velocity in subsequent experiments. Furthermore, due to its better breakdown properties, spin-coated PDMS was chosen as the gate dielectric in the following experiments.
Figure 5.
The effect of the dielectric layer material on the electro-osmotic mobility. (a) Variation of electro-osmotic mobility with the change in the gate voltage for 2400 Å CVD oxide and 12 μm spin-coated PDMS. (b) Plot of mobility vs coefficient of A∕Cd in Eq. 4. The double layer capacitance Cd is estimated from the slope of the curve.
Effect of driving electric field Ed and gate potential Vg
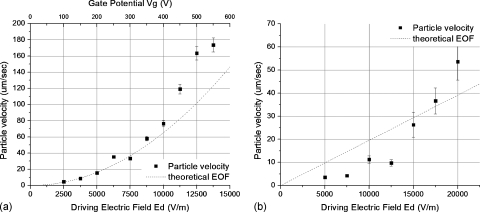
The variation of the velocity of 8 μm polystyrene particles with the driving potential for a symmetric square signal with a frequency of 10 Hz, phase lag of 0°, is shown in Fig. 6a. The gate potential Vg in this case is equal to the driving potential Vd since they are simply connected together, as shown in Fig. 3a. The driving potential was varied from 0 to 600 V. The trend line in Fig. 6a shows that the velocity of the particles increases with the driving electric field in a quadratic manner, consistent with Eq. 5 when Vg=Vd. It can be seen that the particle velocity is closer to the fluid velocity, as indicated by the trend line, at low speeds and voltages. At higher operating conditions and speed there is deviation. This could be due to the inertial effect of the large particles, which cause them to overshoot as the fluid velocity changes direction. Since the velocity that the particles achieve during the positive and negative half cycles are different, it could lead to a higher rectified velocity.
Figure 6.
The effect of the driving electric field on the velocity of a 8 μm polystyrene particle. Variation of the particle velocity with the change in the driving electric field in (a) configuration 1, where the driving and the gate potentials are coupled, the frequency is 10 Hz and (b) configuration 2, where the driving and gate potentials are independently controlled, the frequency is 10 Hz, and the gate potential is 100 V. The theoretical velocity of the fluid flow is shown as the dotted line.
Although this configuration is simpler to implement, it does not allow independent optimization of the driving and gate signals. For example, it is desired to have a low driving voltage when transporting biological specimens in the fluidic channel while using a higher gate voltage to achieve a higher velocity. In another configuration, two amplifiers are used to control Vd and Vg individually but with polarity of the signals synchronized, as shown in Fig. 3b. The variation in the velocity as the electric field Ed changes from 0 to 20 000 V∕m with the gate potential Vg fixed at 100 V is shown in Fig. 6b. The particle velocity is lower here compared to the previous case since the gate voltage Vg is lower compared to the setup in Fig. 6a. Once again we see deviations of the particle velocity from the fluid velocity above 50 μm∕s.
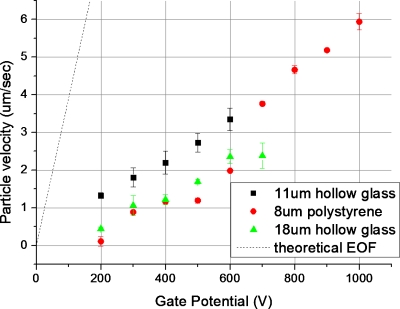
We also performed experiments where the driving voltage and its frequency were fixed and the gate potential is varied. This configuration might be more suitable for biological specimens. The velocity obtained by applying various gate potentials is plotted in Fig. 7. Here, the frequency and amplitude of driving electric field were fixed at 10 Hz and 2.5×10³ V∕m. Three different particles were tested: 8 μm polystyrene and 11 and 18 μm hollow glass particles. For all three cases, the particle velocity increases with an increase in the amplitude of the gate potential. The effectiveness of the gate potential can be defined as particle velocity divided by gate voltage (slope in Fig. 7), that is, 7.42×10⁻³ μm∕V s for 8 μm polystyrene particle, 4.84×10⁻³ μm∕V s for 11 μm hollow glass particle, and 4.23×10⁻³ μm∕V s for 18 μm hollow glass particle. The 8 μm polystyrene particle has the highest effectiveness since its size is the smallest. It also shows that the particle velocity can be controlled independently by Vg while maintaining a relatively low Vd to avoid electrolysis problems as well as damage to biological specimen. Furthermore, it can be seen that the size and weight of the particles affect the particle transportation speed by 43%, by comparing 11 and 18 μm hollow glass particles. Finally, the lower velocities obtained cause significant deviation of the particle velocity from the fluid velocity.
Figure 7.
Variation of the particle velocity with the change in gate potential for 8 μm polystyrene and 11 and 18 μm hollow glass particles when the driving electric field and frequency are kept at 2.5 kV/m and 10 Hz, respectively. The theoretical velocity of the fluid flow is shown as the dotted line.
Effect of applied frequency f and phase lag ϕ
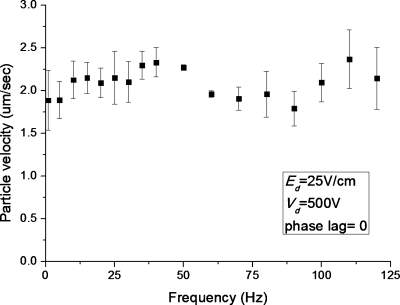
The effect of applied frequency was studied using an ac square signal with Vg=500 V, Ed=2500 V∕m, phase lag φ=0°, and varying the frequency from 0 to 120 Hz for the 25 μm polystyrene particles. The range of frequency was limited by the performance of the amplifiers. As shown in Fig. 8, there is no obvious trend for particle velocity with the applied frequency. The variation of the particle velocity is within ±6.5% of the average velocity over the entire frequency range. This suggests that a higher frequency can be chosen to avoid electrolysis issues at the driving electrodes without an adverse effect on the particle transport speed. However, this is only valid within certain frequency range. The electro-osmotic flow depends on the electric double layer (EDL) built up at the channel wall, and this EDL essentially acts like a capacitor. This particular charging mechanism is typically referred to as capacitive charging. Therefore, as the applied frequency approaches the inverse of RC time constant, the charging effect in electric double layer becomes dominant, and this imposes a limitation on the applicable frequency.
Figure 8.
Variation of particle velocity with the change in frequency for a 8 μm polystyrene particle when the driving electric field and gate potential are kept at 2.5 kV∕m and 500 V, respectively.
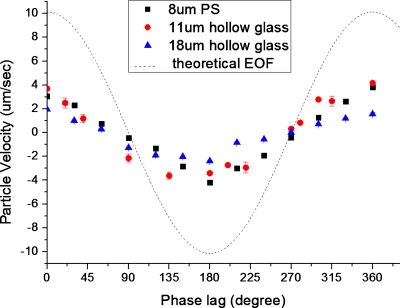
The phase lag was varied from 0° to 360°, while Vd, Vg, and frequency were maintained at 100 V, 700 V, and 10 Hz, respectively. When the phase lag is equal to 0° and 360°, z(ωt)⋅z(ωt+φ)=z2(ωt) and the particle velocities will be the highest. When the phase lag approaches 90° and 270°, the flow stops and the particles can no longer be transported. Finally, when phase lag is 180°, z(ωt)⋅z(ωt+φ)=−z2(ωt) and the particle velocity is the lowest. This behavior is clearly observed in the experimental data shown in Fig. 9. There was no time delay between the particle velocity and the applied signal when the phase lag changed from 0° to 360°. Also, we can see that the size and weight of particle affect the velocity by comparing the results of 11 and 18 μm hollow glass particles.
Figure 9.
Variation of particle velocity with the change in phase lag between the driving and gate voltage for a 8 μm polystyrene and 11 and 18 μm hollow glass particles when the driving electric field and gate signals are kept at 2.5 kV/m and 700 V, respectively. The theoretical velocity of the fluid flow is shown as the dotted line.
Transportation of cells
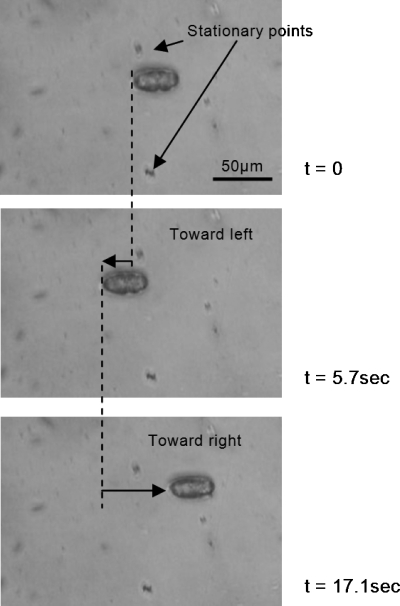
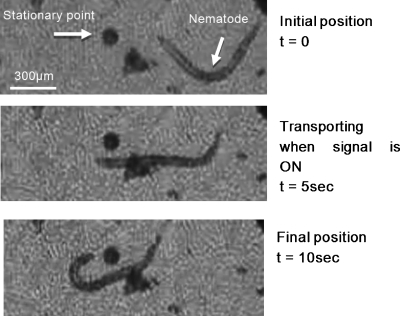
Tests were performed to investigate the transport of biological specimens such as embryos and nematode Caenorhabditis elegans (C. elegans). The size of the embryos is ∼40 μm in length and ∼25 μm in diameter, while the length of the nematode is around 1 mm. The transport of embryo for a 10 Hz signal with square waveform, ±15 V∕cm driving electric field, and ±400 V gate potential for different phase lag is shown in Fig. 10. A low driving potential and high gate potential is chosen to avoid Joule heating and excessive electric current passing the solution as only the driving electrodes are physically in contact with the solution. Initially, the embryo is at rest, then it starts to move toward the left when the signal above with φ=0° is applied. When t=5.7 s, the phase is switched to φ=180° and the embryo turns over and begins to move toward the right until t=17.1 s. The embryo subsequently developed into a viable nematode worm, demonstrating that the driving signal applied was benign. We also transported adult nematodes using the same mechanism. Images showing the position of a nematode being transported under a 3 Hz square signal with Ed=±100 V∕cm and Vg=±200 V are shown in Fig. 11. During the transportation when Ed and Vg are turned ON, the nematode is momentarily paralyzed due to the electric field across the channel, as shown in the second photo in Fig. 11. These conditions were chosen to demonstrate the motion of the nematode due to the rectified flow alone while eliminating the normal motion of the organism by temporary paralysis. Subsequent observations also revealed that the nematodes quickly recovered their movement and were viable. It should be noted that the electric field required to cause significant damage such as in the case of electroporation is usually around 1 kV∕cm. The driving electric fields used in this study were significantly lower than that. This technique allows the flexibility of reducing the driving signal while increasing the gate signal to achieve a higher velocity for transportation.
Figure 10.
Sequence of images demonstrating the positioning of an embryo by control of phase lag. The embryo is moved toward the left when the phase lag ϕ=0° from t=0 to 5.7 s; toward the right when the phase lag ϕ=180° from t=5.7 to 17.1 s. The frequency is 10 Hz, the driving electric field is 15 V∕cm, and the gate potential is 400 V.
Figure 11.
Transportation of nematode by applying a 3 Hz square signal with 100 V∕cm driving electric field and 200 V gate potential. The nematode is being transported and momentarily paralyzed (straighten body) from t=0 to 10 s when the applied signal is turned on. After the signal is turned off, at t=10 s, the nematode recovered and started to swim by itself.
CONCLUSIONS
Particles and biological specimens, such as embryos and nematodes, were successfully transported in a microfluidic open channel using rectified electro-osmotic flow. The effects of dielectric layer, driving electric field, gate potential, applied frequency, and phase lag between the driving and gate signals on the particle velocities were determined. Each parameter can be used independently to control the transportation of the particles. Our work shows that both driving electric field and gate potential can increase the particle velocity efficiently. The experimental results also suggest a higher frequency can be chosen to avoid electrolysis without an adverse effect on the particle velocity. Besides, the phase lag between driving and gate potentials can be used to modulate the particle velocity and even reverse the particle movement without changing other parameters, which could be beneficial in precise positioning. The benefits of such device can be a low-cost alternative to optical tweezers in certain applications.
References
- Telleman P., Larsen U., Philip J., Blankenstein G., and Wolff A., Micrototal Analysis Systems ‘98: Proceedings of the micro-TAS ‘98 Workshop, 13–16 October 1998, p. 39.
- Blankenstein G. and Darling Larsen U., Biosens. Bioelectron. 13, 427 (1998). 10.1016/S0956-5663(97)00109-7 [DOI] [Google Scholar]
- McClain M. A., Culbertson C. T., Jacobson S. C., and Ramsey J. M., Anal. Chem. 73, 5334 (2001). 10.1021/ac010504v [DOI] [PubMed] [Google Scholar]
- Ajdari A., Appl. Phys. A: Mater. Sci. Process. 75, 271 (2002). 10.1007/s003390201329 [DOI] [Google Scholar]
- Fu A. Y., Spence C., Scherer A., Arnold F. H., and Quake S. R., Nat. Biotechnol. 17, 1109 (1999). 10.1038/15095 [DOI] [PubMed] [Google Scholar]
- Li P. C. H. and Harrison D. J., Anal. Chem. 69, 1564 (1997). 10.1021/ac9606564 [DOI] [PubMed] [Google Scholar]
- Walker S. and Shapiro B., Lab Chip 5, 1404 (2005). 10.1039/b513373b [DOI] [PubMed] [Google Scholar]
- Fiedler S., Shirley S. G., Schnelle T., and Fuhr G., Anal. Chem. 70, 1909 (1998). 10.1021/ac971063b [DOI] [PubMed] [Google Scholar]
- Voldman J., Gray M. L., Toner M., and Schmidt M. A., Anal. Chem. 74, 3984 (2002). 10.1021/ac0256235 [DOI] [PubMed] [Google Scholar]
- Müller T., Gradl G., Howitz S., Shirley S., Schnelle T., and Fuhr G., Biosens. Bioelectron. 14, 247 (1999). 10.1016/S0956-5663(99)00006-8 [DOI] [Google Scholar]
- Leach J., Mushfique H., Leonardo R., Padgett M., and Cooper J., Lab Chip 6, 735 (2006). 10.1039/b601886f [DOI] [PubMed] [Google Scholar]
- Enger J., Goksör M., Ramser K., Hagberg P., and Hanstorp D., Lab Chip 4, 196 (2004). 10.1039/b307960k [DOI] [PubMed] [Google Scholar]
- van der Wouden E. J., Liang D., Hermes D. C., Gardeniers J. G. E., and van den Berg A., Proceedings of the 19th IEEE International Conference on Micro Electro Mechanical Systems, 2006, pp. 510–513.
- Muthu S., Svec F., Mastrangelo C. H., Frechet J. M. J., and Gianchandani Y. B., Proceedings of the 17th IEEE International Conference on Micro Electro Mechanical Systems, 2004, pp. 850–853.
- Wu W., Selvaganapathy P. R., and Ching C. Y., Proceedings of The Fifth International Conference on Microtechnologies in Medicine and Biology, 2009, pp. 68–69.
- Lee C. S., McManigill D., Wu C. T., and Patel B., Anal. Chem. 63, 1519 (1991). 10.1021/ac00015a005 [DOI] [Google Scholar]
- Li N., Hsu C.-H., and Folch A., Electrophoresis 26, 3758 (2005). 10.1002/elps.200500171 [DOI] [PMC free article] [PubMed] [Google Scholar]


