

Abstract
Class VI β-tubulin (β6) is the most divergent tubulin produced in mammals and is found only in platelets and mature megakaryocytes. To determine how this unique tubulin isotype affects microtubule assembly and organization, we expressed the cDNA in tissue culture cells under the control of a tetracycline regulated promoter. The β6 coassembled with other endogenous β-tubulin isotypes into a normal microtubule array; but once the cells entered mitosis it caused extensive fragmentation of the microtubules, disrupted the formation of the spindle apparatus, and allowed entry into G1 phase without cytokinesis to produce large multinucleated cells. The microtubule fragments persisted into subsequent cell cycles and accumulated around the membrane in a marginal band-like appearance. The persistence of the fragments could be traced to a pronounced suppression of microtubule dynamic instability. Impairment of centrosomal nucleation also contributed to the loss of a normal microtubule cytoskeleton. Incorporation of β6 allowed microtubules to resist the effects of colcemid and maytansine, but not vinblastine or paclitaxel; however, cellular resistance to colcemid or maytansine did not occur because expression of β6 prevented cell division. The results indicate that many of the morphological features of megakaryocyte differentiation can be recapitulated in non-hematopoietic cells by β6 expression and they provide a mechanistic basis for understanding these changes.
Keywords: β6-tubulin, dynamic instability, paclitaxel, marginal band, platelet formation, multinucleation
Introduction
Microtubules are essential cytoskeletal organelles involved in maintaining cell shape, organizing the Golgi apparatus and endoplasmic reticulum, transporting vesicles, and forming the mitotic spindle apparatus. They assemble from heterodimers of α- and β-tubulin that interact longitudinally to form protofilaments and laterally to form hollow tubes. In vertebrates, α- and β-tubulin are each encoded by 6-7 member multigene families that produce highly homologous proteins [Sullivan, 1988]. The β-tubulins are less well conserved than α-tubulins and differ at a number of internal residues in addition to their diverse C-terminal 15 amino acids. These distinctive C-terminal tails are highly conserved across vertebrate species and have been used to define specific isotypes of the protein [Lopata and Cleveland, 1987]. Mammals express 7 β-tubulin isotypes abbreviated here as β1, β2, β3, β4a, β4b, β5, and β6. These isotypes can be categorized into two groups: a relatively conserved group (β1, β2, β4a, β4b) whose members share more than 96% identity in their amino acid sequences, and a more divergent group (β3, β5, β6) whose sequences can differ by as much as 20%. In addition to sequence differences, β-tubulins differ in their tissue distributions [Luduena, 1998; Sullivan, 1988]. Some, like β1, β4b, and β5, are found in most tissues; whereas expression of the others is tissue restricted (e.g. β3 and β4a in neurons). Because of their distinctive yet conserved C-terminal tails and their nonuniform tissue distributions, it has long been suspected that β-tubulin isotypes may allow microtubules to serve different functions [Fulton and Simpson, 1976].
The most divergent β-tubulin isotype is β6 which differs from the widely expressed β1 in about 20% of its amino acids. The expression of β6-tubulin is restricted to hematopoetic tissues: megakaryocytes and platelets in mammals [Wang et al., 1986], but also erythrocytes and thrombocytes in avian species [Murphy et al., 1987; Murphy et al., 1986]. The expression of β6 is induced during megakaryocyte differentiation and is concurrent with the production of platelets whose discoid shape is maintained by a circumferential ring of microtubules called the marginal band [Lecine et al., 2000]. Despite its unusual tissue distribution and localization to the platelet membrane, early transfections of β6 cDNA into tissue culture cells indicated that the protein coassembled with other existing isotypes and had no obvious effects on microtubule organization [Joshi et al., 1987; Lewis et al., 1987]. As part of ongoing efforts in our laboratory to define functional differences among the various β-tubulin isotypes, we re-examined the effects of tetracycline-regulated β6 expression in Chinese hamster ovary (CHO) cells. Microtubules in CHO cells are composed of 70% β1, 25% β4b, and 5% β5 [Ahmad et al., 1991; Sawada and Cabral, 1989]. As is the case with most cultured cell lines, there is no evidence for the production of β6. Here we demonstrate that ectopic expression of β6 has profound effects on microtubule assembly and organization that result in a loss of cell division.
Materials and Methods
Plasmids and Antibodies
Human β6 (GenBank™ accession no. BC033679; ATCC no. MGC-44928) and CHO β1 (GenBank™ accession no. U08342) cDNAs were cloned into a tetracycline-regulated expression vector pTOPneo [Gonzalez-Garay et al., 1999]. CHO β1 was fused to a hemagglutinin antigen (HA) epitope at its C-terminal end to allow its detection amid the other cellular tubulin proteins. The plasmids were sequenced to ensure that no mutations were introduced during molecular engineering. Expression vectors for EGFP-MAP4 [Olson et al., 1995] (Dr. Joanna Olmsted, University of Rochester) and EB1-GFP [Piehl and Cassimeris, 2003] (Addgene, Cambridge, MA) were also used.
Antibodies used in these studies included mouse monoclonal antibodies DM1A (Sigma) against α-tubulin, 18D6 that recognizes the N-terminal end of all β-tubulin isotypes [Theodorakis and Cleveland, 1992], 6-11B-1 against acetylated α-tubulin (GeneTex, Irvine, CA), C4 against actin (Chemicon, Temecula, CA), GTU-88 against γ-tubulin (Sigma), and D8 against a β6 C-terminal peptide corresponding to the human sequence (Dr. Anthony Frankfurter, University of Virginia). A rabbit antibody against α-tubulin (Dr. Jeanette Bulinski, Columbia University) was also used in some experiments. Secondary goat antimouse and antirabbit IgGs tagged with Alexa-488, Alexa-594 and Alexa-647 were from Invitrogen.
Transfection and Selection of Stable Cell Lines
CHO/tTA cells, that express a tetracycline-regulated transactivator [Gonzalez-Garay et al., 1999], were maintained in alpha modification of minimum essential medium (αMEM; Sigma-Aldrich Co., St. Louis, MO), supplemented with 5% fetal bovine serum (Gemini Bio-Products, West Sacramento, CA), 50 U/ml penicillin, and 50 μg/ml streptomycin (Invitrogen Life Technologies, Carlsbad, CA). Transfections were carried out using Lipofectamine reagent (Invitrogen) according to the manufacturer’s instructions. Cells were trypsinized and seeded in αMEM with 1 μg/ml tetracycline (Sigma-Aldrich) and 2 mg/ml G418 (Invitrogen) for the selection of stable cell lines. After about 7 d, individual G418-resistant colonies were isolated and maintained in αMEM containing G418 and tetracycline to repress the expression of the ectopic protein until analysis.
Electrophoresis and Quantification of Tubulin
Cells grown in 24-well dishes were lysed in 1% SDS. The proteins were precipitated with 5 volumes of acetone, dissolved in SDS sample buffer (0.0625 Tris-HCl, pH 6.8, 2.5% SDS, 5% 2-mercaptoethanol, 10% glycerol), resolved on polyacrylamide minigels (Bio-Rad, Hercules, CA) and transferred onto nitrocellulose membranes (Schleicher & Schuell, Keene, NH). Tubulin was probed on these western blots with 1:2,000 dilutions of 18D6 to detect all isoforms of the protein, or 6-11B-1 specific for acetylated α-tubulin. Antibody C4 to actin was included at a 1:40,000 dilution to act as a loading control. Reacting bands were visualized by reaction with a 1:2,000 dilution of Alexa 647-conjugated goat antimouse IgG (Invitrogen). Bands were imaged and quantified by capturing fluorescence emission with a STORM 860 scanner (Molecular Dynamics Inc., Sunnyvale, CA). Relative levels of acetylated tubulin between cell lines was determined by comparing their ratios of acetylated α-tubulin to actin.
Immunofluorescence
Cells grown on sterile glass coverslips were pre-extracted in microtubule stabilizing buffer (MTB) (20 mM Tris-HCl, pH 6.8, 1 mM MgCl2, 2 mM EGTA, 0.5% Triton X-100) containing 4 μg/ml paclitaxel (Cytoskeleton Inc., Denver, CO) for 90 s at 4 °C and then fixed in cold methanol at −20 °C for at least 20 min. The fixed cells were rehydrated in PBS for 15 min and incubated in primary antibodies for 1 h at 37 °C in a humid box. The coverslips were washed in PBS and then incubated for 45 min with secondary antibodies and 1 μg/ml DAPI. After washing in PBS, the coverslips were inverted onto 5 μl of Gel/Mount (BioMeda Corp., Foster City, CA) and examined using an Optiphot microscope equipped with a Plan Apochromat 60×, 1.4 numerical aperture oil objective (Nikon Inc., Melville, NY). Images were acquired using a MagnaFire digital camera (Optronics, Goleta, CA).
Time-Lapse Microscopy and Analysis of Microtubule Dynamics
Cells were transfected with a plasmid containing EGFP-MAP4 cDNA to visualize the microtubule network or EB1-GFP to examine microtubule nucleation. At 24 h post-transfection, cells were imaged using a DeltaVision Core equipped with a 100× 1.4 NA oil objective (Applied Precision LLC., Issaquah, WA). The stage was enclosed in an environmental chamber and maintained at 36.5 ±0.5 °C. Up to 50 images were acquired at 5 s intervals using a Roper RTE camera (Applied Precision LLC) driven by SoftWoRx Suite software, using 0.5 to 1 s exposure times and 1 × 1 bin. During observation, cells were incubated in modified McCoy’s 5A medium (Mediatech, Inc., Herndon, VA) containing 25 mM HEPES and 10% fetal bovine serum.
Microtubule lengths were measured using Image J software and plotted as a function of time. Approximately 30 microtubules from six different cells were analyzed. Microtubule growth and shortening rates were determined by linear regression. Changes in length that were ≥ 0.5 μm between two time points were considered as true growth or shortening. Changes < 0.5 μm were considered to be thermal movements. Dynamicity was calculated as the sum of changes in length (growth and shortening) divided by the total observation time. The catastrophe frequency for individual microtubules was determined by dividing the number of catastrophe events (transitions from pause or growth to shortening) per microtubule by the total time spent in growth or pause. The rescue frequency was determined by dividing the number of rescues (transitions from shortening to growth or pause) by the total time spent shortening. Only microtubules that were visible for ≥ 2 min were included in this analysis.
Statistics
Experiments were carried out in triplicate and repeated at least 3 times. Results are reported as the Mean ± SEM. Data were analyzed by Student t-test. P< 0.05 was considered statistically significant.
Results
Isolation of Stable Cell Lines Expressing β6-Tubulin
G418 resistant clones of CHO cells transfected with human β6-tubulin cDNA were screened by immunofluorescence with a β6-specific antibody to identify those that had good uniformity of staining and whose expression of β6 could be regulated by the presence of tetracycline. The level of β6 production was determined by western blot analysis using an antibody directed against the amino terminus that recognizes all the different β-tubulin isotypes [Theodorakis and Cleveland, 1992]. Tubulin production in the clones chosen for further analysis are shown in Fig. 1. Despite having more amino acids, β6 migrated more rapidly on SDS gels allowing its protein level to be compared to endogenous isotypes using a single antibody. The β6-tubulin was undetectable in all four clones grown in the presence of tetracycline but accounted for about 20-90% of total β-tubulin when tetracycline was withdrawn for 24 h.
Fig. 1. Expression of β6-tubulin.
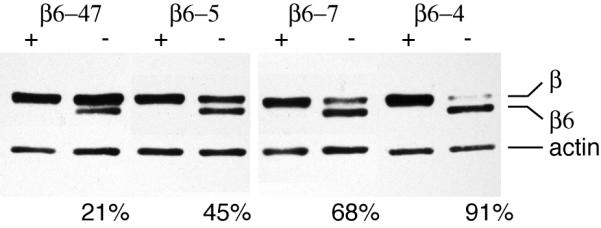
Clonal lines, derived from CHO cells transfected with human β6-tubulin cDNA in a tetracycline (tet)-regulated vector, were incubated in the presence (+) or absence (−) of tet for 24 h and then examined by western blots stained with an N-terminal antibody that recognizes both ectopic β6-tubulin (β6) and other endogenous isoforms of β-tubulin (β). The blot was also stained for actin as a loading control. Note that tet inhibited the expression of ectopic β6-tubulin. The numbers at the bottom of four lanes indicate the percentage of total β-tubulin contributed by β6 expression.
Microtubule organization is disrupted by β6 production
Expression of β6-tubulin produced dose-dependent changes in microtubule organization that differed from changes seen with any other tubulin isotype we have examined. Compared to wild-type nontransfected cells (Fig. 2A), microtubules in clones β6-47 (Fig. 2B) and β6-5 (not shown) appeared to be more curved than normal within 24 h of inducing β6 expression. At the higher level of β6-tubulin expression in Clone β6-7 (68%), many cells exhibited microtubule fragments that were often seen to bundle at the cell periphery (arrows, Fig. 2C). These bundles became especially prominent in Clone β6-4 (91% expression) where they formed a marginal band-like structure around the plasma membrane similar in appearance to the marginal band characteristic of platelets that also express β6-tubulin as their predominant isotype (Fig. 2D). The results suggest that the expression of β6 in megakaryocytes may be one of the major driving forces for the formation of platelet marginal bands. After 4 d of expression, microtubules in the majority of cells had reorganized into short bundles at the plasma membrane even in the two cell lines (β6-47 and β6-7) with only low to moderate levels of β6 expression (Fig. 2E, F). We occasionally also saw cells with β6-tubulin aggregates but no cytoplasmic microtubules (arrow, Fig. 2F) that potentially could represent cells with even higher levels of β6 expression. Similar peripheral microtubule bundles were also seen in HeLa and HEK cells transiently transfected with the β6 cDNA (Supporting Information Fig. S1).
Fig. 2. Tubulin immunofluorescence in cells expressing β6.

Nontransfected wild-type (WT) CHO cells and stably transfected clones expressing β6 tubulin, as labeled in the panels, were pre-extracted with microtubule stabilizing buffer, fixed, and then stained with an antibody to α-tubulin. For the cells in panels A and B, their corresponding nuclear staining is also shown (A’ and B’). Before fixation, the transfected cells were induced to express β6 by incubating without tetracycline (Tet) for 1 or 4 d as indicated on the figure. Arrows in panel C point to microtubule bundles near the cell periphery. The arrow in panel F points to a cell with tubulin aggregates but no microtubule cytoskeleton. Bar = 50 μm.
Expression of β6-Tubulin Interferes With Mitotic Spindle Assembly and Blocks Cells in Prometaphase
In addition to the changes produced in the microtubule cytoskeleton, even the relatively low production of β6 in clone β6-47 caused the cells to become multinucleated (Fig. 2 B’). A number of cell lines such as CHO do not trigger the onset of apoptosis that normally follows a prolonged mitotic block. Instead, disruption of spindle function by drugs or mutations causes a delay in mitosis but the cells ultimately proceed to G1 phase without dividing and form irregular nuclear membranes around the scattered chromosomes [Abraham et al., 1983; Cabral and Barlow, 1991; Kung et al., 1990]. Thus, the multinucleation seen in β6 expressing cells indicated that they had experienced problems in mitosis. A comparison of wild-type and β6-containing spindles (Clone β6-7) is shown in Fig. 3 A. Whereas wild-type CHO cells displayed all the normal stages of mitosis, expression of β6 caused the cells to accumulate in a prometaphase-like state with asters of microtubules at the spindle poles and disorganized chromosomes. The β6 expressing cells also had unusual γ-tubulin staining at prometaphase that we cannot currently explain. Concomitant with these changes, there was an increase in the mitotic index (Fig. 3 B) and a decrease in metaphase, anaphase, and telophase spindles (Fig. 3 C). Thus, β6 expression, like drug treatment or mutant tubulin expression, caused cells to arrest in prometaphase.
Fig. 3. Effects of β6 on mitosis.

A: Tubulin immunofluorescence of CHO and β6-7 cells 24 h after removing tetracycline. Note that α-tubulin is green, γ-tubulin is white, and DNA is red in the merged pictures. Expression of β6 caused the cells to block in mitosis, leading to an increase in the mitotic index (B), and to accumulate predominantly in prometaphase (C). Unlike wild-type (WT) CHO cells, β6-7 cells exhibited extensive microtubule fragmentation in prophase (D). Arrows in panel D indicate the location of the spindle poles. Bars = 10 μm.
Although it is not obvious in Fig. 3A, β6 expressing cells had many microtubule fragments once they entered mitosis. To determine when these fragments were being formed, cells were partially synchronized using an overnight thymidine block at the same time that β6 expression was induced. During this time, the cells were found to have normal appearing microtubules with little evidence for fragments. After release from the thymidine block, the microtubules continued to appear normal until the two spindle poles (arrows, Fig. 3D) began to move apart during prophase. At this stage, wild-type cells continued to have long intact microtubules, but β6 expressing cells exhibited a large number of microtubule fragments (Fig. 3D). As will be discussed below, β6-containing fragments are very stable; they could be seen throughout mitosis (Supporting Information Fig. S2) and into the next G1 phase. Using live cell time lapse microscopy, we did not find evidence for additional fragment formation during interphase. Thus, the microtubule fragments seen in interphase cells appeared to arise from a cell cycle regulated process in mitosis that began during prophase.
Expression of β6-Tubulin Increases Microtubule Acetylation
Platelet marginal bands are resistant to depolymerization by nocodazole whereas microtubules in hematopoietic cells at an early developmental stage remain sensitive to the drug [Kim et al., 1987], suggesting that marginal band microtubules have increased stability. To test whether β6-tubulin incorporation might contribute to this increased stability, we examined the level of microtubule acetylation in cells with and without β6-tubulin overexpression. Acetylation of α-tubulin is specific for polymerized tubulin and increases with time; it is therefore generally regarded as an indicator of microtubule longevity and stability [Wloga and Gaertig, 2010]. Although there was some cell-to-cell variability in staining due differences in β6 expression and other factors, fluorescence microscopy with an antibody specific for acetylated α-tubulin clearly showed that β6 expressing cells (Fig. 4B) had more heavily acetylated microtubules than cells transfected with HAβ1-tubulin, an abundant and ubiquitously expressed isotype (Fig. 4A). Both the HAβ1 cell line [Yang and Cabral, 2007] and Clone β6-7 had high levels of ectopic β-tubulin overexpression (Fig. 4C) making it unlikely that the increased tubulin acetylation observed in the latter cell line might be due to a reduction in endogenous isoforms. Microtubule fragments were also highly acetylated, suggesting that these fragments are stable as well. To obtain a more quantitative and objective measure of microtubule acetylation, the same cell lines were examined by western blot analysis (Fig. 4C). The results indicated that β6 expression caused a 2.7-fold increase in the amount of acetylated α-tubulin but no increase in the total α-tubulin content of the cells (Fig. 4D). Interestingly, the increase in acetylated α-tubulin reached a plateau as early as 12 h after induction, a time at which the production of β6 was still relatively low (see Fig. 4C). It thus appears that even low amounts of β6 are capable of causing a large increase in microtubule stability.
Fig. 4. Effects of β6 on microtubule acetylation.

A stable CHO cell line expressing HAβ1-tubulin (A) and clone β6-7 (B) were induced for 12, 24, 36, and 48 h by removing tetracycline. Cells were stained with antibodies against α-tubulin and acetylated α-tubulin for immunofluorescence (A and B) and lysed for western blot analysis using antibodies to α-tubulin, β-tubulin, and acetylated α-tubulin (C). Time-dependent changes in the levels of α-tubulin and acetylated α-tubulin relative to the zero time point are shown in panel D, *p < 0.05 compared to zero time point, n=5. Only the 48 h images are shown in panels A and B. Bar = 10 μm.
Cells That Express β6-Tubulin Are Resistant to Microtubule Inhibitors
Cell lines expressing mutant tubulin subunits that increase microtubule stability have been shown to be resistant to drugs that inhibit microtubule assembly and more sensitive to drugs that promote assembly [Cabral, 2001]. Having observed that cells expressing β6 had increased tubulin acetylation that indicated increased microtubule stability, we reasoned that those cells should be resistant to microtubule inhibitors. Because β6 expressing cells could not divide, we were unable to test for drug sensitivity using a standard colony formation assay. Instead, we used tubulin immunofluorescence to test for drug effects. For the experiment shown in Fig. 5, we mixed wild-type cells with β6-7 cells to have an internal control for drug effects on microtubule polymerization, and treated the mixed population for 3-24 h with varying doses of microtubule drugs. Because drug-induced changes in microtubule assembly occurred more slowly in β6-7 perhaps owing to the relative stability of microtubules in those cells, we primarily show the drug effects after 24 h in Fig. 5. For paclitaxel, a drug that binds to the β subunit and promotes microtubule assembly [Downing, 2000], we used microtubule bundling as an indicator of drug action and found no difference in the response of β6 expressing cells compared to wild-type. For drugs that inhibit microtubule formation, however, striking differences were seen. For example, 130 nM colcemid was sufficient to eliminate microtubules from wild-type cells (arrowheads, Fig. 5), but β6-7 (arrows, Fig. 5) withstood up to 650 nM of the drug. Similar results were obtained with maytansine, a drug whose binding overlaps a vinca alkaloid site that is distinct from both the colcemid and paclitaxel binding sites [Gigant et al., 2005]. Interestingly, however, the β6 expressing cells appeared to be more sensitive to vinblastine, a drug that binds directly to the vinca site. After only a 3 h treatment, β6-7 cells had lost many of their microtubules at 5 nM drug and microtubules were virtually absent at 10 nM even though wild-type cells in the same population still retained most of their microtubules (Fig. 5). At 20 nM vinblastine many, but not all, wild-type cells were depleted of microtubules whereas β6-7 cells exhibited microtubule paracrystals that are normally only seen at much higher drug concentrations in wild-type cells. The increased sensitivity to vinblastine is unexplained but could indicate that β6, like vinblastine, favors the formation of curved protofilaments [Gigant et al., 2005; Himes, 1991]. Alternatively, increased drug sensitivity could indicate an increased affinity of β6-tubulin for vinblastine, but we did not find residues unique to β6 that were close to the vinca binding site. Thus, if increased drug binding is responsible for the increased sensitivity to vinblastine, it is likely to be mediated by conformational effects. Similarly, only a leucine for isoleucine replacement at residue 368 of β6 fell within the colchicine binding site and is unlikely to confer resistance to the drug because reduced drug binding is a recessive phenotype in diploid cells and because the β6 producing cells were also highly resistant to nocodazole (data not shown) which has a very different structure. We thus favor the idea that the effects of β6 on drug sensitivity and resistance are mediated by changes in microtubule assembly and stability as we have previously described for tubulin mutations [Cabral, 2001].
Fig. 5. Effects of β6 on sensitivity to microtubule targeted drugs.

Wild type CHO cells were mixed with clone β6-7 that was induced to express β6-tubulin by removing tetracycline for 24 h. The indicated nM drug concentrations were added for an additional 24 h. Because the β6 expressing cells were more sensitive to vinblastine, this drug was added for just the last 3 h of the 48 h incubation. The cells were fixed and stained with antibodies against β6 and α-tubulin to identify β6 expressing and non-expressing cells, but only the α-tubulin staining is shown. Arrows indicate the β6 expressing cells and arrowheads indicate cells that do not express β6. Bar = 10 μm.
Incorporation of β6-Tubulin Suppresses Microtubule Dynamics
The increased α-tubulin acetylation in β6-expressing cells suggested that the microtubules had a slower turnover rate. To explore this observation in more detail, we transfected cells with EGFP-MAP4 and measured the growth and shortening rates of microtubules using live cell microscopy. MAP4 is a microtubule associated protein that is found in many cell types and decorates microtubules without altering their assembly [Barlow et al., 1994; Wang et al., 1996]. Moreover, we previously reported that microtubule dynamics measured using EGFP-MAP4 agree well with measurements from other approaches indicating that overexpression of MAP4 does not itself alter this aspect of microtubule behavior [Yang et al., 2010]. The microtubules that we imaged were mostly near the outer periphery where the cell is relatively flat, but internal microtubules that stayed within the plane of focus had similar dynamics.
As shown in the life-history plots that measure time-dependent changes in microtubule length (Fig. 6) and in Supporting Information Movie 1, most wild-type microtubules displayed typical dynamic behavior that included episodes of growth and shortening interrupted by short pauses during which there was no change in length. There were also frequent catastrophes (transitions from growth or pause to shortening) and rescues (transitions from shortening to growth or pause). In contrast, nearly all the microtubules containing β6 were profoundly non-dynamic with long pauses that were only occasionally interrupted by very short episodes of growth or shortening (Supporting Information Movie 2). To quantify these observations, growth rates, shortening rates, and other parameters of dynamic instability were measured and the values are compared in Table I. Compared to wild-type, β6-containing microtubules had lower growth and shortening rates, and had less frequent catastrophes that resulted in a large increase in the time spend in a paused state as well as a much lower dynamicity. This last parameter measures the total of changes in length (both growth and shortening) experienced by a microtubule per unit time and serves as a commonly used measure of microtubule activity [Jordan and Wilson, 1998]. It should be noted that microtubule fragments that contain β6 exhibited similar suppressed dynamic behavior at both ends thus explaining their stable appearance in the cytoplasm. These fragments were often seen to translocate toward the cell periphery and to slide next to other microtubules. Although we don’t know the mechanisms involved in these movements, they are likely to contribute to the accumulation of short bundles of microtubules at the plasma membrane seen by immunofluorescence (Fig. 2).
Fig. 6. Microtubule life history plots.

Wild-type CHO (WT), clone β6-47, and clone β6-7 were transfected with EGFP-MAP4 to visualize microtubules and incubated without tetracycline for 48 h. Microtubules were imaged 5 s apart by live cell fluorescence microscopy, their lengths were measured from an arbitrary reference point, and the lengths were plotted against time. Each line represents a separate microtubule followed for up to 250 s. Note that the position of a line on the graph is arbitrary and does not represent the actual total length of the microtubule. Graphs similar to these were used to calculate growth rates, shortening rates, catastrophes, rescues, and other parameters characteristic of dynamic instability. The results from those calculations are summarized in Table I.
Table I.
Parameters of microtubule dynamics (Mean ± SEM)
| CHO | β6-47 24 hrs | β6-47 48 hrs | β6-7 24 hrs | β6-7 48 hrs | |
|---|---|---|---|---|---|
| Growth | |||||
| Rate (μm/min) | 16.14 ± 0.77 | 10.07 ± 0.44* | 10.04 ± 0.44* | 10.36 ± 0.68* | 10.08 ± 1.06* |
| Duration (sec) | 12.88 ± 1.12 | 7.41 ± 0.63* | 6.92 ± 0.51* | 6.05 ± 0.35* | 7.85 ± 1.23* |
| Distance (μm) | 3.16 ± 0.40 | 1.24 ± 0.11* | 1.23 ± 0.15* | 1.11 ± 0.10* | 1.37 ± 0.21* |
| Shortening | |||||
| Rate (μm/min) | 27.80 ± 2.32 | 17.37 ± 1.51* | 15.42 ± 1.31* | 17.11 ± 1.85* | 12.00 ± 0.93* |
| Duration (sec) | 12.13 ± 1.04 | 12.69 ± 1.94 | 8.90 ± 0.99* | 8.00 ± 0.93* | 6.50 ± 0.49* |
| Distance (μm) | 5.07 ± 0.53 | 3.92 ± 0.78 | 2.68 ± 0.44* | 2.74 ± 0.67* | 1.29 ± 0.12* |
| Frequency (min−1) | |||||
| Catastrophe1 | 1.37 ± 0.11 | 0.80 ± 0.15* | 1.09 ± 0.24 | 1.10 ± 0.17 | 0.73 ± 0.14* |
| Rescue2 | 5.95 ± 0.50 | 7.18 ± 0.98 | 8.58 ± 0.95* | 9.68 ± 0.60* | 10.02 ± 0.61* |
| % of time in | |||||
| Growth | 30.44 ± 2.36 | 11.23 ± 1.78* | 7.80 ± 1.60* | 8.27 ± 1.76* | 4.59 ± 1.09* |
| Shortening | 20.19 ± 2.09 | 7.88 ± 1.78* | 7.31 ± 1.92* | 10.09 ± 1.75* | 4.31 ± 1.10* |
| Pause | 49.17 ± 3.19 | 80.89 ± 3.07* | 84.89 ± 2.74* | 81.64 ± 3.07* | 91.09 ± 1.66* |
| Dynamicity3 (μm/min) | 8.90 ± 0.84 | 2.50 ± 0.51* | 2.50 ± 0.49* | 2.75 ± 0.59* | 1.53 ± 0.27* |
| Number of MTs | 32 | 28 | 30 | 30 | 30 |
p<0.05 compared to CHO control by student t-test
Catastrophe: transition from pause or growth to shortening.
Rescue: transition from shortening to either pause or growth.
Dynamicity: the total of changes in length (growth plus shortening) per unit time.
β6-Tubulin Inhibits Microtubule Nucleation
Immunofluorescence experiments indicated that β6 expressing cells accumulated microtubules at the cell periphery as they became depleted near the cell center over time (Fig. 2). This suggested that β6 expressing cells might have a defect in the nucleation of new microtubules by the centrosome. To test this possibility, we treated cells with colcemid to depolymerize existing microtubules, washed out the drug, and then followed the time course for the reappearance of microtubules in wild-type and β6 expressing cells. As shown in Fig. 7 A, striking differences were seen. Significant centrosomal asters were seen in wild-type cells within 20-30 min of drug removal and a normal cytoskeleton was seen by 50 min. In contrast, β6 expressing cells displayed a large amount of random cytoplasmic microtubule formation as early as 20 min after drug removal and, even at 50 min, microtubules could not be traced back to the centrosome. Throughout this period, only very small asters were seen at the centrosomes.
Figure 7. Microtubule nucleation.

A: Wild-type (WT) CHO and clone β6-7 cells were treated with 2.5 μM colcemid for 2 h to depolymerize microtubules. After washing out the drug, the cells were fixed and stained at the indicated times (min) with an antibody to α-tubulin. Bar = 10 μm. B: WT and β6-7 cells were transfected with EB1-GFP and imaged by live cell fluorescence microscopy. Representative images are shown. Arrows point to the centrosome. Bar = 10 μm.
The microtubule regrowth experiment measures microtubule nucleation under abnormal conditions in which there are few existing microtubules alongside a much higher than normal concentration of unassembled tubulin subunits. Moreover, we suspected that the appearance of random microtubule fragments in the cytoplasm of β6 expressing cells might have resulted from an incomplete disassembly of the microtubules that could then elongate and thus compete with the centrosomes by incorporating free tubulin subunits. To resolve these issues, we attempted to measure nucleation under steady state conditions by transfecting cells with EB1-GFP, a protein that is known to specifically bind the plus-ends of elongating microtubules [Akhmanova and Steinmetz, 2008]. Fig. 7B shows that the protein bound successfully to newly nucleated microtubules in wild-type cells and produced a pattern of EB1 comets radiating out from the centrosome (Supporting Information Movie 3), but it did not bind to microtubules in clone β6-7 and few if any comets were seen to emerge from the centrosome (Supporting Information Movie 4). This result could potentially be explained by postulating that β6 directly interferes with EB1 binding; but a simpler explanation, and one that is consistent with the life history plots shown in Fig. 5, is that steady state microtubules in β6 expressing cells are seldom in a growth phase. The lack of a focus of new microtubule growth suggests that microtubules are not efficiently nucleated at the centrosome in β6 expressing cells under steady state conditions. Although we cannot yet explain the defect in microtubule nucleation, we have noticed that spindle poles become much less focused during prometaphase in β6 expressing cells (Supporting Information Fig. S3), suggesting the possibility that β6 could be affecting centrosome stability.
Discussion
These studies were designed to examine the effects of β6-tubulin on microtubule assembly, microtubule organization, and cell division. In mammals this divergent tubulin isotype is only found in late stage megakaryocytes and platelets, cells that do not undergo cell division. Platelet formation begins with the differentiation of megakaryoblasts into large multinucleated megakaryocytes [Ravid et al., 2002]. The expression of β6 appears to coincide with the formation of proplatelet membrane extensions from which platelets ultimately bud off and are released into the circulation [Lecine et al., 2000]. Preceding the formation of proplatelets, microtubules bundle at the plasma membrane and extend into the growing proplatelet protrusions. The platelets that bud off from these protrusions are anucleate discoid shaped cells whose microtubules are arranged into a marginal band that is composed predominantly of the β6 isotype [Hartwig and Italiano, 2003]. Although the marginal band was originally believed to be a single microtubule that curved around the membrane several times to form a coil, recent work suggests that it actually consists of multiple overlapping microtubules [Patel-Hett et al., 2008].
Expression of β6 in CHO cells that do not normally express this isotype recapitulated several of the events that occur during megakaryocyte differentiation. For example, even low expression of β6 in CHO cells arrested mitosis and led to the formation of large multinucleated cells. Although mouse β6 knockout studies indicated that β6 is not essential for the production of multinucleated megakaryocytes [Schwer et al., 2001], our experiments suggest that the isotype could be expressed at low levels in megakaryoblasts and participate in blocking cell division, perhaps acting as a redundant mechanism to ensure morphological differentiation of the blast cells into large multinucleated cells. Our studies further indicated that incorporation of β6 potently suppressed microtubule dynamics, inhibited centrosomal microtubule nucleation, and led to the production of relatively short microtubule bundles that accumulated at the cell cortex. Thus, expression of β6 appears to be sufficient to reorganize microtubules into the bundles at the plasma membrane of megakaryocytes that are necessary for the elaboration of proplatelet extensions. This finding is consistent with the observation that proplatelets are deficient in megakaryocytes lacking β6 [Schwer et al., 2001]. Because transfected CHO cells do not form proplatelets or shed platelets into the culture medium, other factors are clearly involved in the biological process; but our studies on β6 support the hypothesis that this isotype has properties that facilitate megakaryocyte differentiation and lead to the formation of the stable marginal band that is required for discoid platelet morphology.
Earlier studies that examined the effects of β6 transfection into cultured cell lines reported that this isotype was able to assemble into cytoplasmic and spindle microtubules without disrupting their organization [Joshi et al., 1987; Lewis et al., 1987]. However, those experiments did not use an inducible system, transfection efficiency was low, and the levels of expression were not measured. Our demonstration that β6 expression interferes with mitosis makes it likely that cells with high expression may have been lost in the prior studies and the authors may have examined cells with only trace amounts of the β6 isotype. Our studies are more in concert with in vitro studies reporting that purified chicken erythrocyte tubulin formed more stable polymers with reduced elongation and nucleation rates [Murphy and Wallis, 1985].
Class VI β-tubulin represents the clearest evidence for functional variation among tubulin isotypes in mammalian cells. Of the seven β-tubulin isotypes in mammals, it is the most divergent and the most restricted in its expression, presumably because of the potent effects it has on microtubule organization and cell division. We previously reported that overexpression of β1, β2, or β4b in CHO cells had no effect on cell division, microtubule assembly, or cell sensitivity to paclitaxel [Blade et al., 1999]. We later reported that overexpression of β3, an isotype that is largely restricted to neuronal cells, caused some inhibition of microtubule assembly and made cells marginally resistant to paclitaxel, but considerable expression was needed to see these effects [Hari et al., 2003]. Overexpression of β4a, another brain-restricted isotype, had minimal effects on microtubule assembly but conferred increased sensitivity to paclitaxel at low levels of expression that likely was caused by increased drug binding affinity [Yang and Cabral, 2007]. Prior to the current studies, the isotype with the largest effect on microtubule assembly was β5. Overexpression of this isotype at moderate to high levels can virtually eliminate the microtubule cytoskeleton [Bhattacharya and Cabral, 2004], yet its production at low levels is necessary for cell division [Bhattacharya et al., 2008]. At more moderate levels of overexpression, β5 reduces microtubule assembly and confers resistance to paclitaxel in a manner that is similar to mutant forms of β1-tubulin that we and others have described [Cabral, 2001; Orr et al., 2003].
In all of these previous studies, even the clones with high expression that lowered the endogenous tubulin isotypes failed to produce a phenotype similar to what we found with high or low levels of β6 overexpression. For example, β5 and β6-tubulin are the only isotypes able to inhibit cell division at low to moderate levels of expression, and both of them potently suppress microtubule dynamics. Both isotypes also cause microtubule fragments to appear, but the mechanisms by which they are generated appear to differ. Our studies indicate that fragments in drug treated [Yang et al., 2010], mutant [Ganguly et al., 2010], and β5 overexpressing cells (R. Bhattacharya, H. Yang, and F. Cabral, manuscript submitted) originate from microtubules that detach from centrosomes and spindle poles throughout the cell cycle. In contrast, an increased frequency of microtubule detachment and the generation of fragments is not seen during interphase in β6 overexpressing cells. Instead microtubule fragmentation occurs specifically in early mitosis and appears to involve a fundamentally different process that does not involve microtubule detachment. In support of this conclusion, paclitaxel prevents the formation of microtubule fragments in β5 overexpressing cells and in mutant cell lines that also have an increased frequency of microtubule detachment [Ganguly et al., 2010] but not in β6 expressing cells. Moreover, β6 expressing cells and wild-type cells appear to share similar sensitivity to paclitaxel, but mutant and β5 overexpressing cells that produce microtubule fragments by detachment are drug resistant [Bhattacharya and Cabral, 2004; Ganguly et al., 2010].
Another unique property of β6 is its ability to inhibit microtubule nucleation. To date, we have found no change in the rate of nucleation in mutant cell lines with altered tubulin [Ganguly et al., 2010], cells with overexpression of β5 (R. Bhattacharya, H. Yang, and F. Cabral, manuscript submitted), or drug-treated cells (A. Ganguly, H. Yang, and F. Cabral, unpublished studies). Although we do not know the basis for β6 effects on nucleation, it is possible that expression of this isotype produces structural changes in the centrosome or in its ability to properly organize. Support for this speculation comes from the observation (Fig. 3A and Supporting Information Fig. S3) that the spindle poles appear to be much less focused during prometaphase in clone β6-7 but not in cells that express mutant β1 tubulin or are treated with high concentrations of microtubule inhibitors. The ability of β6 to inhibit mitosis, cause microtubule fragmentation, suppress the dynamics and thereby stabilize those fragments, and inhibit microtubule nucleation are properties that make this isotype ideally suited for megakaryocyte differentiation and platelet production.
Supplementary Material
Acknowledgments
We thank Dr. Xiangwei He for the generous use of his DeltaVision microscope, Dr. Anthony Frankfurter for the β6-specific antibody D8, Dr. Joanna Olmsted for providing the EGFP-MAP4 plasmid, Dr. Jeanette Bulinski for a rabbit antibody to α-tubulin, and Dr. Don Cleveland for the β-tubulin N-terminal specific antibody 18D6. These studies were supported by grant CA85935 from the National Institutes of Health to FC.
Abbreviations
- CHO
Chinese hamster ovary
- HA
hemagglutinin antigen
- tet
tetracycline
References
- Abraham I, Marcus M, Cabral F, Gottesman MM. Mutations in α- and β-tubulin affect spindle formation in Chinese hamster ovary cells. J Cell Biol. 1983;97:1055–1061. doi: 10.1083/jcb.97.4.1055. [DOI] [PMC free article] [PubMed] [Google Scholar]
- Ahmad S, Singh B, Gupta RS. Nucleotide sequences of three different isoforms of beta-tubulin cDNA from Chinese hamster ovary cells. Biochim Biophys Acta. 1991;1090:252–254. doi: 10.1016/0167-4781(91)90112-y. [DOI] [PubMed] [Google Scholar]
- Akhmanova A, Steinmetz MO. Tracking the ends: a dynamic protein network controls the fate of microtubule tips. Nat Rev Mol Cell Biol. 2008;9:309–322. doi: 10.1038/nrm2369. [DOI] [PubMed] [Google Scholar]
- Barlow SB, Gonzalez-Garay ML, West RR, Olmsted JB, Cabral F. Stable expression of heterologous microtubule associated proteins in Chinese hamster ovary cells: evidence for differing roles of MAPs in microtubule organization. J Cell Biol. 1994;126:1017–1029. doi: 10.1083/jcb.126.4.1017. [DOI] [PMC free article] [PubMed] [Google Scholar]
- Bhattacharya R, Cabral F. A ubiquitous β-tubulin disrupts microtubule assembly and inhibits cell proliferation. Mol Biol Cell. 2004;15:3123–3131. doi: 10.1091/mbc.E04-01-0060. [DOI] [PMC free article] [PubMed] [Google Scholar]
- Bhattacharya R, Frankfurter A, Cabral F. A minor β-tubulin essential for mammalian cell proliferation. Cell Motil Cytoskeleton. 2008;65:708–720. doi: 10.1002/cm.20292. [DOI] [PubMed] [Google Scholar]
- Blade K, Menick DR, Cabral F. Overexpression of class I, II, or IVb β-tubulin isotypes in CHO cells is insufficient to confer resistance to paclitaxel. J Cell Sci. 1999;112:2213–2221. doi: 10.1242/jcs.112.13.2213. [DOI] [PubMed] [Google Scholar]
- Cabral F. Factors determining cellular mechanisms of resistance to antimitotic drugs. Drug Resistance Updates. 2001;3:1–6. doi: 10.1054/drup.2000.0172. [DOI] [PubMed] [Google Scholar]
- Cabral F, Barlow SB. Resistance to antimitotic agents as genetic probes of microtubule structure and function. Pharmac Ther. 1991;52:159–171. doi: 10.1016/0163-7258(91)90006-8. [DOI] [PubMed] [Google Scholar]
- Downing KH. Structural basis for the interaction of tubulin with proteins and drugs that affect microtubule dynamics. Ann Rev Cell Dev Biol. 2000;16:89–111. doi: 10.1146/annurev.cellbio.16.1.89. [DOI] [PubMed] [Google Scholar]
- Fulton C, Simpson PA. Selective synthesis and utilization of flagellar tubulin. The multi-tubulin hypothesis. In: Goldman R, Pollard T, Rosenbaum J, editors. Cell Motility. Cold Spring Harbor Press; New York: 1976. pp. 987–1006. [Google Scholar]
- Ganguly A, Yang H, Cabral F. Paclitaxel dependent cell lines reveal a novel drug activity. Mol Cancer Ther. 2010;9:2914–2923. doi: 10.1158/1535-7163.MCT-10-0552. [DOI] [PMC free article] [PubMed] [Google Scholar]
- Gigant B, Wang C, Ravelli RBG, Roussi F, Steinmetz MO, Curmi PA, Sobel A, Knossow M. Structural basis for the regulation of tubulin by vinblastine. Nature. 2005;435:519–522. doi: 10.1038/nature03566. [DOI] [PubMed] [Google Scholar]
- Gonzalez-Garay ML, Chang L, Blade K, Menick DR, Cabral F. A β-tubulin leucine cluster involved in microtubule assembly and paclitaxel resistance. J Biol Chem. 1999;274:23875–23882. doi: 10.1074/jbc.274.34.23875. [DOI] [PubMed] [Google Scholar]
- Hari M, Yang H, Zeng C, Canizales M, Cabral F. Expression of class III β-tubulin reduces microtubule assembly and confers resistance to paclitaxel. Cell Motil Cytoskeleton. 2003;56:45–56. doi: 10.1002/cm.10132. [DOI] [PubMed] [Google Scholar]
- Hartwig J, Italiano JJ. The birth of the platelet. J Thromb Haemost. 2003;1:1580–1586. doi: 10.1046/j.1538-7836.2003.00331.x. [DOI] [PubMed] [Google Scholar]
- Himes RH. Interactions of the catharanthus (Vinca) alkaloids with tubulin and microtubules. Pharmacol Ther. 1991;51:257–267. doi: 10.1016/0163-7258(91)90081-v. [DOI] [PubMed] [Google Scholar]
- Jordan MA, Wilson L. Use of drugs to study role of microtubule assembly dynamics in living cells. Methods Enzymol. 1998;298:252–276. doi: 10.1016/s0076-6879(98)98024-7. [DOI] [PubMed] [Google Scholar]
- Joshi HC, Yen TJ, Cleveland DW. In vivo coassembly of a divergent β-tubulin subunit (cβ6) into microtubules of different function. J Cell Biol. 1987;105:2179–2190. doi: 10.1083/jcb.105.5.2179. [DOI] [PMC free article] [PubMed] [Google Scholar]
- Kim S, Magendantz M, Katz W, Solomon F. Development of a differentiated microtubule structure: formation of the chicken erythrocyte marginal band in vivo. J Cell Biol. 1987;104:51–59. doi: 10.1083/jcb.104.1.51. [DOI] [PMC free article] [PubMed] [Google Scholar]
- Kung AL, Sherwood SW, Schimke RT. Cell line-specific differences in the control of cell cycle progression in the absence of mitosis. Proc Natl Acad Sci USA. 1990;87:9553–9557. doi: 10.1073/pnas.87.24.9553. [DOI] [PMC free article] [PubMed] [Google Scholar]
- Lecine P, Italiano JEJ, Kim SW, Villeval JL, Shivdasani RA. Hematopoietic-specific beta 1 tubulin participates in a pathway of platelet biogenesis dependent on the transcription factor NF-E2. Blood. 2000;96:1366–1373. [PubMed] [Google Scholar]
- Lewis SA, Gu W, Cowan NJ. Free intermingling of mammalian β-tubulin isotypes among functionally distinct microtubules. Cell. 1987;49:539–548. doi: 10.1016/0092-8674(87)90456-9. [DOI] [PubMed] [Google Scholar]
- Lopata MA, Cleveland DW. In vivo microtubules are copolymers of available β-tubulin isotypes: localization of each of six vertebrate β-tubulin isotypes using polyclonal antibodies elicited by synthetic peptide antigens. J Cell Biol. 1987;105:1707–1720. doi: 10.1083/jcb.105.4.1707. [DOI] [PMC free article] [PubMed] [Google Scholar]
- Luduena RF. Multiple forms of tubulin: different gene products and covalent modifications. Internatl Rev Cytol. 1998;178:207–275. doi: 10.1016/s0074-7696(08)62138-5. [DOI] [PubMed] [Google Scholar]
- Murphy DB, Wallis KT, Machlin PS, Ratrie H, 3rd, Cleveland DW. The sequence and expression of the divergent beta-tubulin in chicken erythrocytes. J Biol Chem. 1987;262:14305–14312. [PubMed] [Google Scholar]
- Murphy DB, Grasser WA, Wallis KT. Immunofluorescence examination of beta tubulin expression and marginal band formation in developing chicken erythroblasts. J Cell Biol. 1986;102:628–635. doi: 10.1083/jcb.102.2.628. [DOI] [PMC free article] [PubMed] [Google Scholar]
- Murphy DB, Wallis KT. Erythrocyte microtubule assembly in vitro. Determination of the effects of erythrocyte tau, tubulin isoforms, and tubulin oligomers on erythrocyte tubulin assembly, and comparison with brain microtubule assembly. J Biol Chem. 1985;260:12293–12301. [PubMed] [Google Scholar]
- Olson KR, McIntosh JR, Olmsted JB. Analysis of MAP 4 function in living cells using green fluorescent protein (GFP) chimeras. J Cell Biol. 1995;130:639–650. doi: 10.1083/jcb.130.3.639. [DOI] [PMC free article] [PubMed] [Google Scholar]
- Orr GA, Verdier-Pinard P, McDavid H, Horwitz SB. Mechanisms of Taxol resistance related to microtubules. Oncogene. 2003;22:7280–7295. doi: 10.1038/sj.onc.1206934. [DOI] [PMC free article] [PubMed] [Google Scholar]
- Patel-Hett S, Richardson JL, Schulze H, Drabek K, Isaac NA, Hoffmeister K, Shivdasani RA, Bulinski JC, Galjart N, Hartwig JH, Italiano JEJ. Visualization of microtubule growth in living platelets reveals a dynamic marginal band with multiple microtubules. Blood. 2008;111:4605–4616. doi: 10.1182/blood-2007-10-118844. [DOI] [PMC free article] [PubMed] [Google Scholar]
- Piehl M, Cassimeris L. Organization and dynamics of growing microtubule plus ends during early mitosis. Mol Biol Cell. 2003;14:916–925. doi: 10.1091/mbc.E02-09-0607. [DOI] [PMC free article] [PubMed] [Google Scholar]
- Ravid K, Lu J, Zimmet JM, Jones MR. Roads to polyploidy: the megakaryocyte example. J Cell Physiol. 2002;190:7–20. doi: 10.1002/jcp.10035. [DOI] [PubMed] [Google Scholar]
- Sawada T, Cabral F. Expression and function of β-tubulin isotypes in Chinese hamster ovary cells. J Biol Chem. 1989;264:3013–3020. [PubMed] [Google Scholar]
- Schwer HD, Lecine P, Tiwari S, Italiano JEJ, Hartwig JH, Shivdasani RA. A lineage-restricted and divergent β-tubulin isoform is essential for the biogenesis, structure and function of blood platelets. Curr Biol. 2001;11:579–586. doi: 10.1016/s0960-9822(01)00153-1. [DOI] [PubMed] [Google Scholar]
- Sullivan KF. Structure and utilization of tubulin isotypes. Ann Rev Cell Biol. 1988;4:687–716. doi: 10.1146/annurev.cb.04.110188.003351. [DOI] [PubMed] [Google Scholar]
- Theodorakis NG, Cleveland DW. Physical evidence for cotranslational regulation of β-tubulin mRNA degradation. Mol Cell Biol. 1992;12:791–799. doi: 10.1128/mcb.12.2.791. [DOI] [PMC free article] [PubMed] [Google Scholar]
- Wang D, Villasante A, Lewis SA, Cowan NJ. The mammalian β-tubulin repertoire: hematopoietic expression of a novel, heterologous β-tubulin isotype. J Cell Biol. 1986;103:1903–1910. doi: 10.1083/jcb.103.5.1903. [DOI] [PMC free article] [PubMed] [Google Scholar]
- Wang XM, Peloquin JG, Zhai Y, Bulinski JC, Borisy GG. Removal of MAP4 from microtubules in vivo produces no observable phenotype at the cellular level. J Cell Biol. 1996;132:345–357. doi: 10.1083/jcb.132.3.345. [DOI] [PMC free article] [PubMed] [Google Scholar]
- Wloga D, Gaertig J. Post-translational modifications of microtubules. J Cell Sci. 2010;123:3447–3455. doi: 10.1242/jcs.063727. [DOI] [PMC free article] [PubMed] [Google Scholar]
- Yang H, Ganguly A, Cabral F. Inhibition of cell migration and cell division correlates with distinct effects of microtubule inhibiting drugs. J Biol Chem. 2010;285:32242–32250. doi: 10.1074/jbc.M110.160820. [DOI] [PMC free article] [PubMed] [Google Scholar]
- Yang H, Cabral F. Heightened sensitivity to paclitaxel in class IVa β-tubulin transfected cells is lost as expression increases. J Biol Chem. 2007;282:27058–27066. doi: 10.1074/jbc.M704101200. [DOI] [PubMed] [Google Scholar]
Associated Data
This section collects any data citations, data availability statements, or supplementary materials included in this article.