

Abstract
UDP-glucuronosyltransferases (UGTs) are critical for the metabolism and clearance of drugs, chemicals, and hormones. The development of UGT1A1 and 1A6 was studied in 50 pediatric liver samples using bilirubin, serotonin activity assays, and Western blot as well as pharmacokinetic scaling. UGT activity developed age dependently in pediatric liver. Maximal activity of 0.7690 nmol · min · −1 mg protein−1 was observed for UGT1A1 at 3.8 months. For UGT1A6, activity matured at 14 months (4.737 nmol · min · −1mg protein−1). Protein expression was not age-dependent, and activities did not correlate to protein levels for either enzyme. The in vitro activities were used to calculate normalized hepatic clearances using both allometric scaling and a physiologically based pharmacokinetic model. For UGT1A1, allometry predicted normalized adult clearances of 0.0070 l · h−1 · kg−1 at 3.0 (well stirred) and 2.8 years (parallel tube), whereas the Simcyp model showed normalized clearances of 0.0079 l · h−1 · kg−1 at 2.6 (well stirred) and 2.5 years (parallel tube). For UGT1A6, only the Simcyp well stirred model converged at 0.3524 l · h−1 · kg−1 at 12.6 months. These data imply independent regulation of UGT1A1 and 1A6 where activity has matured after 6 months to 1 year. Total hepatic clearance of substances mediated by these enzymes may mature concurrently or take longer because of other physiological factors. Late development of UGT enzymes may contribute to chemical, drug, and environmental toxicity.
Introduction
After cytochromes P450 (P450s), the UDP-glucuronosyltransferases (UGTs; E.C. 2.4.1.17) are one of the most critical families for clearance and elimination of drugs, endobiotics, dietary compounds, environmental chemicals, and hormones. Despite the importance of these enzymes, published data on their developmental dynamics are scarce (Radominska-Pandya et al., 1999). Notwithstanding, it is widely believed that the main cause of pediatric adverse drug reactions and chemical toxicity is the ontogenetic lack of drug metabolism. For some metabolizing enzymes, this has been proven to be incorrect, such as for the sulfotransferase and P450 3A7 enzymes that are higher in neonates than in children, which may be detoxifying or may form reactive metabolites (de Wildt et al., 1999; Richard et al., 2001). However, evidence suggests that UGTs develop some time after birth, and this developmental profile could contribute to negative therapeutic outcomes. Adverse drug reactions are one of the leading causes of pediatric death and illness in the United States (Impicciatore et al., 2001); it causes approximately 79,000 pediatric hospitalizations per year, of which 31,000 are life threatening or fatal (Miller et al., 2003), with the majority occurring in children under the age of 5 (Schillie et al., 2009). Therefore, it is important to dissect the development of individual metabolizing enzymes, including the UGTs, to gain a comprehensive picture of pediatric detoxification capacity.
In the early 1980s, a late-fetal change (30–40 weeks of gestation) in hepatic UGT1A1 (from 0.1 to 1.0% of adult activity levels) and postnatal changes that are related to birth age, not gestational age, were reported (Kawade and Onishi, 1981). Subsequently, researchers used biochemical substrates to determine UGT activity in the fetal liver, demonstrating that bilirubin (UGT1A1) and 1-naphthol (1A1, 1A3, 1A6, 1A7, 1A8, 1A9, 1A10, and 2B7) glucuronidation increase postnatally. Despite these activity differences, similar levels of protein expression were observed between a 13-week neonate and an adult liver. Because neither the antibody nor the substrates were specific (except bilirubin, which was not known at the time), evidence for the maturation of single isoforms was not inferred (Coughtrie et al., 1988). After this discovery, Burchell et al. (1989) demonstrated UGT maturation with fetal and neonatal liver samples from several gestational time points. Similar development of activities to pan-specific substrates were observed, except for serotonin (1A4), where adult activities were observed in fetal (16–25 weeks) and neonatal liver up to 10 days old (Burchell et al., 1989). More recently, individual UGT isoform development in infants and young children, including two fetal liver samples, were analyzed and showed that pediatric levels of mRNA and protein for UGT isoforms did not differ from adults, but activities were lower up to 2 years of age (Strassburg et al., 2002).
For individual UGT isoforms, postnatal development has been described for UGT1A4 (Miyagi and Collier, 2007) and UGT2B7 (Zaya et al., 2006). Herein, we extend knowledge in this area by investigating the ontogeny of UGT1A1 and 1A6. Within the UGT superfamily, these two enzymes are particularly important because they have the widest tissue distributions, have been studied extensively, and possess the broadest substrate affinities. The UGT1A1 isoform is involved in the metabolism and regulation of endobiotics such as estrogen and bilirubin as well as the elimination of several drugs (Burchell et al., 2000; Williams et al., 2004). Polymorphisms in UGT1A1 have functional consequences that range from Gilbert's disease, a mild clinical syndrome, to the potentially fatal Crigler-Najjar disease (Nagar and Blanchard, 2006). The UGT1A6 isoform is also involved in drug metabolism and in the clearance of several steroid and thyroid hormones and environmental chemicals (Radominska-Pandya et al., 1999; Court, 2005; Zhang et al., 2007). Similar to 1A1, the 1A6 isoform is also polymorphic with expression and activity affected by genetics as well as environmental and tissue-specific factors (Bock and Köhle, 2005).
We hypothesized that UGT1A1 and 1A6 would show independent developmental profiles and would not reach full enzyme activity for several years. Furthermore, on the basis of a combination of enzyme development and physiological development in childhood, we hypothesized that hepatic clearance mediated by these enzymes would also show a developmental delay. The goal was to increase our understanding of UGT ontogeny to improve pediatric pharmacology and to better understand chemical and environmental toxicities.
Materials and Methods
Materials.
Serotonin, bilirubin, MgCl2, glycine, 2-pentanone, n-butyl acetate, HCl, ascorbic acid, UDP-glucuronic acid, NaOH, alamethicin (from Trichoderma viride), phthalimide, ethyl ether, sodium hypochlorite solution (5.65–6%), chloroform-D, sulfuric acid, sodium nitrite, dimethyl sulfoxide-D6, ammonium sulfamate, and ethanol were purchased from Sigma-Aldrich (St. Louis, MO). Serotonin enzyme-linked immunosorbent assays (ELISAs) were purchased from Rocky Mountain Diagnostics (Colorado Springs, CO) and Alpco Immunoassays (Salem, NH). Primary antibodies to UGT1A1 and 1A6 were purchased from Santa Cruz Biotechnology, Inc. (Santa Cruz, CA), and secondary antibodies were obtained from Jackson ImmunoResearch Laboratories Inc. (West Grove, PA). Western blotting ECL detection system was from GE Healthcare (Chalfont St. Giles, UK).
Pediatric and Adult Liver Samples and Demographics.
Individual pediatric and pooled adult human liver microsomes were purchased from XenoTech, LLC (Lenexa, KS) and Puracyp (Carlsbad, CA) and were derived from postmortem donors with healthy livers that were acquired through the United Network for Organ Sharing with various causes of death (anoxia, cerebrovascular aneurysm, head trauma, or motor vehicle accident). The samples were processed within 8 h postmortem and were free of any infectious disease. Protein content of the microsome samples were provided by the companies. Pediatric microsomes (n = 50) were derived from single livers, and, in this study, the sample population was composed of Asian (3%), Hispanic (14%), African American (16%), American Indian (3%), and white (64%) donors, with 15 females and 35 males. Samples ranged from 13 days to 20 years of age, with an average age of 8.0 years. Pooled adult liver microsomes (XTreme 200 Pool; XenoTech, LLC) were derived from 200 donors and contained Asian (4%), Hispanic (6%), African American (6%), and white (84%) ethnicities with equal numbers of men and women (100 each). The average age was 50 years with a range of 17 to 78 years.
Synthesis and Preparation of Ethyl Anthranilate.
Ethyl anthranilate was synthesized as described previously (Staiger and Miller, 1959; Humburger and Hahn, 1972). In brief, 0.2 mol of phthalimide was dissolved in 110 ml of NaOH solution (2 M) for 10 min at 10°C, the temperature was then dropped to 4°C, and the solution was left to stand for 16 h. Subsequently, a solution of 0.2 mol of sodium hypochlorite and 0.0183 mol of NaOH was added at 10°C over 5 min, followed by rapid addition of 0.119 mol of sulfuric acid, and the compound was heated to 35°C for 30 min. The product was filtered and washed with three times its volume in water and then oven-dried at 50°C to 55°C for 15 h. This intermediate (isatoic anhydride) was dissolved in dimethyl sulfoxide-D6 and checked for purity by 1H NMR, yielding a spectra corresponding to the reference (in parts per million): 7.149 (1H, d); 7.259 (1H, t); 7.729 (1H, t); 7.789 (1H, d); and 11.713 (1H, s). Once acceptable purity was obtained, a mixture of the isatoic anhydride with ethanol and NaOH was charged to a round-bottom flask in the molar ratio 1:6:0.05. The slurry was stirred and slowly heated to 65°C and held until bubbling ceased. The organic layer was extracted after it was diluted in three times its volume with water. The final product (ethyl anthranilate) was dissolved in chloroform-D and assessed for purity by 1H NMR. The final product yielded the following spectra that also corresponded to the reference spectra (in parts per million): 1.383 (3H, t); 4.319 (2H, d); 5.751 (2H, s); 6.642 (2H, double of t); 7.259 (1H, t); and 7.7887 (1H, d). The compound was subsequently used for the bilirubin diazotization.
For the diazotization, 15 μl of ethyl anthranilate suspended in 1.5 ml of HCl (0.15 M) was treated with 45 μl of freshly prepared sodium nitrite (5 mg/ml) and then incubated at room temperature for 5 min. An aliquot of 15 μl of freshly prepared ammonium sulfamate (10 mg/ml) was added and incubated at room temperature for 3 min, after which it was used immediately in the UGT1A1 assay.
UGT1A1 Activity and Intrinsic Liver Bilirubin Concentrations.
The activity of UGT1A1 was determined as described previously (Heirwegh et al., 1972). In brief, 150 μl of Tris-HCl buffer (0.4 M) (pH 7.7) containing bilirubin (0.125 mM), UDP-glucuronic acid (5 mM), MgCl2 (5 mM), alamethicin (50 μg/mg protein), and microsomes (0.5 mg/ml) was incubated for 15 min at 37°C. The reaction was stopped by the addition of 150 μl of glycine-HCl buffer (0.4 M) (pH 2.7) and placed on ice for a few minutes. Next, 150 μl of ethyl anthranilate diazo reagent was added to the mixture and incubated at room temperature for 30 min in the dark, and then the reaction stopped with 150 μl of freshly prepared 10% ascorbic acid solution (w/v). Bilirubin glucuronides were extracted with a 3× volume of 2-pentanone/n-butyl acetate (17:3, v/v) and frozen at −20°C. After freezing, samples were thawed, vortexed, and centrifuged at 2500g for 10 min. Samples were refrozen at −20°C, and bilirubin glucuronides were detected in the organic phase by absorbance at 530 nm in a Spectramax 340 plus spectrophotometer (Molecular Devices, Sunnyvale, CA). Bilirubin glucuronide concentrations were calculated using the ε = 44.4 × 10³ l mol−1 cm−1. Intrinsic levels of bilirubin glucuronide were also determined for each sample as described previously, with the exception that UDP-glucuronic acid was not added. Each sample was read in triplicate. Before experimentation, a kinetic time point assay (at 0, 15, 30, 45, 60, 75, and 120 min) was performed to determine the optimal incubation period (15 min). Results were expressed in nanomole bilirubin metabolized per minute per milligram protein. Bilirubin was chosen because it is a highly specific substrate for UGT1A1. The intra- and interassay coefficients of variation for the pooled adult human liver microsomes (positive controls) were 8.5 and 19.0%, respectively.
UGT1A6 Activity and Intrinsic Liver Serotonin Concentrations.
The activity of UGT1A6 was measured as described previously (Krishnaswamy et al., 2003). In brief, 100 μl of potassium phosphate buffer (0.25 M) (pH 7.5) containing serotonin (100 μM), UDP-glucuronic acid (5 mM), MgCl2 (5 mM), alamethicin (50 μg/mg protein), and microsomes (0.2 mg/ml) was incubated for 20 min at 37°C. Subsequently, reactions were diluted 50-fold and analyzed with a commercial serotonin ELISA per the manufacturer's instruction [Alpco Diagnostics (Salem, NH) and Rocky Mountain Diagnostics]. Intrinsic levels of serotonin were also determined for each sample as described above, except UDP-glucuronic acid was not added. Because the Km of serotonin (5.2–8.8 mM) is far larger than physiological conditions, a single concentration of 100 μM was used. Because the specificity of the commercial ELISA is less than 0.2% for serotonin metabolites, a substrate depletion approach was used. Specific activity of UGT1A6 was calculated as follows: 100 μM serotonin + intrinsic serotonin − concentration after 20 min of incubation. Each sample was assayed in duplicate. Results were expressed in nanomole serotonin metabolized per minute per milligram protein. Serotonin was chosen because it is a highly specific substrate for UGT1A6. The average r2 of the standard curves from the ELISA kits were 0.983 ± 0.007. The intra- and interassay coefficients of variation for the pooled adult human liver microsomes (positive controls) were 16.2 and 16.6%, respectively.
Western Blot for UGT1A1 and 1A6 Protein in Pediatric Liver.
The expression of UGT1A1 and 1A6 protein was assessed with Western blot as described previously (Collier et al., 2002). Primary antibodies were purchased from Santa Cruz Biotechnology, Inc. and were an affinity-purified goat polyclonal antibody raised against a peptide mapping near the N terminus of UGT1A1 or 1A6 of human origin. In brief, microsomes from individual pediatric livers (10 μg) and pooled adult livers (positive control, 10 μg) were resolved on a 10% SDS-polyacrylamide gel electrophoresis gel under reducing conditions, transferred to polyvinylidene difluoride membranes with semidry transfer (Bio-Rad Laboratories, Hercules, CA), and then blocked in phosphate-buffered saline with Tween 20 with 2% nonfat milk powder overnight. Subsequently, membranes were washed and incubated with primary antibody (rabbit anti-UGT1A1/1A6, 1:1000, and 2% nonfat milk powder) for 2 h at room temperature. After primary incubation, membranes were washed again, incubated with a solution of secondary biotinylated donkey anti-rabbit antibody (1:4000, 2% nonfat milk powder, 2% normal donkey serum) for 1 h at room temperature, washed again, and then incubated with streptavidin-biotinylated horseradish peroxidase (1:3000) for 1 h. Before detection, membranes were washed a final time and bands were detected on-membrane with tetramethylbenzidine substrate for 15 min at room temperature. Confirmation of even protein loading was established by staining gels with Coomassie Blue. Band intensities were calculated using ImageJ software (National Institutes of Health, Bethesda, MD) and were normalized to the pooled control included on every membrane.
Pharmacokinetics, Scaling, and Statistical Analyses.
All analyses were performed using GraphPad Prism 5 (GraphPad Software Inc., San Diego, CA). Adult levels of enzymatic activity and normalized clearances were determined using a one-phase exponential association nonlinear equation (eq. 1), fitted using GraphPad's robust nonlinear regression and outlier removal method. This model assumes that an enzyme will start at some activity at birth and increase with a constant rate of development (K) that fits a curve ending in a maximal rate of action (plateau). Y0 represents initial activity after birth, and Ymax represents the maximal enzyme rate. Activity models were not weighted.
For analysis, a table of XY coordinates defining the modeled curve was generated, and the “age of adult activity/clearance” was defined as the youngest age at which activity reached within 90% of the plateau level (90th percentile).
To evaluate hepatic drug clearance, our enzyme kinetic results were modeled using both the well stirred (eq. 2) and the parallel-tube equations (eq. 3) to calculate adult clearances.
Here, Qhepatic is hepatic blood flow, CLint is intrinsic clearance, and fu is the unbound fraction of the drug. Hepatic clearances were generated by using experimental intrinsic clearances (Vmax/Km), assuming a liver size of 1500 g and a hepatic flow rate of 1.5 l/min for adults. The literature Km values, which were used to calculate intrinsic clearances, were 5.0 μM for bilirubin (UGT1A1) (Ciotti et al., 1998) and 5.2 mM for serotonin (UGT1A6) (Krishnaswamy et al., 2003). Vmax was calculated for each sample within the study by using experimental enzyme activity, substrate concentrations, and Michaelis-Menten kinetics (125 μM bilirubin/1A1 and 100 μM serotonin/1A6). Because the Km for UGT1A6 exceeded physiological concentrations of serotonin, a lower concentration was used that was taken from the linear portion of the Michaelis-Menten curve and was subsequently used to calculate Vmax. Microsomal protein per gram liver (MPPGL) was unknown, so the standard variable of 45 mg/g was used (Houston, 1994). Plasma unbound fraction for bilirubin and serotonin were 0.001 (Ostrow et al., 2003) and 0.17 (Breyer-Pfaff et al., 1989), respectively.
Subsequently, an allometric model (eq. 4) was used to scale calculated adult clearances (well stirred and parallel-tube) to pediatric clearances by using children's weight as the scalar.
 |
Here, Wi is the weight of the individual and Wstd is the weight of an average adult (20 years of age). Weight of each individual child was used, except for eight subjects for whom weights were estimated by using the 50th percentile for age and gender from the National Center for Health Statistics (2000) growth charts. The average adult weight used was the 50th percentile at 20 years for each gender.
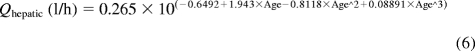
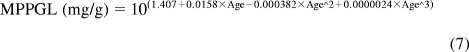
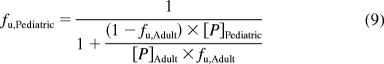
In addition, a second model derived from Simcyp Pediatric (Sheffield, UK) was used. The model calculated liver size maturation (eq. 5), Qhepatic (eq. 6), MPPGL (eq. 7), and [P]pediatric, the amount of pediatric albumin (eq. 8). The fraction unbound in the pediatric population, fu,Pediatric, was calculated (eq. 9) by using adult fu and pediatric albumin levels, where [P]adult is 44 g/l (McNamara and Alcorn, 2002). Body surface (in square meters) was calculated, based on height and weight of the individual (eq. 10) by using a variation of DuBois and DuBois (Wang et al., 1992), where height is in centimeters and weight is in kilograms. For the 15 individuals where height and/or weight were missing, values were estimated using the 50th percentile for age and gender from the National Center for Health Statistics (2000) growth charts. The calculated values using the Simcyp equations were then used to calculate hepatic clearance using eqs. 2 and 3. Because fu, MPPGL, Qhepatic, and liver size were scaled individually for each donor based on age or body surface area, the allometric model was not applied here.
 |
 |
 |
The goodness of fit for each model was assessed with an F test, r2 values, absolute sums of squares, and S.E. of estimates (Sy.x). Both allometric and Simcyp clearance values were normalized to individual body weights.
Results
UGT1A1 and 1A6 Activity.
Both UGT isoforms' activities developed in an age-dependent manner. Data were fit over the entire age range of samples against two different one-phase exponential associations (starting at 0 and starting at some number) and biphasic (which will model a rise to a peak then fall to a plateau) and sigmoidal equations. F tests indicated that a one-phase exponential equation starting at some number was the best fit models for both isoforms.
For UGT1A1, the model returned activities of 0.7848 pmol · min · −1 mg protein−1 at birth that increased constantly to apparent maximal adult activities of 0.7690 ± 0.081 nmol · min · −1mg protein−1 [95% CI: 0.6028–0.9351], with the 90th percentile activity (90% of maximum) reached at 3.8 months of age (r2 = 0.04748, absolute sum of squares = 13.52, Sy.x = 0.5363) (Fig. 1A). The model-derived maximal activity for UGT1A1 agrees reasonably with the average rates of bilirubin metabolism measured in pooled (n = 200) adult liver microsomes of 0.58 ± 0.056 nmol · min · −1mg protein−1.
Fig. 1.

The development of UGT1A1 in the pediatric liver. A, activity toward 125 μM bilirubin increased with age. Model returned an activity of 0.7848 pmol · min · −1mg protein−1 at birth that increased to apparent maximal adult activity at 0.7690 ± 0.081 nmol · min · −1mg (95% CI, 0.6028–0.9351). The 90th percentile of activity was reached at 3.8 months of age (r2 = 0.04748, absolute sum of squares = 13.52, Sy.x = 0.5363). Each point represents each sample read in triplicate ± S.E.M. The model is unweighted and constrained by medium convergence criteria requiring five consecutive iterations of the fit to change the sum-of-squares by less than 0.0001%. B, protein levels did not correlate with age. Two-tailed Pearson correlation returned p = 0.6589 and r2 = 0.005801. C, protein levels did not correlate with enzyme activity. Two-tailed Pearson correlation returned p = 0.4104 and r2 = 0.02002. Band intensities were calculated using ImageJ software (National Institutes of Health) and were normalized to the pooled samples on each Western blot.
For UGT1A6, derived activity was 2.560 nmol · min · −1mg protein−1 at birth that increased to maximal adult activities of 4.737 ± 0.33 nmol · min · −1mg protein−1 (95% CI, 4.041–5.434) with 90% maximal activity occurring at 14 months of age (r2 = 0.09244, absolute sum of squares = 178.8, Sy.x = 1.993) (Fig. 2A). The model fit for UGT1A6 was in excellent agreement with average rates of serotonin metabolism measured in pooled adult liver microsomes (4.3 ± 0.49 nmol · min · −1mg protein−1). Neither UGT1A1 nor 1A6 activities differed significantly with gender or ethnicity.
Fig. 2.

The development UGT1A6 in the pediatric liver. A, activity toward 100 μM serotonin increased with age. Model returned an activity of 2.560 nmol · min · −1mg protein−1 at birth and increased to apparent adult activity at 4.737 ± 0.33 nmol · min · −1mg protein−1 (95% CI, 4.0041–5.434). The 90th percentile of adult activity was reached at 14 months of age (r2 = 0.09244, absolute sum of squares = 178.8, Sy.x = 1.993). Each point represents each sample assayed in duplicate. The model is unweighted and constrained by medium convergence criteria requiring five consecutive iterations of the fit to change the sum-of-squares by less than 0.0001%. B, protein levels did not correlate with age. Two-tailed Pearson correlation returned p = 0.8455 and r2 = 0.001132. C, protein levels did not correlate with enzyme activity. Two-tailed Pearson correlation returned p = 0.2193 and r2 = 0.04403. Band intensities were calculated using ImageJ software (National Institutes of Health) and were normalized to the pooled samples on each Western blot.
UGT1A1 and 1A6 Protein Expression.
Both UGT1A1 and 1A6 were detected at 56 kDa (on separate Western blots), were visible at all postnatal ages, and did not differ significantly with gender or ethnicity. In contrast to activity, UGT1A1 and 1A6 protein levels (determined by area-density analysis compared with an adult standard included on every blot) did not show any age dependence from 0 to 6 months of age (p = 0.4860 for 1A1 and p = 0.5799 for 1A6), 0 to 12 months of age (p = 0.9831 and p = 0.6769, respectively), 0 to 24 months of age (p = 0.8482 and p = 0.2730, respectively), or during the entire age range of samples from 13 days to 20 years (p = 0.6589 and p = 0.8455, respectively) (Figs. 1B and 2B). Furthermore, protein levels and enzyme activities of UGT1A1 and 1A6 did not significantly correlate for samples from 0 to 6 months of age (p = 0.9593 for 1A1 and p = 0.9522 for 1A6), 0 to 12 months of age (p = 0.9783 and p = 0.7092, respectively), 0 to 24 months of age (p = 0.5118 and p = 0.4661, respectively), or during the entire age range of samples (p = 0.4104 and p = 0.2193, respectively) (Figs. 1C and 2C).
Pharmacokinetic Modeling for UGT1A1 and 1A6.
Table 1 summarizes the modeled clearance values and goodness-of-fits for UGT1A1 and 1A6 assessed in both the well stirred and parallel-tube pharmacokinetic models. Interestingly, UGT1A1 showed a higher normalized clearance at birth and then dropped to adult clearance levels after a few years. Both the allometric and Simcyp models returned similar maximal hepatic clearances and ages at which normalized adult clearance is reached when raw data were incorporated into the model. After the model results were scaled by using allometry to account for pediatric clearance, apparent normalized maximal (adult) clearance reached a plateau at 0.0070 l · h−1 · kg−1 for both models (well stirred, Fig. 3A; parallel tube, Fig. 3B). The 90th percentile of clearance was reached at 3.0 years (well stirred) and at 2.8 years (parallel tube). Simcyp models returned similar values to reach a plateau at 0.0079 l · h−1 · kg−1 (well stirred, Fig. 3C; parallel tube, Fig. 3D). The 90th percentile of clearance was reached at 2.6 years (well stirred) and at 2.5 years (parallel tube). Normalized pooled adult clearances were 0.0070 l · h−1 · kg−1 for allometric scaling and 0.0064 l · h−1 · kg−1 for Simcyp scaling.
TABLE 1.
Summary table for modeled clearance values
Clearances are expressed as l · h−1 · kg−1.
| Parameter | Well Stirred |
Parallel Tube |
||
|---|---|---|---|---|
| Allometric | Simcyp | Allometric | Simcyp | |
| UGT1A1 clearance | ||||
| Normalized adult clearance | 0.0070 | 0.0079 | 0.0070 | 0.0079 |
| R2 | 0.0131 | 0.0077 | 0.0131 | 0.0076 |
| 95% CI of adult clearance | 0.0058, 0.0082 | 0.0063, 0.0095 | 0.0058, 0.0082 | 0.0063, 0.0095 |
| Age within 90% of adult | 3.0 years | 2.6 years | 2.8 years | 2.5 years |
| Weighted sum-of-squares | 0.0034 | 0.0058 | 0.0035 | 0.0059 |
| Sy.x | 0.0049 | 0.0064 | 0.0049 | 0.0064 |
| UGT1A6 clearance | ||||
| Normalized adult clearance | Not converged | 0.3524 | Not converged | Ambiguous |
| R2 | 0.0686 | |||
| 95% CI of adult clearance | 0.3149, 0.3900 | |||
| Age with 90% of adult | 12.6 months | |||
| Weighted sum-of-squares | 2.182 | |||
| Sy.x | 0.1548 | |||
Fig. 3.

The development of hepatic bilirubin clearance for UGT1A1 in pediatric liver. A, the development using the well stirred model with allometric scaling. Apparent adult clearance reached a plateau at 0.0070 l · h−1 · kg−1. The 90th percentile of adult clearance was reached at 3.0 years of age. B, the development using the parallel-tube model with allometric scaling. Apparent adult clearance reached a plateau at 0.0070 l · h−1 · kg−1. The 90th percentile of adult clearance was reached at 2.8 years of age. C, the development using the Simcyp and well stirred model. The model showed a similar plateau at 0.0079 l · h−1 · kg−1. The 90th percentile of adult clearance was reached at 2.6 years. D, the development using the Simcyp and parallel-tube model. Clearance reached a plateau at 0.0079 l · h−1 · kg−1. The 90th percentile of adult clearance was reached at 2.5 years. Allometric models are represented by ● and solid lines, whereas Simcyp pediatric models are ○ and dashed lines. Pooled adult clearance is shown as the dotted lines. The model is unweighted and constrained by medium convergence criteria requiring five consecutive iterations of the fit to change the sum-of-squares by less than 0.0001%, and any outlier is removed as determined by the residuals.
In contract, UGT1A6 increased to adult levels approximately 1 year after birth. Both allometric models (Fig. 4, A and B) and Simcyp parallel-tube model (Fig. 4D) did not converge. The normalized adult clearance for the Simcyp well stirred model peaked at 0.3524 l · h−1 · kg−1 (Fig. 4C). The 90th percentile of clearance was reached at 12.6 months, approximately the same age at which the enzyme matures (14 months). Normalized pooled adult clearances were 0.035 l · h−1 · kg−1 for allometric scaling and 0.033 l · h−1 · kg−1 for Simcyp scaling.
Fig. 4.

The development of hepatic serotonin clearance for UGT1A6 in pediatric liver. A, the development using the well stirred model with allometric scaling. B, the development using the parallel-tube model with allometric scaling. C, the development using the Simcyp and well stirred model. This was the only model to converge. Clearance reached a plateau at 0.3524 l · h−1 · kg−1. The 90th percentile of adult clearance was reached at 12.6 months. D, the development using the Simcyp and parallel-tube model. Allometric models are represented by ●, whereas Simcyp pediatric models are ○ and dashed lines. Pooled adult clearances are shown as the dotted lines. The model is unweighted and constrained by medium convergence criteria requiring five consecutive iterations of the fit to change the sum-of-squares by less than 0.0001%, and any outlier is removed as determined by the residuals.
Discussion
The major finding here is that UGT1A1 and 1A6 activities develop at different rates in the pediatric liver. The results for UGT1A1 are similar to, and supported by, published studies into UGT1A4 (Miyagi and Collier, 2007) and 2B7 (Zaya et al., 2006). In this study, the in silico models indicate that UGT1A1 enzyme activity is present, but it is very low at birth and increases to a plateau after 3.8 months. In contrast, UGT1A6 has comparatively higher activity at birth and increased to adult levels at 14 months. Both findings are consistent with previous laboratory and clinical studies (Kawade and Onishi, 1981; Burchell et al., 1989). Despite activity differences, age-related changes in UGT1A1 and 1A6 proteins were not observed, and enzyme activities did not correlate with protein levels. Again, this is similar to an earlier study demonstrating that UGT1A1 and 1A6 had similar mRNA and protein expression between toddlers (6–24 months) and adults but significantly different glucuronidation activities for several pan-specific substrates (Strassburg et al., 2002). Interestingly, these results in UGT1A isoforms contrast with the current knowledge regarding ontogeny of UGT2B, where for UGT2B7 protein expression and activity correlate (Zaya et al., 2006).
Aside from UGTs, similar findings have been reported for other pediatric liver enzymes including P450s 2C9, 2C19, and 3A4 (Hines, 2007) and carboxylesterases 1 and 2 (Pope et al., 2005). Many of these Phase I enzymes seem to be transcriptionally regulated. However, because UGT1A enzyme activity and protein expression did not correlate with each other herein or in a previous report (Strassburg et al., 2002), it is possible that posttranslational modification regulates UGT ontogeny. Comparatively little is known about the structure-function relationships of UGTs than other metabolizing enzymes, in part because a crystal structure has not been elucidated yet. One important study shows that a specific glycosylation site on UGT2B15 and 2B20 is critical for modulating activity (Barbier et al., 2000). A similar site/mechanism and associated developmental signal may account for changes in other isoforms' catalytic activity after birth, such as those observed herein.
As an alternative, it was demonstrated that adenosine-related nucleotides inhibit rat UGT activity, an allosteric mechanism that may also be relevant for developmental signaling (Nishimura et al., 2007). There is further support for this mechanism in humans because the naturally occurring soy compound daidzein has been shown to allosterically increase human hepatic UGT1A1 activity (Pfeiffer et al., 2005). Allosteric signaling would allow UGT protein expression to remain steady throughout childhood but enzyme activity to vary, based on intracellular development and/or levels of signaling molecules.
An acknowledged limitation of this study is that the data herein are derived from only postnatal samples. Despite this, some evidence that UGT activity exists at birth for both UGT1A1 and 1A6 is presented because our models do not converge to 0. Instead, the modeled activities indicate that UGT1A1 at birth may be very low (in the order of 1/1000 of adult activity) or, for 1A6, more than 50% of adult activity levels, and this result is consistent with previous studies (Burchell et al., 1989). Therefore, it would be useful for future work to determine the molecular mechanisms behind enzyme maturation to adult activities because purely transcriptional activation seems unlikely.
Beyond enzymology, when UGT1A6 hepatic clearances were scaled and normalized, maximal clearance did not occur until 1 year of age. This coincides with the age of enzyme maturation at 14 months. Although the modeled UGT1A1 clearance was higher at birth and decreased to adult levels after 2 to 3 years of age, this should be interpreted with caution because the results are in contrast to enzyme maturation and may be an artifact of our small sample size in the age ranges from 0 to 6 months. In addition, the regression used may not accurately model the fast maturation of UGT1A1 with so few samples, so correct interpretation could also be that full clearance capacity develops almost immediately after birth.
Because most chemicals are cleared by multiple enzymes, studying a single enzyme may not give an accurate picture of whole-body metabolism and clearance. For example, acetaminophen is metabolized by UGT1A1, 1A6, and 1A9 and sulfotransferases directly (95% of metabolism) and also by P450s, followed by sulfotransferases and glutathione transferases (5% of clearance). For acetaminophen, clearance matures at approximately 2 years of age, because of inherent redundancy and promiscuity in hepatic metabolism (Anderson and Holford, 2009). Despite this result, the data presented may be clinically significant for drugs primarily or exclusively metabolized by a single enzyme. This is a clinical issue for pediatric drug administration, such as the use of morphine (that is metabolized only by UGT1A3 and 2B7) in neonates (Knibbe et al., 2009). A caveat to making absolute statements regarding UGT development and clinical clearances derived from this work is that, although scaling for P450 activities from in vitro to whole-body clearance has been relatively accurate, scaling of UGT data is usually vastly underpredictive (Miners et al., 2006). Hence, in vitro scaling attempts should be compared with clinical observations for correctness and also used to develop a greater accuracy and predictivity of UGT scaling.
With regard to our scaling approaches, the allometric model to three-forths power scaling was chosen because it has been shown that this is generally superior to scaling by using the body surface area (Anderson and Holford, 2009). Moreover, the Simcyp model was used because of our desire to use a physiologically based approach to pharmacokinetic scaling and to compare this to purely mathematical pharmacokinetics. Of the several commercial models that exist, Simcyp is the one we have available and has been used in the past to evaluate pediatric scaling (Johnson et al., 2006). Comparison of the models is important to assess whether the physiologically based pharmacokinetic approach is superior for all data types and to refine mathematical algorithms.
The current article also makes an interesting contribution to existing knowledge because a maturational component has been added. This maturation component cannot be described by allometry alone when predicting pediatric clearances from adult data (Anderson and Holford, 2009). Increases in enzyme activity per gram of microsomal protein have been reported herein and elsewhere, and at least one author has postulated an increase in MPPGL (Barter et al., 2008). This seems sensible, although the developmental mechanisms of this, and indeed its occurrence, have not been well measured. Although small, this is the first report of the development of UGT1A1 and 1A6 in normal pediatric livers from the neonate (13 days) to adult (20 years of age) that also includes scaled, normalized hepatic clearances and comparisons of pharmacokinetic and physiologically based pharmacokinetic models. The findings presented support and are supported by previous publications that have taken a more general approach using pan-specific antibodies and biochemical substrates. Furthermore, positive controls in these experiments used pooled adult microsomes from 200 human donors to define “adult” levels of activity; this is a useful and robust internal control because interindividual variation in glucuronidation activity can be high. In addition, because the pooled adult samples contained an equal number of males and females and ranged from 17 to 78 years, gender and age biases in the “positive adult control” were minimized, including any differential hormonal effects on enzyme expression and activities. This result is similar for the pediatric liver samples assessed that contained 15 female and 35 males across all age ranges. Finally, although we did not specifically determine polymorphisms of UGT1A1 or 1A6 in these samples, the calculated clearances presented will be inclusive of polymorphic variations and true estimates of the population variability.
In summary, this study is not only important from a basic biology/pharmacology standpoint, but also from medical, environmental, and regulatory perspectives. Medications are already prescribed that have not been studied adequately for safety in pediatric medicine, and, as diseases of childhood continue to move from acute to chronic etiologies, this trend will only increase. In addition, regulatory bodies are increasingly requested to raise pediatric exposure limits and safety levels for environmental chemicals, commonly without good human data. Studies such as these can contribute by describing pediatric development and also by providing a relevant framework for the understanding of developmental physiology and pharmacology. This approach can improve the understanding of childhood development, environmental safety, and pediatric medicine.
Acknowledgments
We thank Dr. Jon-Paul Bingham (Department of Molecular Biosciences and Bioengineering, University of Hawaii at Mānoa) for gracious assistance in providing laboratory space, implements, and assistance for the chemical synthesis of ethyl anthranilate.
This work was supported by the National Institutes of Health National Center for Research Resources [Grant RR024206] (Project 4); and the Alana Dung Foundation [Grant 124-8090-4].
Article, publication date, and citation information can be found at http://dmd.aspetjournals.org.
doi:10.1124/dmd.110.037192.
- P450
- cytochrome P450
- ELISA
- enzyme-linked immunosorbent assay
- fu
- fraction unbound
- MPPGL
- microsomal protein per gram liver
- Sy.x
- S.E. of estimate
- UGT
- UDP-glucuronosyltransferase
- CI
- confidence interval.
Authorship Contributions
Participated in research design: Miyagi and Collier.
Conducted experiments: Miyagi and Collier.
Contributed new reagents or analytic tools: Miyagi, Collier, and Bingham.
Performed data analysis: Miyagi and Collier.
Wrote or contributed to the writing of the manuscript: Miyagi and Collier.
Other: Collier acquired funding for the research.
References
- Anderson BJ, Holford NH. (2009) Mechanistic basis of using body size and maturation to predict clearance in humans. Drug Metab Pharmacokinet 24:25–36 [DOI] [PubMed] [Google Scholar]
- Barbier O, Girard C, Breton R, Bélanger A, Hum DW. (2000) N-Glycosylation and residue 96 are involved in the functional properties of UDP-glucuronosyltransferase enzymes. Biochemistry 39:11540–11552 [DOI] [PubMed] [Google Scholar]
- Barter ZE, Chowdry JE, Harlow JR, Snawder JE, Lipscomb JC, Rostami-Hodjegan A. (2008) Covariation of human microsomal protein per gram of liver with age: absence of influence of operator and sample storage may justify interlaboratory data pooling. Drug Metab Dispos 36:2405–2409 [DOI] [PubMed] [Google Scholar]
- Bock KW, Köhle C. (2005) UDP-glucuronosyltransferase 1A6: structural, functional, and regulatory aspects. Methods Enzymol 400:57–75 [DOI] [PubMed] [Google Scholar]
- Breyer-Pfaff U, Fauss C, Böhne HP. (1989) Serum albumin stimulates serotonin uptake into human blood platelets. Life Sci 44:1251–1258 [DOI] [PubMed] [Google Scholar]
- Burchell B, Coughtrie M, Jackson M, Harding D, Fournel-Gigleux S, Leakey J, Hume R. (1989) Development of human liver UDP-glucuronosyltransferases. Dev Pharmacol Ther 13:70–77 [DOI] [PubMed] [Google Scholar]
- Burchell B, Soars M, Monaghan G, Cassidy A, Smith D, Ethell B. (2000) Drug-mediated toxicity caused by genetic deficiency of UDP-glucuronosyltransferases. Toxicol Lett 112:333–340 [DOI] [PubMed] [Google Scholar]
- Ciotti M, Cho JW, George J, Owens IS. (1998) Required buried alpha-helical structure in the bilirubin UDP-glucuronosyltransferase, UGT1A1, contains a nonreplaceable phenylalanine. Biochemistry 37:11018–11025 [DOI] [PubMed] [Google Scholar]
- Collier AC, Ganley NA, Tingle MD, Blumenstein M, Marvin KW, Paxton JW, Mitchell MD, Keelan JA. (2002) UDP-glucuronosyltransferase activity, expression and cellular localization in human placenta at term. Biochem Pharmacol 63:409–419 [DOI] [PubMed] [Google Scholar]
- Coughtrie MW, Burchell B, Leakey JE, Hume R. (1988) The inadequacy of perinatal glucuronidation: immunoblot analysis of the developmental expression of individual UDP-glucuronosyltransferase isoenzymes in rat and human liver microsomes. Mol Pharmacol 34:729–735 [PubMed] [Google Scholar]
- Court MH. (2005) Isoform-selective probe substrates for in vitro studies of human UDP-glucuronosyltransferases. Methods Enzymol 400:104–116 [DOI] [PubMed] [Google Scholar]
- Heirwegh KP, Van de Vijver M, Fevery J. (1972) Assay and properties of dititonin-activated bilirubin uridine diphosphate glucuronyltransferase from rat liver. Biochem J 129:605–618 [DOI] [PMC free article] [PubMed] [Google Scholar]
- Hines RN. (2007) Ontogeny of human hepatic cytochromes P450. J Biochem Mol Toxicol 21:169–175 [DOI] [PubMed] [Google Scholar]
- Houston JB. (1994) Utility of in vitro drug metabolism data in predicting in vivo metabolic clearance. Biochem Pharmacol 47:1469–1479 [DOI] [PubMed] [Google Scholar]
- Humburger S, Hahn W. (1972) inventors; Farbenfabriken Bayer Aktiengesellschaft, assignee. Process for the preparation of isatoic anhydride. U.S. patent 3687951 1972 Aug 29
- Impicciatore P, Choonara I, Clarkson A, Provasi D, Pandolfini C, Bonati M. (2001) Incidence of adverse drug reactions in paediatric in/out-patients: a systematic review and meta-analysis of prospective studies. Br J Clin Pharmacol 52:77–83 [DOI] [PMC free article] [PubMed] [Google Scholar]
- Johnson TN, Rostami-Hodjegan A, Tucker GT. (2006) Prediction of the clearance of eleven drugs and associated variability in neonates, infants and children. Clin Pharmacokinet 45:931–956 [DOI] [PubMed] [Google Scholar]
- Kawade N, Onishi S. (1981) The prenatal and postnatal development of UDP-glucuronyltransferase activity towards bilirubin and the effect of premature birth on this activity in the human liver. Biochem J 196:257–260 [DOI] [PMC free article] [PubMed] [Google Scholar]
- Knibbe CA, Krekels EH, van den Anker JN, DeJongh J, Santen GW, van Dijk M, Simons SH, van Lingen RA, Jacqz-Aigrain EM, Danhof M, et al. (2009) Morphine glucuronidation in preterm neonates, infants and children younger than 3 years. Clin Pharmacokinet 48:371–385 [DOI] [PubMed] [Google Scholar]
- Krishnaswamy S, Duan SX, Von Moltke LL, Greenblatt DJ, Court MH. (2003) Validation of serotonin (5-hydroxtryptamine) as an in vitro substrate probe for human UDP-glucuronosyltransferase (UGT) 1A6. Drug Metab Dispos 31:133–139 [DOI] [PubMed] [Google Scholar]
- McNamara PJ, Alcorn J. (2002) Protein binding predictions in infants. AAPS PharmSci 4:E4. [DOI] [PMC free article] [PubMed] [Google Scholar]
- Miller MR, Elixhauser A, Zhan C. (2003) Patient safety events during pediatric hospitalizations. Pediatrics 111 (6 Pt 1):1358–1366 [DOI] [PubMed] [Google Scholar]
- Miners JO, Knights KM, Houston JB, Mackenzie PI. (2006) In vitro-in vivo correlation for drugs and other compounds eliminated by glucuronidation in humans: pitfalls and promises. Biochem Pharmacol 71:1531–1539 [DOI] [PubMed] [Google Scholar]
- Miyagi SJ, Collier AC. (2007) Pediatric development of glucuronidation: the ontogeny of hepatic UGT1A4. Drug Metab Dispos 35:1587–1592 [DOI] [PubMed] [Google Scholar]
- Nagar S, Blanchard RL. (2006) Pharmacogenetics of uridine diphosphoglucuronosyltransferase (UGT) 1A family members and its role in patient response to irinotecan. Drug Metab Rev 38:393–409 [DOI] [PubMed] [Google Scholar]
- Nishimura Y, Maeda S, Ikushiro S, Mackenzie PI, Ishii Y, Yamada H. (2007) Inhibitory effects of adenine nucleotides and related substances on UDP-glucuronosyltransferase: structure-effect relationships and evidence for an allosteric mechanism. Biochim Biophys Acta 1770:1557–1566 [DOI] [PubMed] [Google Scholar]
- Ostrow JD, Pascolo L, Shapiro SM, Tiribelli C. (2003) New concepts in bilirubin encephalopathy. Eur J Clin Invest 33:988–997 [DOI] [PubMed] [Google Scholar]
- Pfeiffer E, Treiling CR, Hoehle SI, Metzler M. (2005) Isoflavones modulate the glucuronidation of estradiol in human liver microsomes. Carcinogenesis 26:2172–2178 [DOI] [PubMed] [Google Scholar]
- Pope CN, Karanth S, Liu J, Yan B. (2005) Comparative carboxylesterase activities in infant and adult liver and their in vitro sensitivity to chlorpyrifos oxon. Regul Toxicol Pharmacol 42:64–69 [DOI] [PubMed] [Google Scholar]
- Radominska-Pandya A, Czernik PJ, Little JM, Battaglia E, Mackenzie PI. (1999) Structural and functional studies of UDP-glucuronosyltransferases. Drug Metab Rev 31:817–899 [DOI] [PubMed] [Google Scholar]
- Richard K, Hume R, Kaptein E, Stanley EL, Visser TJ, Coughtrie MW. (2001) Sulfation of thyroid hormone and dopamine during human development: ontogeny of phenol sulfotransferases and arylsulfatase in liver, lung, and brain. J Clin Endocrinol Metab 86:2734–2742 [DOI] [PubMed] [Google Scholar]
- Schillie SF, Shehab N, Thomas KE, Budnitz DS. (2009) Medication overdoses leading to emergency department visits among children. Am J Prev Med 37:181–187 [DOI] [PubMed] [Google Scholar]
- Staiger RP, Miller EB. (1959) Isatoic anhydride. IV. Reactions with various nucleophiles. J Org Chem 24:1214–1219 [Google Scholar]
- Strassburg CP, Strassburg A, Kneip S, Barut A, Tukey RH, Rodeck B, Manns MP. (2002) Developmental aspects of human hepatic drug glucuronidation in young children and adults. Gut 50:259–265 [DOI] [PMC free article] [PubMed] [Google Scholar]
- Wang Y, Moss J, Thisted R. (1992) Predictors of body surface area. J Clin Anesth 4:4–10 [DOI] [PubMed] [Google Scholar]
- de Wildt SN, Kearns GL, Leeder JS, van den Anker JN. (1999) Cytochrome P450 3A: ontogeny and drug disposition. Clin Pharmacokinet 37:485–505 [DOI] [PubMed] [Google Scholar]
- Williams JA, Hyland R, Jones BC, Smith DA, Hurst S, Goosen TC, Peterkin V, Koup JR, Ball SE. (2004) Drug-drug interactions for UDP-glucuronosyltransferase substrates: a pharmacokinetic explanation for typically observed low exposure (AUCi/AUC) ratios. Drug Metab Dispos 32:1201–1208 [DOI] [PubMed] [Google Scholar]
- Zaya MJ, Hines RN, Stevens JC. (2006) Epirubicin glucuronidation and UGT2B7 developmental expression. Drug Metab Dispos 34:2097–2101 [DOI] [PubMed] [Google Scholar]
- Zhang D, Wang L, Chandrasena G, Ma L, Zhu M, Zhang H, Davis CD, Humphreys WG. (2007) Involvement of multiple cytochrome P450 and UDP-glucuronosyltransferase enzymes in the in vitro metabolism of muraglitazar. Drug Metab Dispos 35:139–149 [DOI] [PubMed] [Google Scholar]