Abstract
Quantifying the correlation length of the tissue microstructure has shown potential for differentiating between benign and malignant tumors. To implement these advances in the clinic, the total frequency-dependent attenuation along the propagation path must be determined on a patient specific basis. Previously, an algorithm was developed to estimate this attenuation using echoes from multiple sources. In this study, the developed algorithm was extended to echoes from a single source by filtering the echoed signal into multiple frequency bands. This step was needed because it would be challenging to scan exactly the same tissue region using multiple sources in the clinic. Computer simulations and phantom experiments were conducted to verify the attenuation could be determined by filtering the echoes from a single source. The simulations utilized a spherically focused single-element source (5 cm focal length, f/4, 14 MHz center frequency, 50% bandwidth) exposing a homogeneous tissue region (Gaussian scattering structures with effective radii of 5 to 55 μm at a density of 250/mm3, attenuation of 0.1 to 0.9 dB/cm·MHz). The phantom experiments utilized a spherically focused single-element source (5.08 cm focal length, f/4, 7.5 MHz center frequency) exposing a 0.5 dB/cm·MHz homogeneous glass bead phantom. The computer simulations and phantom experiment confirmed that the total attenuation along the propagation path can be determined by appropriately applying multiple filters to the backscattered echoes from a single source.
I. Introduction
Quantifying the tissue microstructure scattering correlation length by processing ultrasound echoes from tissue regions of interest has shown potential for improving many areas of diagnostic ultrasound [1]-[6]. When quantifying the tissue microstructure, the backscattered power spectrum from the tissue region of interest (ROI) is first compared with the backscattered power spectrum of a known target in order remove the transmission/filtering characteristics of the ultrasound source. Then, the impact of the frequency-dependent attenuation along the propagation path leading up to the ROI is removed, leaving only the backscatter coefficient as a function of frequency. The backscatter coefficient can then be compared with an assumed model for the tissue scattering, yielding an effective scatterer diameter and acoustic concentration which can be used to quantify the scattering within a particular region. If the attenuation along the propagation path is not correctly included, then the backscatter coefficients and subsequent estimates of scatterer diameter and acoustic concentration are meaningless. Therefore, to quantify the tissue microstructure, the total frequency-dependent attenuation along the propagation path must be accurately determined. Determination of the total attenuation is difficult because both attenuation and scatterer correlation length modify the backscattered power spectrum [2], [7]
Previously, many different approaches have been utilized to determine the attenuation along the propagation path. Some have restricted their analysis to time domain methods by quantifying only the change in backscatter with propagation depth [8], [9], but these approaches assume that the tissue is homogeneous whereas real tissue is largely inhomogeneous. Others have attempted to estimate the total attenuation by first decomposing the tissue into smaller homogeneous regions, estimating the local attenuation within each region, and then summing these attenuations weighted by the length of each homogeneous region to obtain an estimate of the total attenuation [10], [11]. Unfortunately, summing estimates of the local attenuation is challenging because of the large, locally homogenous region sizes needed to accurately estimate the local attenuation (~30 to 50λ) [12], [13]. Furthermore, the process is highly computationally intensive and prone to errors as the errors can accumulate with increasing propagation depth. Another approach that has been attempted, termed the spectral fit algorithm, involves simultaneously estimating both scatterer correlation length and total attenuation from backscattered ultrasound echoes [7], [14], [15], but this approach is highly dependent on having the correct model for tissue scattering.
Recently, a new algorithm [16], [17] was developed that estimated the total attenuation along the propagation path by processing echoes from multiple sources used to scan the same tissue region. The algorithm only needed echoes from a single ROI to obtain an estimate of the total attenuation between the source and the ROI, even though the algorithm did not assume that the tissue was homogeneous between the source and the ROI. Furthermore, the algorithm was only weakly dependent on the scattering properties of the tissue, making it much more robust than the spectral fit algorithm. However, the new algorithm still had several shortcomings. Namely, the algorithm required multiple ultrasound sources, limiting its future clinical utility because it would be challenging to scan the same tissue region with multiple ultrasound sources. Therefore, the goal of this study was to address these shortcomings and develop a more robust and clinically implementable algorithm. In this paper, the algorithm will be derived for implementation using a single ultrasound source and computer simulations will be utilized to find the dependence of the single source (SS) algorithm on ROI size. Lastly, the SS algorithm will be verified using echoes obtained from a tissue-mimicking phantom.
II. Derivation of SS Algorithm
Previously, we derived an algorithm for estimating the slope of the total attenuation along the propagation path assuming a linear dependence on frequency and demonstrated that the algorithm yielded accurate results in computer simulations [16], [17]. One difficulty in implementing the algorithm, however, is that it requires scanning the same tissue region with multiple single-element spherically focused sources. Because this would be difficult to achieve in vivo, we re-derive the algorithm in this section by applying multiple Gaussian-shaped filtering functions to the echoes from a single source.
Our original algorithm was derived by first assuming that the backscattered power spectrum returned from a tissue region was approximately Gaussian. Therefore, after correcting for local attenuation and diffraction effects in the scattering region, the backscattered power spectrum would be given by [16], [17]
| (1) |
where is the expected spectral peak frequency and is the bandwidth of the backscattered spectrum. In this equation, k is the wave number, αo is the effective attenuation coefficient for the intervening tissue layers between the ultrasound source and the ROI, and zT is the distance between the aperture plane of the source and the ROI. |Vplane(f)|2 is the backscattered power spectrum that would be returned from a rigid plane placed at the focal plane in a water bath and captures the power spectrum of the transmitted signal and the frequency response of the ultrasound source. Because the backscattered power spectrum is assumed to be Gaussian, . The final term in the equation, F(ω,aeff), is the form factor that describes the frequency dependence of the backscatter and is related to the tissue microstructure [2], [18]. F(ω,aeff) has been shown to be approximately proportional to exp(−Afn) for most scattering models where A ~ (2πaeff/c)n with aeff being the effective radius of the tissue microstructure, c being the speed of sound in the tissue, and n ≅ 2 [17]. Therefore, as was shown in [16], [17], and are given by
| (2) |
Hence, depends on both the attenuation along the propagation path and the frequency dependence of the backscatter, whereas only depends on the scattering.
After applying a Gaussian filter, the backscattered power spectrum from (1) is given by
| (3) |
where fc and correspond to the center frequency and bandwidth of the filter, respectively. Eq. (3) can be simplified by multiplying out the terms in the exponent and removing any terms that are constants with respect to frequency, yielding
| (4) |
Recombining the terms in the exponent in (4) yields
| (5) |
where
| (6) |
Similarly, the reference spectrum obtained from the echoes from a rigid plane placed at the focal plane after applying the filter is given by
| (7) |
A rigid plane is the simplest reference target for spherically focused transducers, but other references, such as a tissue-mimicking phantom with known scattering and attenuation properties, could also be used. The expression in (7) can be simplified by combining the exponents and keeping only the frequency-dependent terms to preserve the proportionality as was done previously, yielding
| (8) |
where
| (9) |
When implementing our algorithm with multiple sources, we found the attenuation by finding the downshift in spectral peak frequency between the backscattered power spectrum from the tissue and the backscattered power spectrum from our reference (i.e., ). Therefore, when implementing the algorithm using filtering, the downshift in spectral peak frequency between the filtered spectrum from the tissue and the filtered spectrum from the reference needs to be determined. This downshift is given by
| (10) |
To simplify (10), we can show that the filtered bandwidth from the reference, , is related to the filtered bandwidth from the tissue, , by
| (11) |
where we have only kept the first-order terms in as was done previously [16], [17]. The higher-order terms can be neglected because is on the order of (koaeff · (BWsource/100))2, where ko is the wave number for the center frequency of the transducer and BWsource is the percent bandwidth of the source. Because the frequency dependence of backscattered echoes is dominated by scattering structures with koaeff < 1 and BWsource < 50% for most sources, , allowing the higher-order terms to be ignored. Using this approximation, (10) becomes
| (12) |
If we then substitute in , found previously, and continue to neglect higher-order terms in , (12) can be simplified to yield
| (13) |
which is very similar to the expression found previously, for which multiple single-element sources were used to find the total attenuation [16], [17]. Therefore, applying multiple filters to a single source is effectively the same as scanning the same tissue with multiple sources, allowing us to implement our algorithm on a single source.
III. Computer Simulation Results Validating SS Algorithm
The implementation of our algorithm using a single source was initially validated using echoes from a 14-MHz, 50% −3 dB bandwidth on transmit, spherically focused source with a 5 cm focal length and an f-number of 4. The source exposed a homogeneous half-space with a sound speed of 1540 m/s and attenuation between 0.1 and 0.9 dB/cm·MHz so that we could assess the dependence of the algorithm on attenuation. The scattering structures within each half-space had Gaussian correlation functions—that is, form factor of Fγ(f,aeff) = e(−0.827(kaeff)2)—with an aeff from 5 to 55 μm and were positioned at a density of 250/mm3 (~5 scatterers per resolution cell for a 14-MHz transducer). Each half-space had a constant attenuation and a single scatterer size. The spectral peak frequency of the echoes received by this source was approximately 6 to 13 MHz depending on the attenuation of the half-space.
In these initial simulations, a total of 3 Gaussian filtering functions were applied to the power spectra spanning the entire usable frequency range. The center frequencies, fc, for these filters were determined automatically by the code from
| (14) |
where fmax and fmin correspond to the largest and smallest frequencies in the −20 dB bandwidth of the received power spectrum. Once the values of fc were set, the bandwidths of the filters, , were determined by finding the percent bandwidth that resulted in fmin corresponding to the smallest −10 dB frequency for the first filter. All of the filters then used the same percent bandwidth. For each filter,
| (15) |
was calculated. In addition,
| (16) |
was also found from for the unfiltered spectrum, providing 4 distinct values ξ which could be used to find αo. The selection of the number of filters applied and the determination of the percent bandwidth of the filters (i.e., fmin corresponding to −10 dB frequency for first filter) was not optimized in this study, because our goal was to only demonstrate the feasibility of the algorithm. It may be possible to further improve the performance of the algorithm by optimizing these parameters in the future.
Also, to reduce the impact of deviations of the spectra from the Gaussian approximation away from the spectral peak, the spectra from the reference and the tissue were aligned by initially finding an approximate value for the attenuation given by [17]
| (17) |
The reference power spectrum was then multiplied by exp(−4αguesszTf) so that the spectral peaks of the sample and the reference would be in the same frequency bands. The intermediate step of first finding an approximate value for the attenuation reduces the impact of variations in spectral shape from the Gaussian approximation.
When we first developed our algorithm for multiple sources, we found that the optimal window length (i.e., spatial resolution) was 4.36 mm for our frequency range and the optimal number of power spectra to average to estimate E[|Vscat(f)|2]compensated was 25 [16]. However, a single source cannot cover the same bandwidth as multiple sources, resulting in less information being available for the algorithm. Therefore, we decided to re-determine the optimal window length and number of echoes for our SS algorithm. The optimization was done using 1000 echoes from the simulated half-spaces with attenuations from 0.1 to 0.9 dB/cm·MHz and an effective scatterer radius of 25 μm. Initially, the number of independent RF echoes used to determine E[|Vscat(f)|2]compensated was set to 100 and the window length used to gate the echoes was varied from 2.2 to 8.8 mm, as shown in Fig. 1. The precision of the SS algorithm is fairly constant with increasing window length, whereas the accuracy continues to improve until stabilizing around 6 mm. Therefore, we selected a window length of 6.6 mm, just past the stabilization point, as the optimal value for the remaining simulations. A window length of 6.6 mm corresponds to approximately 60λ at the 14 MHz spectral-peak transmit frequency of our source and corresponds to 26 to 56λ for the received signal depending on the attenuation of the half-space (recall that the spectral peak frequency varied from 6 to 13 MHz depending on the attenuation).
Fig. 1.
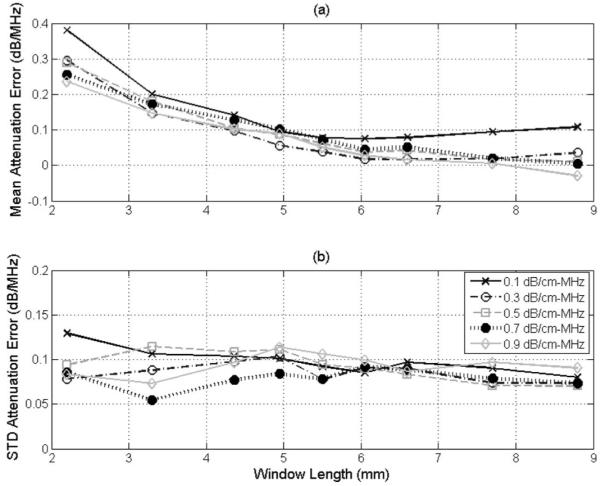
The (a) accuracy and (b) precision of the SS algorithm in decibels per megahertz versus window length used to gate the time domain waveforms for half-space attenuations of 0.1 to 0.9 dB/cm·MHz for a scatterer size of 25 μm when grouping the waveforms into sets of 100 when determining E[|Vscat(f)|2]compensated.
After determining the optimal window length, the number of echoes used to determine E[|Vscat(f)|2]compensated was varied from 10 to 100, with the results shown in Fig. 2. When varying the number of echoes, the accuracy of the algorithm is constant but the precision improves as the number of echoes increases. However, the improvement in precision is minimal after about 40 to 50 echoes, therefore 50 echoes was selected as the optimal value in the rest of the simulations.
Fig. 2.
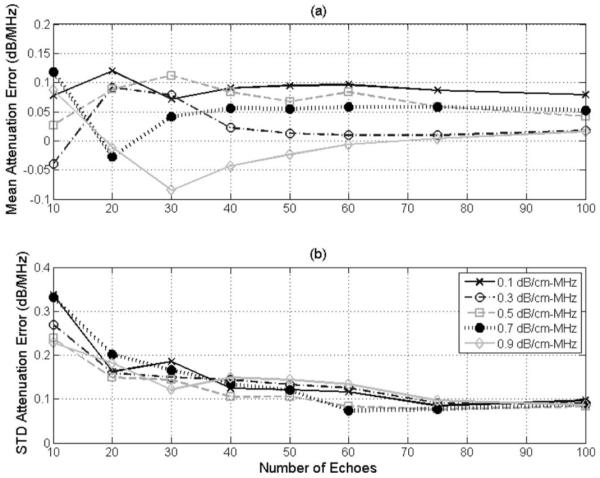
The (a) accuracy and (b) precision of the SS algorithm in decibels per megahertz versus the number of echoes used to determine E[|Vscat(f)|2]compensated for half-space attenuations of 0.1 to 0.9 dB/cm·MHz for a scatterer size of 25 μm when using a window length of 6.6 mm to gate the time-domain waveform.
After determining the optimal number of echoes and window length, the performance of the algorithm for varying scatterer sizes was determined by utilizing the echoes from the half-spaces with an attenuation of 0.5 dB/cm·MHz and scatterer effective radii from 5 to 55 μm. The accuracy and precision of the algorithm for these cases is shown in Fig. 3. The algorithm is able to accurately estimate the total attenuation slope independent of scatterer size. However, there is still a slight degradation in the accuracy of the algorithm as the scatterer size increases. This is likely caused by neglecting higher-order terms in , which is proportional to the square of scatterer size.
Fig. 3.
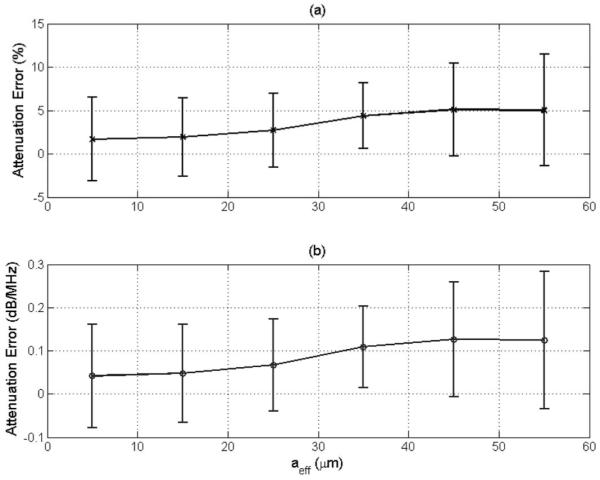
Plot of mean and standard deviation of error in attenuation slope in (a) percent and in (b) decibels per megahertz versus the effective radius of the scatterers in the half-space for the SS algorithm. The window length used in this simulation was 6.6 mm, and 50 independent echoes were used when estimating the power spectra. The error bars correspond to one standard deviation above and below the mean value.
IV. Tissue-Mimicking Phantom Experiment Validating SS Algorithm
After completing the computer simulations, phantom experiments were conducted using a single spherically focused transducer (Panemetrics-NDT Immersion Transducer, Olympus NDT Inc., Waltham, MA) to validate the algorithm. The ultrasound transducer had a focal length of 5.14 cm, as measured by maximizing the echoes received from a rigid plane in the focal region. The center frequency for the transducer was 7.5 MHz, as measured when the plane was placed at the focus. The pulse-echo data was obtained via a pulser/receiver (Panametrics Model 5900, Panametrics, Inc.,Waltham, MA) connected to an oscilloscope (DPO2014, Tektronix, Inc., Beaverton, OR) which saved the echoes to a computer. The computer also controlled a custom three-axis positioning system (Velmex, Inc., Bloomfield, NY) which scanned the transducer across the surface of the phantom in a raster scan pattern with a step size of 0.5 mm. The phantom used in the experiments was a standard GAMMEX 406 LE (Middleton, WI). The scattering targets in this phantom are glass beads (~160 beads/mm3) with a mean diameter of 35 μm embedded in a background material made from condensed milk and gel [19]. The 406 LE phantom has two different separated regions with attenuations of 0.5 and 0.7 dB/cm·MHz, as reported by the manufacturer and independently confirmed in previous experiments. In our current experiment, backscattered ultrasound echoes were only obtained from the 0.5-dB/cm·MHz region.
In the experiment, 500 echoes were obtained with the focus of the transducer positioned 2.23 cm into the phantom. This depth was selected so that none of the reverberations from the surface of the phantom would be in the focal region while insuring a reasonable signal-to-noise ratio (SNR) for our echoes. The SNR was found to quickly degrade as we moved the focus deeper into the phantom because of the relatively low power available from our pulser/receiver. The maximum excitation available from our 5900 is a 32 μJ impulse. To further improve our SNR, the echoes were averaged 512 times by the scope before being transferred to the computer during the scan. Our final SNR was approximately 34 dB, as determined by comparing the echo data from the phantom to the noise signal on the scope when the transducer was transmitting into a large water bath.
After obtaining the echoes, the data was windowed with a rectangular window centered at the focus and grouped into sets to yield estimates of the backscattered power spectrum. The width of the rectangular window was varied from 10 to 70λ (2.05 to 14.4 mm) in steps of 5λ where λ was the wavelength at 7.5 MHz (spectral-peak frequency for transducer) in the phantom. Recall that the optimal window length in our computer simulations was ~60λ. Initially, 50 echoes were combined in each set yielding 10 estimates for the power spectrum. Later, the number of echoes per set was reduced to experimentally determine the impact on the accuracy and the precision of the algorithm. After calculating the power spectrum, the spectra were corrected for focusing and local attenuation as has been described previously [18], [20], [21]. In addition, the spectra were also compensated for transmission through the acoustic window of the phantom using transmission coefficients reported in [22]. An example power spectrum received from the phantom using 50 echoes per set and a rectangular window size of 12.3 mm (~60λ) is shown in Fig. 4. In all of our power spectra from the phantom, we observed a secondary spectral peak around 1.5 MHz which is indicated the circle in Fig. 4. This sub-peak was not observed in our reference spectrum obtained by placing a rigid planar target in the focal plane and may be due to electrical interference from some unknown source in the building at the time of the experiment. Because the source of the sub-peak was not known and the peak was located at the edge of our usable spectrum, we decided to only use frequency values greater than 2.4 MHz in addition to our previous constraint of using only the −20 dB bandwidth of the received spectrum. Therefore, fmin was given by fmin = max([fmin]−20dB 2.4 MHz]) when processing the phantom data.
Fig. 4.
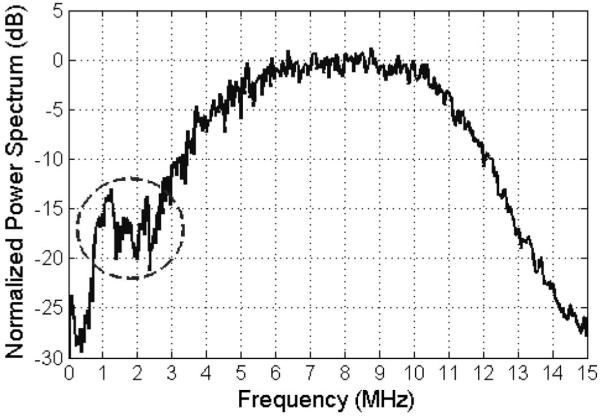
Example power spectrum from the phantom using a rectangular window of 12.3 mm (~60λ) and grouping the waveforms into sets of 50 when determining E[|Vscat(f)|2]compensated. The circle corresponds to a secondary spectral peak that was observed in all of our spectra from the phantom but was not present in our reference echoes obtained by placing a rigid plane in the focal plane.
The accuracy and precision of the SS algorithm when implemented with echoes from a tissue-mimicking phantom as a function of rectangular window length is shown in Fig. 5. There is an increase in both accuracy and precision with increasing window length. The improvement in accuracy (Fig. 5, solid curve) is very similar to the improvement observed previously in the computer simulations [Fig. 1(a)]. The improvement in precision with increasing window length observed in the phantom experiments (Fig. 5, error bars) but not the computer simulations [Fig. 1(b)] can possibly be attributed to the smaller number of echoes used to estimate the power spectrum in the phantom experiments when finding the optimal window length (i.e., 50 versus 100). Based on these results, a rectangular window length of 30λ (6.16 mm) was determined to be optimal in the phantom experiments.
Fig. 5.
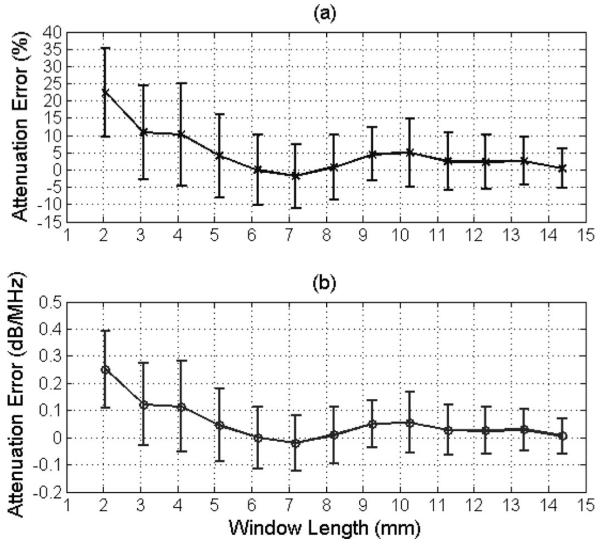
Plot of mean and standard deviation of error in attenuation slope in (a) percent and in (b) decibels per megahertz versus the rectangular window length used to gate the time-domain signals for echoes from the 0.5 dB/cm·MHz tissue-mimicking phantom with the focus of the transducer positioned 2.23 cm into the phantom using the SS algorithm. Fifty independent echoes were used when estimating the power spectra. The error bars correspond to one standard deviation above and below the mean value.
After determining the optimal window length, the number of echoes used to estimate the power spectrum in the lateral direction was varied from 5 to 50, with the impact on accuracy and precision shown in Fig. 6. There is a slight improvement in the accuracy and the precision of the estimates with increasing number of echoes, with the optimal value being about 40 to 50 echoes. Although the improvement in precision is expected based on the earlier computer simulations, the slight improvement in the mean with increasing number of echoes is surprising and warrants further study. Regardless, the optimal number of echoes is approximately the same in both the computer simulations and phantom experiments for our algorithm.
Fig. 6.
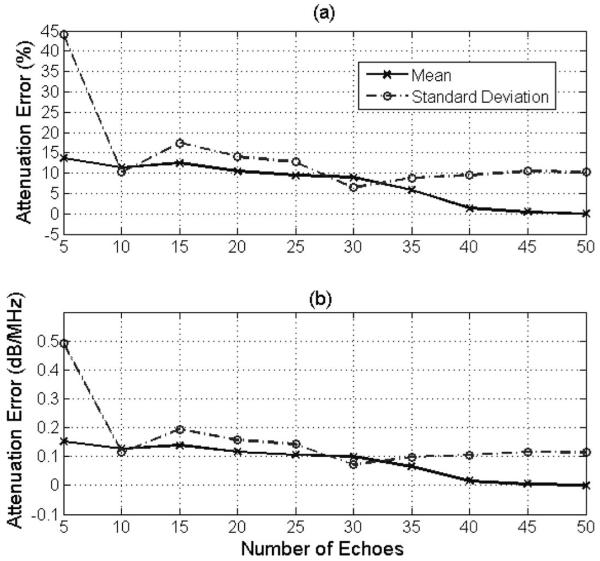
Plot of mean and standard deviation of error in attenuation slope in (a) percent and in (b) decibels per megahertz versus the number of echoes used to determine E[|Vscat(f)|2]compensated for the 0.5 dB/cm·MHz tissue-mimicking phantom with the focus of the transducer positioned 2.23 cm into the phantom using the SS algorithm. The rectangular window length used to gate the time-domain signals was 6.16 mm.
V. Discussion
In this paper, we modified an earlier algorithm for estimating total attenuation along the propagation path, which required multiple sources on backscattered echoes, so that it could be implemented using echoes from a single source. This was accomplished by applying multiple Gaussian filters to the backscattered echo data, effectively creating multiple virtual sources. The modified algorithm was then verified using computer simulations and phantom experiments. When using the optimal number of echoes to estimate the power spectrum and the optimal window length to restrict the echoes to a finite region of interest, the accuracy of the attenuation estimates was found to be better than 5% and the standard deviation of the estimates was found to be better than 10% in both the simulations and phantom experiments. Therefore, our algorithm can successfully determine the total attenuation along the propagation path using echoes from a single source, as would be the most conducive for clinical implementation.
When testing the algorithm, we observed that the optimal window size used to gate the time domain waveforms in the computer simulations was 60λ (6.6 mm), but the optimal window length in the phantom experiments was only 30λ (6.16 mm). Although the optimal window length in millimeters is similar, the length in wavelengths is very different. The apparent difference results because the important parameter when setting the window length is the length of the pulse, not the wavelength of the pulse. Fig. 7 shows the normalized pulses received from a rigid plane placed at the focal plane (i.e., reference echoes) for the transducer used in the simulations and the phantom experiments. Notice that both pulses have approximately the same length (~0.3 μs). Because the pulse lengths are the same, it makes sense that the optimal window lengths would also be the same (i.e., ~6 mm or 13 pulse lengths).
Fig. 7.
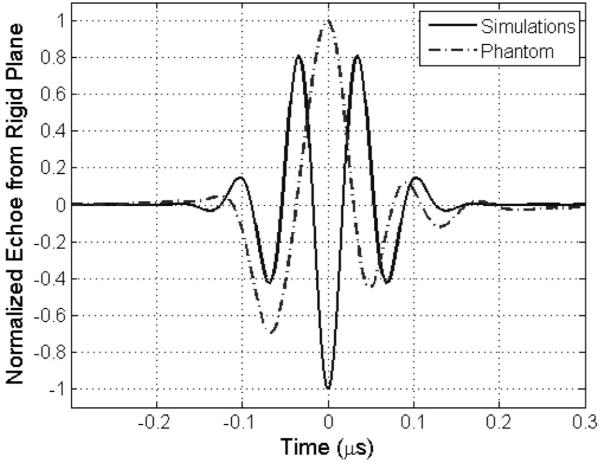
Normalized echoes received from a rigid plane placed at the focal plane (i.e., reference echoes) for the transducer simulated in the computer simulations and the transducer used in the phantom experiments.
Another surprising feature of both our computer simulations and our phantom experiments is the slight bias in the mean as the amount of data used to obtain the estimates is reduced. For example, in Figs. 1 and 5 the mean attenuation error increases with decreasing window length. This decrease does not correspond to spectral distortions caused by convolving the spectrum with the windowing function, because these distortions have been shown to only be significant for window lengths less than ~10λ [14], [21]. Therefore, further study is needed to determine the origin of this bias in the estimates with decreasing window length.
Although the algorithm presented in this study is performing well thus far, several concerns need to be evaluated before the algorithm can be implemented in the clinic. First, the algorithm needs to be modified and implemented on echoes using a clinical array as opposed to the single-element spherically focused sources used in this study. The main challenge when using arrays would be the need for a tissue-mimicking phantom as opposed to a rigid plane placed at the focal plane when acquiring a reference spectrum for the ultrasound source. Second, the algorithm assumes that the total attenuation along the propagation path is linearly dependent on frequency (i.e., αtotal ≅ αof + αb). The algorithm then finds the attenuation slope, αo, which is the only parameter needed in most tissue characterization applications. Although the linear approximation is valid over the bandwidth of most sources [23], the attenuation of tissue is inherently nonlinear. Therefore, the impact of a nonlinear frequency-dependent attenuation on the performance of the algorithm and subsequent tissue characterization applications needs to be evaluated. Lastly, the validation of the algorithm thus far has been with echoes with relatively high SNR (approximately 30 dB). Some of the echoes in clinical applications would have considerably poorer SNR, resulting in less usable bandwidth over which to apply the Gaussian filters and degrading the accuracy and the precision of the algorithm. This degradation with SNR should be quantified in the future.
Acknowledgments
This project was supported by Grant # R01 CA111289 from the National Institutes of Health as well as Iowa State University. The content is solely the responsibility of the author and does not necessarily represent the official views of the National Institutes of Health.
Biography
Timothy A. Bigelow graduated in May 2004 with a Ph.D. degree in electrical engineering from the University of Illinois at Urbana-Champaign, where he worked under Dr. William D. O’Brien, Jr. in the Bioacoustics Research Laboratory. After completing his education, he was a Visiting Assistant Professor in the Electrical and Computer Engineering Department at the University of Illinois at Urbana-Champaign for a year. Dr. Bigelow was then an Assistant Professor in Electrical Engineering at the University of North Dakota for three years prior to coming to Iowa State University in August 2008. Dr. Bigelow is an Assistant Professor with a joint appointment in Electrical/Computer Engineering and Mechanical Engineering at Iowa State University. His research interests focus on improving the diagnostic and therapeutic effectiveness of medical ultrasound. Specifically, he focuses on quantifying the physical properties of tissue using backscattered ultrasound signals, applying ultrasound induced cavitation to destroy unwanted cells, and exploring ultrasound-induced bioeffects for both ultrasound safety and ultrasound therapy applications.
References
- [1].Insana MF, Hall TJ. Parametric ultrasound imaging from backscatter coefficient measurements: Image formation and interpretation. Ultrason. Imaging. 1990;12(4):245–267. doi: 10.1177/016173469001200402. [DOI] [PubMed] [Google Scholar]
- [2].Insana MF, Wagner RF, Brown DG, Hall TJ. Describing small-scale structure in random media using pulse-echo ultrasound. J. Acoust. Soc. Am. 1990;87(1):179–192. doi: 10.1121/1.399283. [DOI] [PMC free article] [PubMed] [Google Scholar]
- [3].Lizzi FL, Greenebaum M, Feleppa EJ, Elbaum M, Coleman DJ. Theoretical framework for spectrum analysis in ultrasonic tissue characterization. J. Acoust. Soc. Am. 1983;73(4):1366–1373. doi: 10.1121/1.389241. [DOI] [PubMed] [Google Scholar]
- [4].Lizzi FL, Astor M, Liu T, Deng C, Coleman DJ, Silverman RH. Ultrasonic spectrum analysis for tissue assays and therapy evaluation. Int. J. Imaging Syst. Technol. 1997;8(1):3–10. [Google Scholar]
- [5].Oelze ML, O’Brien WD, Jr., Blue JP, Zachary JF. Differentiation and characterization of rat mammary fibroadenomas and 4T1 mouse carcinomas using quantitative ultrasound imaging. IEEE Trans. Med. Imaging. 2004;23(6):764–771. doi: 10.1109/tmi.2004.826953. [DOI] [PubMed] [Google Scholar]
- [6].Oelze ML, Zachary JF. Examination of cancer in mouse models using high-frequency quantitative ultrasound. Ultrasound Med. Biol. 2006;32(11):1639–1648. doi: 10.1016/j.ultrasmedbio.2006.05.006. [DOI] [PubMed] [Google Scholar]
- [7].Bigelow TA, Oelze ML, O’Brien WD., Jr. Estimation of total attenuation and scatterer size from backscattered ultrasound waveforms. J. Acoust. Soc. Am. 2005;117(3, pt. 1):1431–1439. doi: 10.1121/1.1858192. [DOI] [PubMed] [Google Scholar]
- [8].Tu H, Zagzebski J, Chen Q. Attenuation estimations using envelope echo data: analysis and simulations. Ultrasound Med. Biol. 2006;32(3):377–386. doi: 10.1016/j.ultrasmedbio.2005.12.001. [DOI] [PubMed] [Google Scholar]
- [9].He P, Greenleaf JF. Application of stochastic analysis to ultrasonic echoes—Estimation of attenuation and tissue heterogeneity from peaks of echo envelope. J. Acoust. Soc. Am. 1986;79(2):526–534. doi: 10.1121/1.393540. [DOI] [PubMed] [Google Scholar]
- [10].Lizzi FL, Driller J, Lunzer B, Kalisz A, Coleman DJ. Computer model of ultrasonic hyperthermia and ablation for ocular tumors using b-mode data. Ultrasound Med. Biol. 1992;18(1):59–73. doi: 10.1016/0301-5629(92)90009-y. [DOI] [PubMed] [Google Scholar]
- [11].Sidney DA. Ph.D. dissertation. Whitaker Coll. Health Sci. Tech., Med. Eng./Med. Pys. Program, Massachussetts Institute of Technology; Boston, MA: 1997. Three-dimensional ultrasound power deposition modeling, thermal field visualization, and clinical integration of hyperthermia therapy. [Google Scholar]
- [12].Kim H, Varghese T. Attenuation estimation using spectral cross-correlation. IEEE Trans. Ultrason. Ferroelectr. Freq. Control. 2007;54(3):510–519. doi: 10.1109/tuffc.2007.274. [DOI] [PubMed] [Google Scholar]
- [13].Bigelow TA, McFarlin BL, O’Brien WD, Jr., Oelze ML. In vivo ultrasonic attenuation slope estimates for detecting cervical ripening in rats: Preliminary results. J. Acoust. Soc. Am. 2008;123(3):1794–1800. doi: 10.1121/1.2832317. [DOI] [PMC free article] [PubMed] [Google Scholar]
- [14].Bigelow TA, O’Brien WD., Jr. Signal processing strategies that improve performance and understanding of the quantitative ultrasound SPECTRAL FIT algorithm. J. Acoust. Soc. Am. 2005;118(3, pt. 1):1808–1819. doi: 10.1121/1.2000752. [DOI] [PubMed] [Google Scholar]
- [15].Bigelow TA, O’Brien WD., Jr. Evaluation of the spectral fit algorithm as functions of frequency range and Dkaeff. IEEE Trans. Ultrason. Ferroelectr. Freq. Control. 2005 Nov.52(11):2003–2010. doi: 10.1109/tuffc.2005.1561669. [DOI] [PubMed] [Google Scholar]
- [16].Bigelow TA. Ultrasound attenuation estimation using backscattered echoes from multiple sources. J. Acoust. Soc. Am. 2008;124(2):1367–1373. doi: 10.1121/1.2949519. [DOI] [PMC free article] [PubMed] [Google Scholar]
- [17].Bigelow TA. Improved algorithm for estimation of attenuation along propagation path using backscattered echoes from multiple sources. Ultrasonics. doi: 10.1016/j.ultras.2009.10.011. to be published. [DOI] [PMC free article] [PubMed] [Google Scholar]
- [18].Bigelow TA, O’Brien WD., Jr. Scatterer size estimation in pulse-echo ultrasound using focused sources: Theoretical approximations and simulation analysis. J. Acoust. Soc. Am. 2004;116(1):578–593. doi: 10.1121/1.1757452. [DOI] [PubMed] [Google Scholar]
- [19].Browne JE, Ramnarine KV, Watson AJ, Hoskins PR. Assessment of the acoustic properties of common tissue-mimicking test phantoms. Ultrasound Med. Biol. 2003;29(7):1053–1060. doi: 10.1016/s0301-5629(03)00053-x. [DOI] [PubMed] [Google Scholar]
- [20].Bigelow TA, O’Brien WD., Jr. Scatterer size estimation in pulse-echo ultrasound using focused sources: Calibration measurements and phantom experiments. J. Acoust. Soc. Am. 2004;116(1):594–602. doi: 10.1121/1.1757453. [DOI] [PubMed] [Google Scholar]
- [21].Bigelow TA, O’Brien WD., Jr. Impact of local attenuation approximations when estimating correlation length from backscattered ultrasound echoes. J. Acoust. Soc. Am. 2006;120(1):546–553. doi: 10.1121/1.2208456. [DOI] [PubMed] [Google Scholar]
- [22].Stiles TA, Madsen EL, Frank GR. An exposimetry system using tissue-mimicking liquid. Ultrasound Med. Biol. 2008;34(1):123–136. doi: 10.1016/j.ultrasmedbio.2007.06.023. [DOI] [PubMed] [Google Scholar]
- [23].Jongen HAH, Thijssen JM, Aarssen MD, Verhoef WA. A general model for the absorption of ultrasound by biological tissues and experimental verification. J. Acoust. Soc. Am. 1986;79(2):535–540. doi: 10.1121/1.393541. [DOI] [PubMed] [Google Scholar]


