

Abstract
Conventional chemotherapy is commonly used for advanced stages of bladder cancer with modest success and high morbidity. Identifying markers of resistance will allow clinicians to tailor treatment to a specific patient population. T24-tumorigenic cell line was grown orthotopically in nude mice and monitored using bioluminescence imaging and microcomputed tomography until they developed metastases. Stable sublines were then developed from primary bladder (T24-P), lung (T24-L) and bone (T24-B) tissues. Chromosomal analysis and DNA microarray were used to characterize these sublines. qRT-PCR and immunohistochemistry (IHC) were used for validation. Epigenetic modifiers were used to study gene regulation. The cell viability was quantified with MTT assay. Chromosomal analysis revealed multiple alterations in metastatic cell lines compared to T24-P. DNA microarray analysis showed that Taxol-Resistance-Associated-Gene-3 (TRAG3) gene was the most upregulated gene. From qRT-PCR and IHC, TRAG3 was significantly higher in T24-L and T24-B than T24-P. TRAG3 gene expression is likely controlled by DNA methylation, but not histone acetylation. Interestingly, T24-B and T24-L cells were more resistant than T24-P to treatment with anti-microtubule agents such as docetaxel, paclitaxel and vinblastine. TRAG3 mRNA expression was higher in 20% of patients with ≤pT2 (n=10) and 60% of patients with ≥pT3 (n=20) compared to normal adjacent tissue (p=0.05). In addition, the median TRAG3 expression was 6.7-fold higher in ≥pT3 tumors compared to ≤pT2 tumors. Knowing the status of TRAG3 expression could help clinicians tailor treatment to a particular patient population that could benefit from treatment, while allocating patients with resistant tumors to new experimental therapies.
Keywords: urothelial carcinoma, bladder, TRAG3, resistance
INTRODUCTION
In the United States, urothelial carcinoma of the bladder (UCB) is estimated to affect 68,810 new patients, with 14,100 deaths resulting in 2008 1. Conventional cytotoxic chemotherapy is commonly used as a main regimen for advanced stages of bladder cancer 2. However, frequent appearance of drug resistance due to tumor heterogeneity and serious side effects from current treatment regimens have made treatment outcomes unsatisfactory. It is imperative to identify specific patient populations where particular chemotherapeutic regimens can achieve better therapeutic efficacy, while decreasing the morbidity and mortality related to UCB.
Towards this goal, we designed experiments to study cytogenetic properties and differential gene expression in primary and metastatic UCB cells. We developed a bladder tumor model using nude mice by instilling with human UCB cells orthotopically; the mice initially developed superficial tumors, which are most frequently diagnosed in patients. Subsequently, these tumors became invasive. Bioluminescence imaging (BLI) and Microcomputed tomography (microCT) were used to detect distant metastatic tumors, and sublines were then derived from each metastatic site. While profiling molecular changes associated with metastatic UCB cells, we observed that TRAG3 (Taxol-Resistance-Associated-Gene-3) 3 was the most upregulated gene in metastatic UCB cells. To our knowledge, this is the first study to evaluate TRAG3 in UCB. We further evaluated TRAG3 expression and regulation in cell lines in vitro, the differential growth of UCB cell lines treated with conventional cytotoxic agents, and the expression of TRAG3 in clinical specimens from patients with UCB treated with surgery.
MATERIALS AND METHODS
Cells and reagents
Human TCC cell lines T24 was purchased from the American Type Culture Collection (ATCC, Manassas, VA). Cells were maintained in T medium (Invitrogen, Carlsbad, CA) supplemented with 5% Fetal Bovine Serum and 1% Penicillin/Streptomycin, in a humidified incubator at 37°C with 5% CO2. 5-Azacytidine (5-Aza) was obtained from Sigma (Saint Louis, MO). FK228 (FR901228, Depsipeptide, Romidepsin) was a gift from Fujisawa Pharmaceutical Co., Ltd., Japan. The TRAG3 polyclonal antibody was a gift from Dr. Michael Seiden (Massachusetts General Hospital, Boston, MA). Docetaxel was purchased from Rhône-Poulenc Rôrer, Collegeville, PA and paclitaxel was purchased from CALBIOCHEM, La Jolla, CA. Vinblastine was purchased from American Pharmaceutic Partners, Inc, Schaumburg, IL. Mitomycin, adriamycin, and cisplatin were purchased from Ben Venue laboratory, Inc., Bedford, OH.
Orthotopic animal model and generation of metastatic sublines
T24-t (T24-tumorigenic) cell line, a highly tumorigenic clone, was derived from T24 subcutaneous animal model. To develop a superficial bladder cancer model, T24-t cells was instilled into the bladder as described previously 4. BLI was performed weekly to monitor the growth of primary tumor and subsequent metastases with an injection of 450mg/kg D-luciferin substrate in PBS (Biosynth, Neperville, IL) into anesthetized mice 4. The primary tumor was then excised and plated on tissue culture dishes under the selection of G418 (400 µg/ml) to derive the subline T24-P (T24-Parental).
Lung metastases were visualized using a small-animal microCT scanner (GE eXplore Locus, Piscataway, NJ). Mice were anesthetized with 2% isoflurane and were scanned in prone position. MicroCT imaging was acquired with 400 projections over 7 minutes at 80 kVp and 0.450 mA. The CT images were reconstructed using filtered back-projection and analyzed using the vendor software (MicroView, GE Healthcare, Piscataway, NJ).
Once lung or bone metastases were detected, metastatic tumors were also excised and plated on tissue culture dishes under the same selection conditions to generate lung (T24-L) and bone (T24-B) sublines, respectively. Institutional Animal Care and Usage Committee at the University of Texas Southwestern Medical Center approved all animal experiments.
Cell growth Assay and drug treatment
Cells were seeded in 48-well plates at a concentration of 4 × 10³ cells in 0.5 ml of medium per well. After 24 hours, the medium was aspirated and new medium containing different concentrations of drug (Docetaxel: 10, 20, 40, 50, 100 [ng/ml]; vinblastine: 1, 5, 10 [ng/ml]; Mitomycin, Cisplatin, and Adriamycin: 1, 5, 20 [µg/ml]) was added; each treatment condition was carried out in quadruplicate. After 72 hours, total cell number was determined using 3-(4,5-dimethylthiazol-2-yl)-2,5-diphenyltetrazolium bromide (MTT) assay (Roche, Indianapolis, IN).
RNA Isolation and Real-Time quantitative RT-PCR (qRT-PCR)
Total cellular RNA was extracted with RNeasy mini kit (Qiagen, Valencia, CA) plus RNase-free DNase I (Qiagen). Total RNA (1 µg) was subjected to cDNA synthesis kit (Bio-Rad, Hercules, CA). The first strand of cDNA (4 µl) was subjected to real-time reverse transcription-PCR (RT-PCR) using primers (TRAG3-forward: 5'-CCAAAGAGGTTCCCAAGACA-3' and TRAG3-reverse: 5'-GCTGTCCGAAAAGAGACTGG-3'). A 50-µL PCR reaction was carried out in iCycler Thermal Cycler (Bio-Rad) using iQ SYBR Green Supermix (Bio-Rad) with a denaturing step at 95°C for 3 minutes followed by 40 cycles of amplification at 95°C for 30 seconds, 56°C for 30 seconds, and 72°C for 1 seconds. The 18S rRNA cDNA [18S F (5'-GGAATTGACGGAAGGGCACCACC-3') and 18S R (5'-GTGCAGCCCCGGACATCTAAGG-3')] was used as an internal control. All experiments were repeated at least twice in duplicate.
DNA Microarray
Total cellular RNA was prepared from T24-P or T24-L sublines and then subjected to microarray analysis. All RNA-labeling and DNA microarray preparations were performed by The University of Texas Southwestern Medical Center at Dallas-DNA Microarray Core Facility (http://microarray.swmed.edu) using Human Genome U133 Plus2.0 (Affymetrix GeneChip, Santa Clara, CA), and hybridization values were obtained for each spot by using GenePix software. The mean intensity for each gene was obtained in duplicate from each of the replicated experiments, and a compound mean of signal intensity was calculated from four independent spots. Only genes with a 10-folder or higher induction were further validated by qRT-PCR.
Bisulfite Genomic Sequencing and Methylation specific PCR (MSP) Assay
High molecular weight genomic DNA was obtained from the indicated cell lines and subjected to bisulfite modification as previously described 5. Briefly, 1–2 µg (5–10 µl) genomic DNA was denatured by NaOH (final concentration, 0.2 M), 30 µl of 10 mM hydroquinone (Sigma), and 520 µl of 3M sodium bisulfite (Sigma) at pH 5 and 50 °C for 8 hrs. Modified samples were purified using Wizard DNA Clean-Up System desalting columns (Promega) followed by ethanol precipitation. Bisulfite-modified DNA (100 ng) was PCR amplified (35 cycles: 95 °C, 30 sec; 54 °C, 30 sec; 72 °C, 1 min) with primer sets described previously 6 in a 25-µl reaction mixture. The PCR products were cloned into TA cloning vector pCR 2.1-TOPO (Invitrogen). Five individual clones were sequenced using reverse and forward M13 primers.
For MSP, Bisulfite-modified DNAs were mixed with 10×PCR Buffer, 150 µM of deoxynucleotide triphosphates, 0.4 µM of primers and 1 unit of HotStarTaq (Qiagen Inc., Valencia, CA). The PCR condition was carried out with 35 cycles of 30 sec of 95°C, 30 sec of 60°C and 1 min of 72°C. The PCR products were resolved by electrophoresis in a 2% agarose gels containing ethidium bromide. Water blanks were included in each assay.
Immunohistochemistry (IHC)
Cells were plated on 8-chamber slides (Nagle Nunc International, Rochester, NY) overnight. For immunostaining, cells were fixed in a solution containing 95% methanol and 5% acetic acid at −20°C for 20 minutes. The endogenous peroxidase activity was blocked with 3% H2O2 in absolute methanol for 30 minutes. After rinsing for 3 times with PBS, the slides were placed in a Universal Block solution (KPL, Gaithersburg, MD) for 20 minutes. Then, the slides were incubated with a polyclonal TRAG3 antibody overnight at 4°C. The tissue sections were further incubated with a peroxidase-conjugated goat anti-rabbit secondary antibody (1:200 dilution in 5% dry milk in 0.01% PBS-T) for 1 h. After several washes with PBS-Tween buffer, the Sigma Fast™ Tablet Set (Sigma, Saint Louis, MO) containing diaminobenzidine (DAB) was used as a chromogen. The positive or negative control is using lung cancer (i.e., A549) treated with 5-aza 15.
Chromosomal analysis
All tumor cell lines were grown as monolayer cultures in Minimal Essential Alpha Medium (Invitrogen) supplemented with 10% fetal bovine serum (Invitrogen), L-glutamine (Invitrogen) and antibiotics (Roche). Cells were trypsinized by standard procedures and seeded into 60-mm Petri dishes with sterile coverslips and 5 ml of the same medium for 2–3 days to permit attachment and sufficient growth. Cells were arrested at metaphase with the addition of 25 ml of colcemid to each culture dish and incubate for 25 minutes in a 37°C incubator. Coverslips were manually harvested with hypotonic 0.4% potassium chloride for 20–30 minutes, subjected to multiple treatments with Carnoy’s fixative, and allowed to dry in a Thermotron drying chamber. Wright’s staining was achieved by treating coverslips for 1.5 to 2 minutes in a trypsin solution diluted 1:50 in Isotin II, rinsing in Gurr buffer pH 6.8 and staining in Wright’s stain diluted 1:5 in pHydrion solution for 2 to 3 minutes. Stained slides were mounted cell side down on microscope slides and analyzed on a Nikon E400 microscope. Subsequently, metaphase images were digitally captured and karyotyped with using Applied Spectral Imaging Case Data Manager Version 5.5.2.2 software.
Human bladder specimens
Frozen tissue specimens were obtained from thirty paired samples (tumor and adjacent histologically normal tissue) of bladder cancer patients from our tissue bank. Radical cystectomy was performed in 27 patients, transurethral resection of bladder tumor in 2, and bladder biopsy in 1. All procedures were done at The University of Texas Southwestern Medical Center hospitals. Patients were treated from 1998 to 2002. Twenty-two patients were males and eight were females. Mean patient age was 71.9 years (range 42 – 87). Bladder carcinomas were graded and staged according to the TNM system based on the American Joint Committee on Cancer (AJCC). Genitourinary pathologists determined tumor stage as: Tis (n=2); T1 (n=2); T2 (n=6); T3 (n=13); T4 (n=7). The Institutional Review Board approved the tissue procurement protocol and subsequent studies, and appropriate informed consent was obtained from all patients.
Statistical analysis
Non-parametric data were summarized using median ± interquartile range and were compared using Mann-Whitney U test. Statistical significance was set at p<0.05. SigmaStat was used for statistical analysis.
RESULTS
Monitoring the growth of orthotopic and metastatic tumors by microCT scan and BLI
We performed BLI (Figure 1a) to non-invasively monitor the growth of bladder tumors in their orthotopic as well as their metastatic locations. Initially, BLI imaging detected tumors in bladder about 4 to 5 weeks after the instillation of T24-t. Subsequently, we established a subline T24-P from these superficial tumors (Figure 1b). Using T24-P, bioluminescence was detected as early as two weeks after instilling cells into the bladder using Angiocath®. Serial monitoring at Weeks 2, 4, 6 documented continued growth of this bladder tumor, eventually resulting in lung metastasis as early as 6 weeks post-instillation (Figure 1a).
Figure 1. Development of an orthotopic model with subsequent metastasis using human UCB cells.
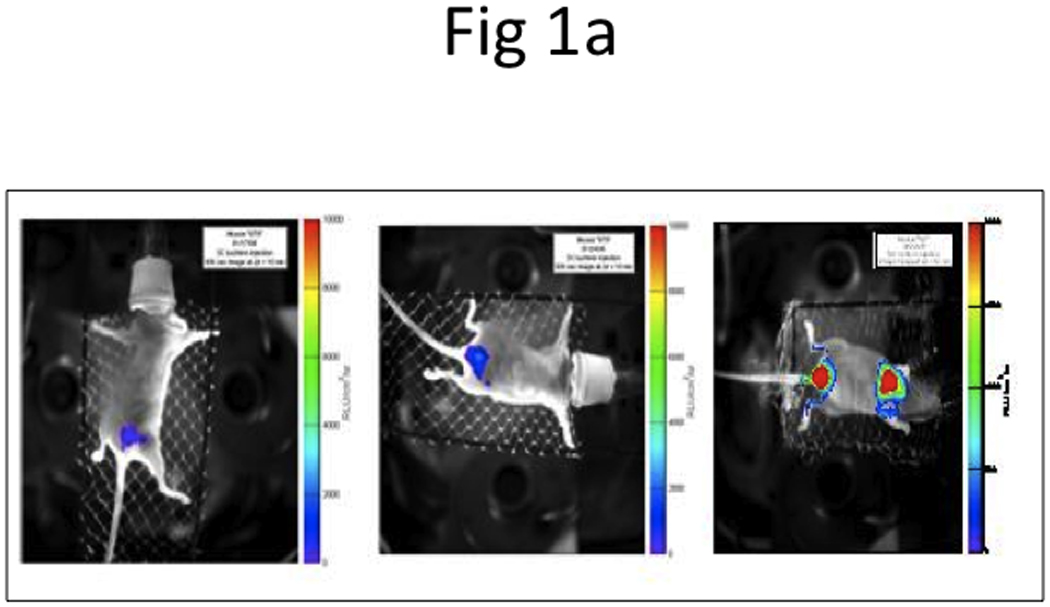
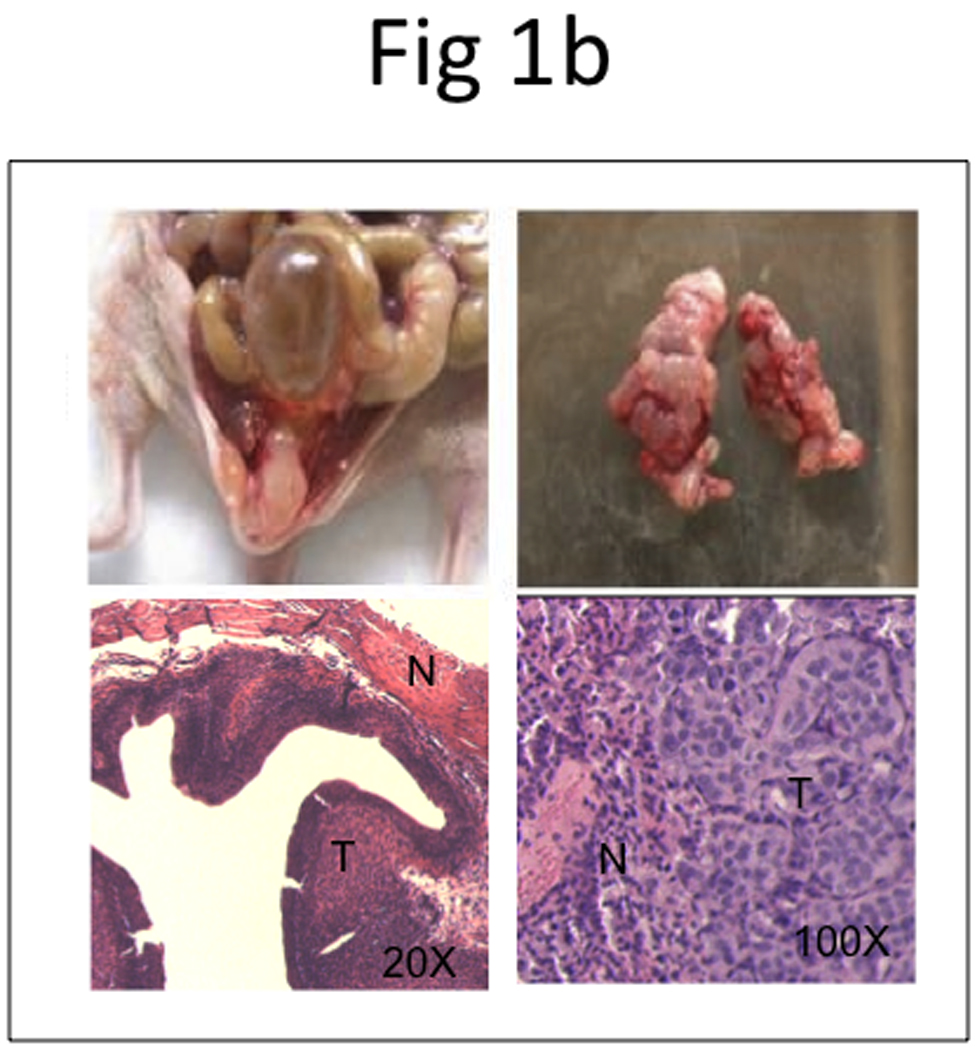
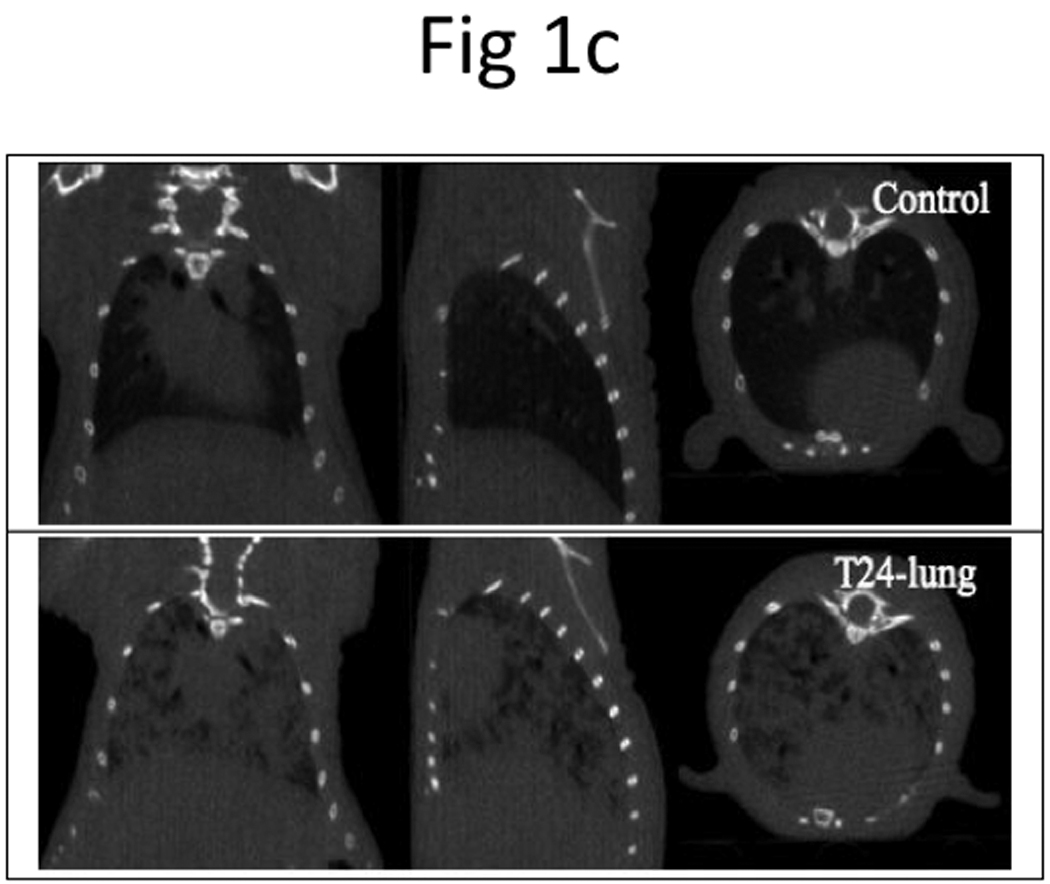
a, BLI imaging was carried out at Week 2 (left panel), 4 (middle panel), and 6 (right panel). b, Representative photos display primary tumor (top left panel) and histology of superficial tumor with an invasive phenotype (bottom left panel), lung metastases (top right panel) and histology of lung metastases (bottom right panel). N, normal; T, tumor. c, microCT of lung metastases was taken 42 days after bladder instillation.
We also performed microCT imaging to monitor the development of lung metastasis on Day 42 after injection of T24-P in the bladder. As shown in Figure 1c, microCT successfully detected the 3-D trabecular microarchitecture in vivo. In the microCT images of normal lung, only the bronchi and large vessels can be seen.
Figure 1b shows gross specimens of bladder and lungs with a large burden of bladder tumor, as well as microscopic evaluation of lung tissue with metastatic bladder tumor, using standard hematoxylin and eosin (H&E) stain.
In vitro characterization of T24-P, T24-L, and T24-B
In order to understand the biologic characteristics of these three sublines, we determined their in vitro growth rate. Interestingly, all 3 sublines have a similar growth using the MTT assay (Supplementary data, Figure S1).
In addition, cytogenetic evaluation was performed for T24-P, T24-L, and T24-B. The composite results for these chromosomal analyses are summarized (Supplementary data, Table S1) and a representative karyotype for all three sublines is shown in Figure S2 (Supplementary data). As indicated, the cell lines have very complex karyotypes with numerous numerical and structural abnormalities. The two cell lines derived from metastatic tissue shared most of the same numerical and structural abnormalities seen in the primary cells. This remarkable similarity clearly demonstrates these three cell lines are indeed related. Interestingly, both of the bone and lung sublines revealed simpler karyotypes than those seen in the T24-P cells, having a lower modal chromosome number resulting from the loss of specific chromosomes seen in the primary cells. While the primary cells revealed a modal count of 80–82, the bone and lung cell lines showed modal counts of 58–74 and 74–78, respectively. Chromosome abnormalities specific to the primary cells that are not seen in the metastatic cell lines include extra copies of chromosomes X and 7, as well as three marker chromosomes (mar1, mar2 and mar3), defined as a structurally abnormal chromosome in which no part can be identified, all three of which were seen in 3 of the 5 primary metaphases analyzed and never seen in a bone or lung cell. Specific structural abnormalities seen in primary cells and not in metastatic cells included add(X)(q22), add(2)(p13), add(3)(q13.2), add(5)(q11.2), del(8)(p11) and add(11)(q13). Additionally, while del(15)t(15;22)(p11;q11) was associated with the primary cell line, this aberration appeared only as a nonclonal finding (occurring only once in the metaphases analyzed) in the lung metastatic cell line. Several aberrations were specific to both metastatic cell lines and not seen in the T24-P cells. These were add(19)(p13.1) and add(22)(p11). Additionally, the bone metastatic cell line uniquely revealed an add(1)(q21) and add(1)(q44), and the sole abnormality specific to the lung derived cell line was add(3)(p12). These findings suggest that the metastatic cells are genetically distinct from the parental cell line, and that these are true metastases rather than simple hematogenous spread that occurred during experimental tumor implantation. This observation is consistent with other reports suggesting that metastasis may be associated with particular chromosomal alterations and cells with such potential may derive from “specific” origins 7–9.
TRAG3 expression using DNA microarray, RT-PCR and immunohistochemistry in T24-P, T24-L, and T24-B
Using Affymetrix DNA microarrays, a total of 5,221 genes had ≥2-fold increased expression in T24-L, compared to T24-B. TRAG3 was the most upregulated gene (~115-fold) identified from this array (Table 1). qRT-PCR was used to confirm the expression status of TRAG3 in all three sublines. TRAG3 gene was 223-fold and 588-fold overexpressed in T24-L and T24-B, respectively, as compared to T24-P (Figure 2a). IHC for TRAG3 protein showed that cytoplasmic TRAG3 staining is present at low amount at baseline in T24-P, but this level is increased in T24-L, and to a higher extent in T24-B (Figure 2b).
Table 1.
List of the 10 most upregulated genes in T24-L compared to T24-P subline
| Gene name | Locus | Gene | Fold-induction |
|---|---|---|---|
| TRAG3 | NM_004909 | Taxol resistance associated gene 3 | 115.4 |
| MAGE A2 | NM_005361 | Melanoma antigen gene, family A2 | 86.23 |
|
DKFZP434B061 TIE |
AL133561 | Hypothetical protein | 66.28 |
| BF515751 | 41.47 | ||
| NM_005424 | Tyrosine kinase with Ig and EGF homology | 30.69 | |
| PEPP2 | AK026344 | Phosphoinositol 3-phosphate-binding protein-2 | 30.63 |
| FLJ38159 | NM_152723 | Hypothetical protein | 28.66 |
| MAGE A3 | U82671 | Melanoma antigen gene, family A3 | 28.17 |
| DBCCR1L | BF589529 | 27.18 | |
| CDC42EP5 | AW084544 | 25.46 |
Figure 2. Determination of TRAG3 expression in T24 sublines.
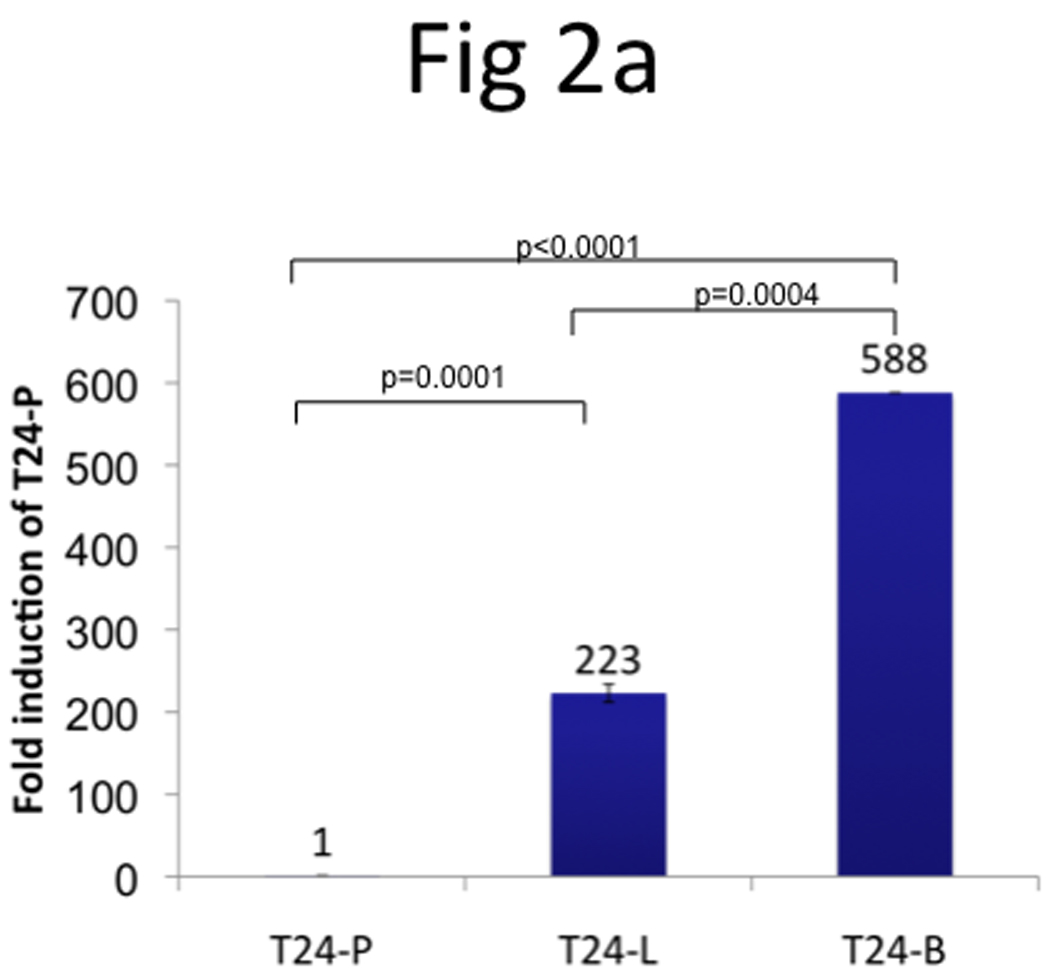
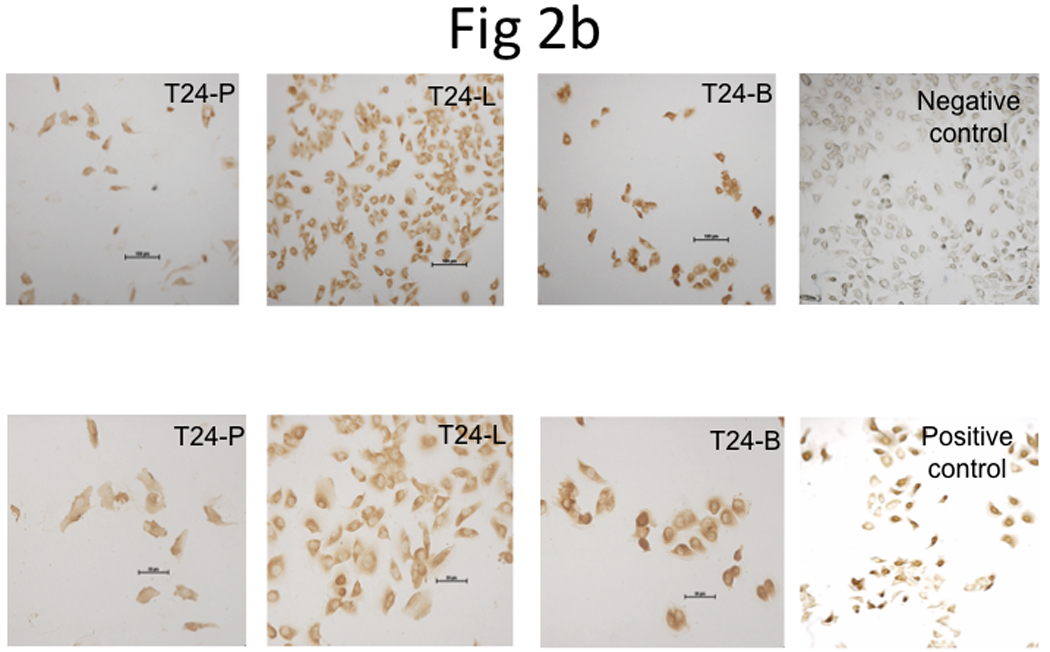
a, Measurement of TRAG3 mRNA expression using qRT-PCR. b, IHC staining from T24 sublines grown in 8-chamber slide using TRAG3 polyclonal antibody.
TRAG3 expression regulation by epigenetic mechanisms
In order to understand the mechanisms underlying the overexpression of TRAG3 gene in metastatic cell line T24-L, these cells were treated with the DNA hypomethylating agent 5-Aza and the histone deacetylase inhibitor FK228. Treatment with 5-Aza resulted in a significant upregulation of TRAG3 (~35-fold) (Figure 3a), while treatment with FK228 resulted only in minimal upregulation of TRAG3 (~2-fold) (Figure 3b). These data indirectly suggest that TRAG3 expression is partially regulated through epigenetic mechanisms such as DNA methylation, but to a much lesser extent histone acetylation.
Figure 3. Epigenetic regulation of TRAG3 expression in T24-P cell.
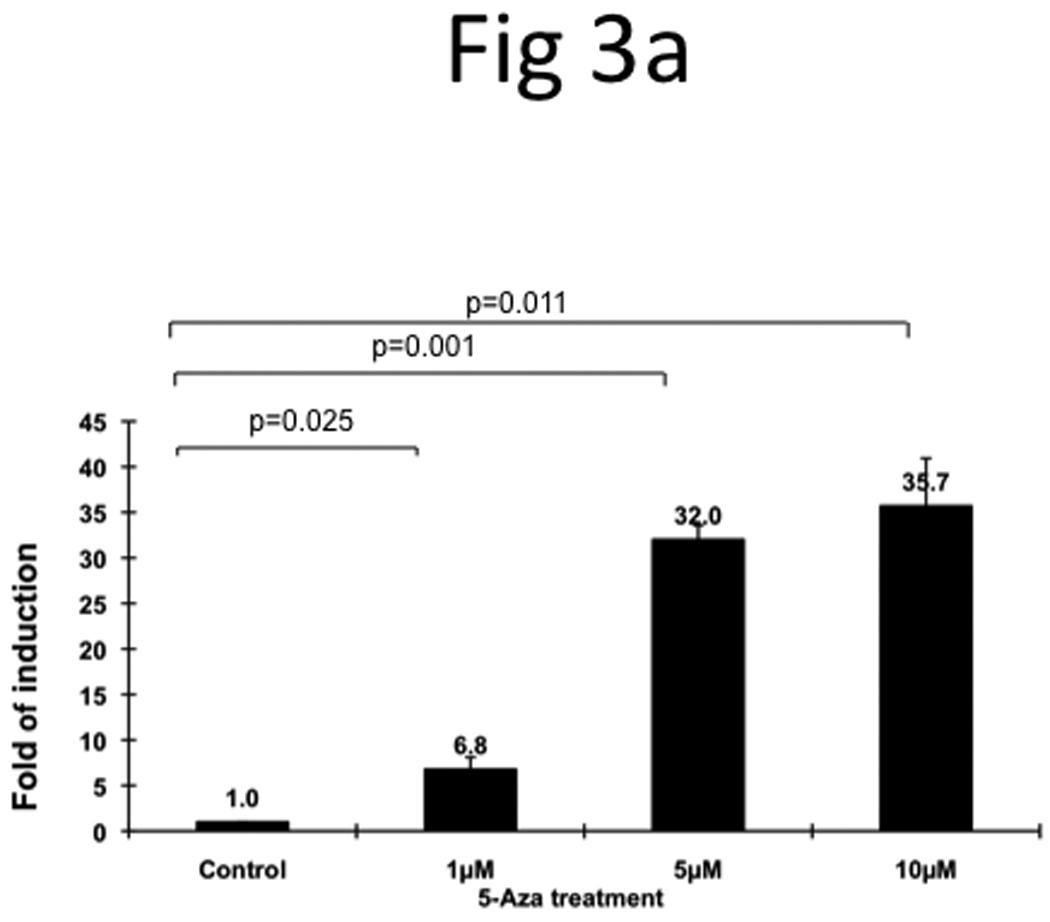
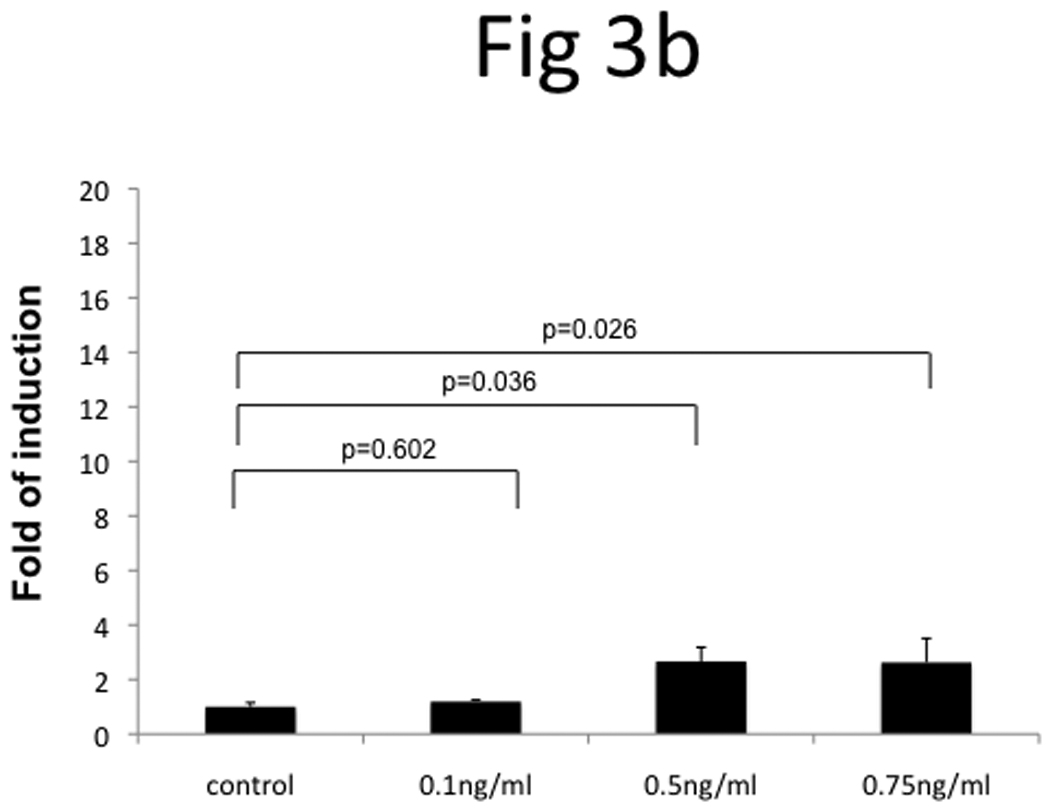
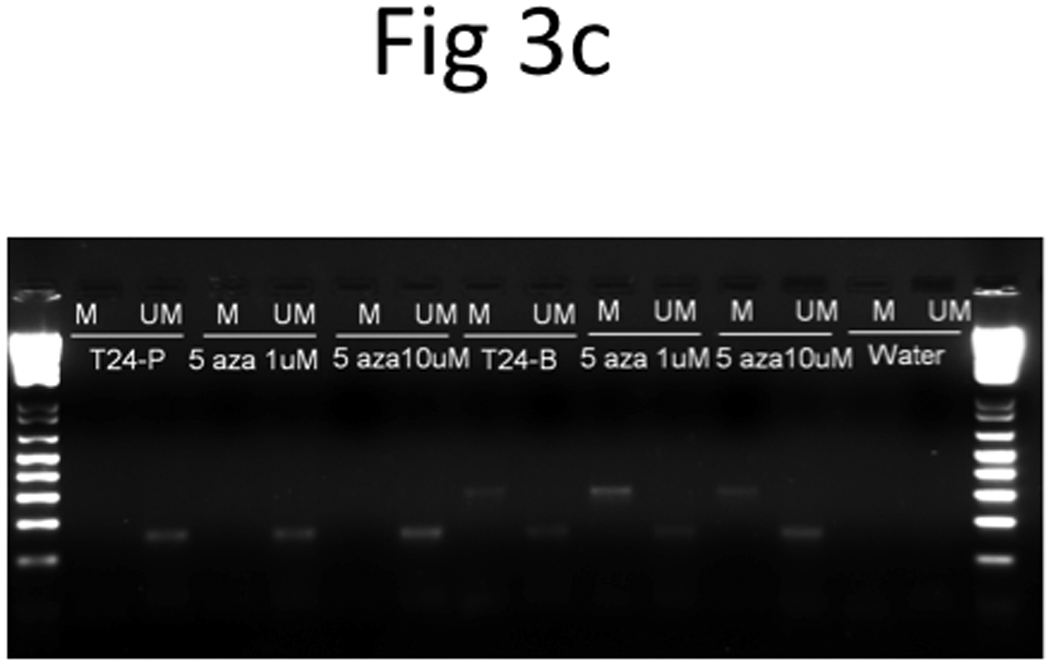
T24-P cells were treated with different concentrations of 5-Aza (a) or FK228 (b) for 24 hours and the total RNA from each sample was prepared and subjected to qRT-PCR. After normalizing with 18sRNA, each result was displayed as fold of induction using control (=1). (c) The effect of DNA hypomethylation agent on methylation status of TRAG-3 gene in T24 sublines.
However, when we performed bisulfite genomic sequencing and MSP, we noted that DNA methylation pattern on TRAG3 promoter in the three T24-sublines did not correlate with its expression pattern. Moreover, DNA hypomethylation agent (i.e., 5-aza) treatment did not alter the methylation pattern of TRAG-3 gene (Table 2 and Figure 3c), at least in the regions that we studied. These data indicate that promoter methylation status at −71 and −42 position of TRAG-3 gene is not involved in regulating TRAG3 gene expression via DNA methylation. Thus, 5-aza induced TRAG-3 mRNA expression in T24 cells could be an indirect effect. However, we cannot rule out the possibility that additional CpG sites located further 5’-upstream of the TRAG-3 promoter are involved.
Table 2.
DNA methylation sites in TRAG3 promoter of T24 sublines
| 5′- Promoter region (bp) |
−71 | −42 | ||
|---|---|---|---|---|
| Methylated | Unmethylated | Methylated | Unmethylated | |
| T24-P | 0 | 10 | 0 | 10 |
| T24-L | 2 | 8 | 0 | 10 |
| T24-B | 2 | 8 | 1 | 9 |
Numbers represent the number of clones with methylated or unmethylated CpG site based DNA sequencing.
The effect of cisplatin, mitomycin, adriamycin, docetaxol and vinblastine treatment on T24-P, T24-L, and T24-B
Since TRAG3 was initially identified as a taxol-resistance associated gene, we decided to examine the drug sensitivity of these sublines to common chemotherapeutic agents used in UCB patients. Treatment of T24-P, T24-L, and T24-B cell lines with cisplatin, mitomycin, and adriamycin resulted in a similar growth inhibition pattern in all 3 sublines. Conversely, treatment with anti-microtubule agents such as docetaxel, paclitaxel, and vinblastine showed that the sensitivities of the 3 sublines to treatment are distinct, with the parental T24-P cell lines being the most sensitive, followed by T24-L, and T24-B being the most resistant (Figure 4 and Supplementary data Table S2).
Figure 4. The effect of chemotherapeutic agents on T24 sublines.
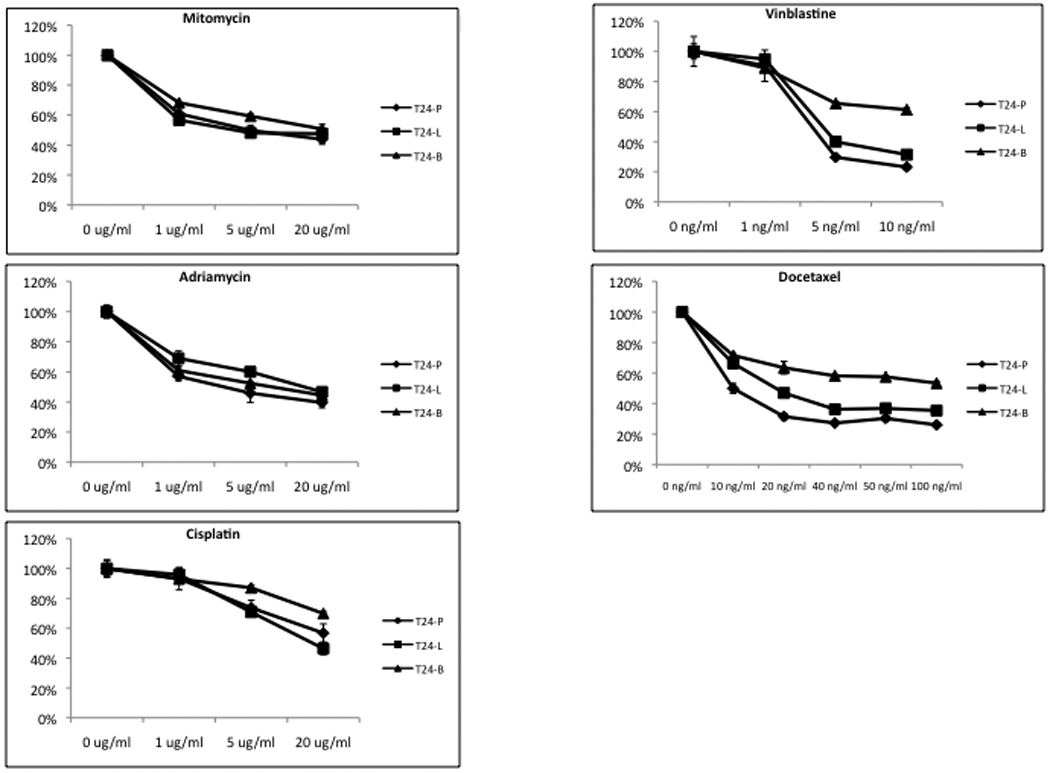
Cells were seeded in 48 well plates for 24 hours prior to adding drug. Relative cell number from each treatment (n = 4) was assessed using MTT assay was determined at Day 3 following drug treatment and the cell viability was calculated as percentage of control. The standard derivation of each data point is less than 10% of its mean.
TRAG3 mRNA expression in patient samples
We further profiled the TRAG3 expression in UCB patients; thirty patients with paired tumor and normal tissues were included in this study. qRT-PCR showed that 60% of patients with stage ≥pT3 had higher TRAG3 expression in tumors compared to adjacent histologically normal tissue, while only 20% of patients with stage ≤pT2 had higher TRAG3 expression in tumors compared to adjacent histologically normal tissue (p=0.05) (Figure 5a). In addition, the median normalized level of TRAG3 expression in tumor tissue was 6.1 in patients with stage ≥pT3 compared to 0.9 in patients with stage ≤pT2 (Figure 5b).
Figure 5. TRAG3 mRNA expression profile in UCB specimens.
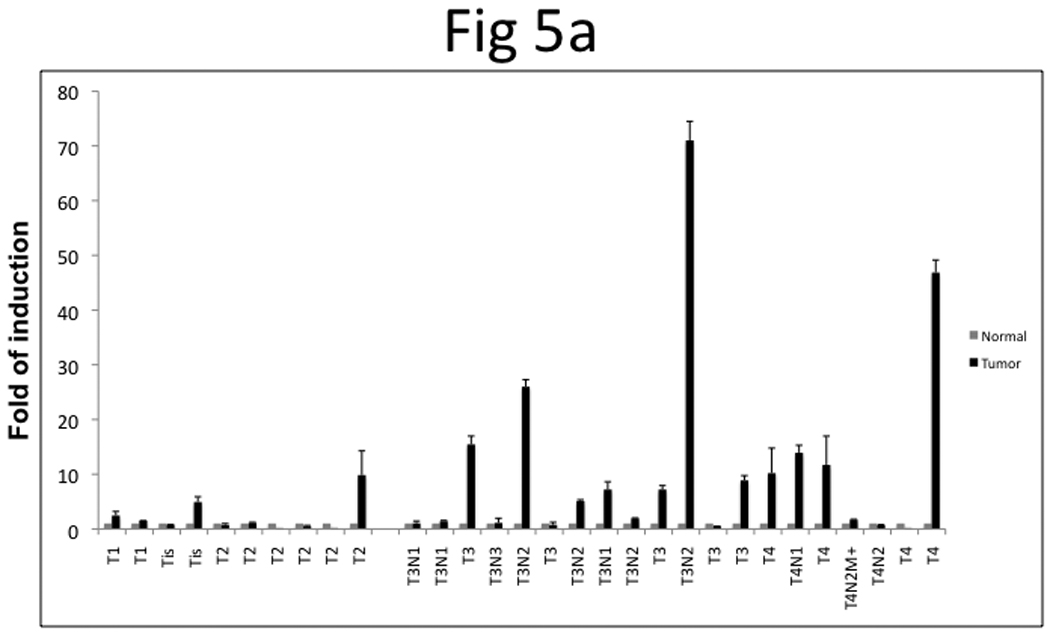
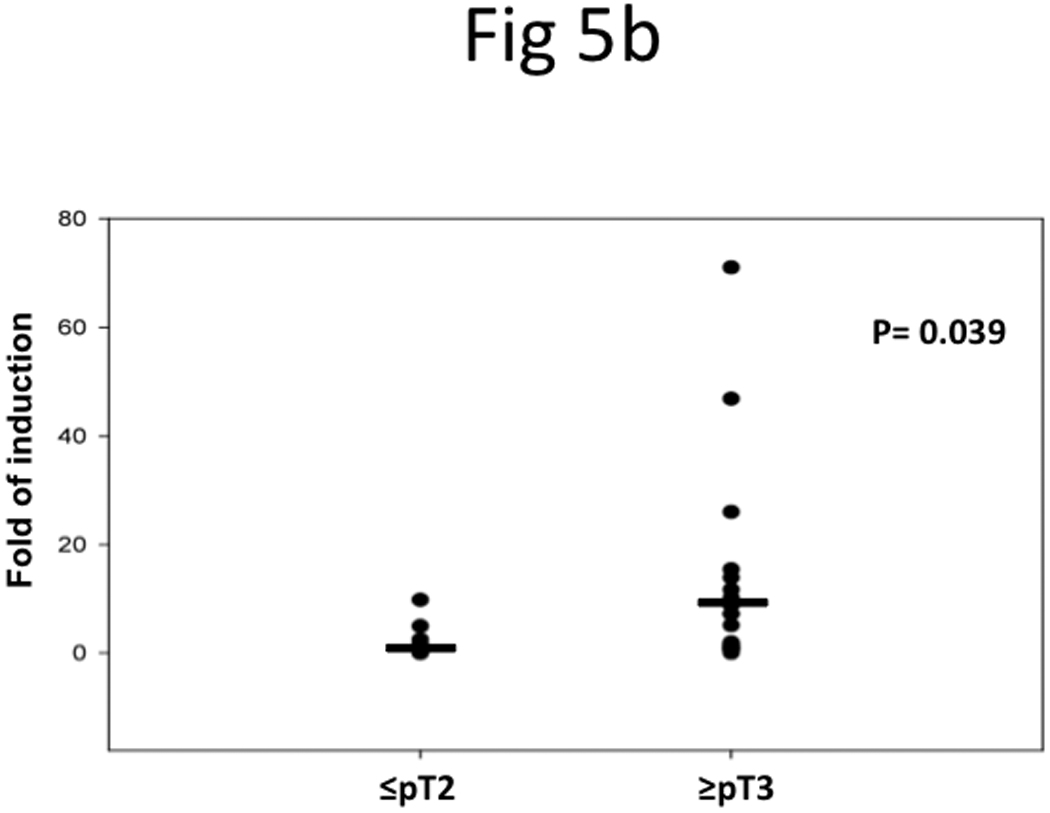
a, paired specimens of UCB were subjected to qRT-PCR and results were normalized with 18sRNA. b, Statistical analysis of TRAG3 mRNA in stage ≤pT2 vs. ≥pT3 tumor.
DISCUSSION
The American Cancer Society estimated that in 2008, ~14,000 persons will die with UCB 1. Currently, the mainstay of treatment of metastatic UCB is conventional cytotoxic chemotherapy, in the form of MVAC (Methotrexate, Vinblastine, Adriamycin, and Cisplatin) or GC (Gemcitabine and Cisplatin). In this patient population, MVAC regimens result in overall response rates greater than 70%, with 35% of patients achieving complete responses 10, 11. Unfortunately, the median overall survival at 5 years in patients with metastatic UCB treated with chemotherapy (14 months for GC v 15.2 months for MVAC) and the 5-year overall survival rates (13% for GC and 15.3% for MVAC) are poor 12. There is clearly a need for 1) Identifying which patients respond to conventional cytotoxic chemotherapy and 2) Enrolling patients predicted to be unresponsive to conventional cytotoxic chemotherapy in controlled clinical trials evaluating newer therapeutic agents.
The first step in this study was to understand genetic differences between primary and metastatic cell lines. Using an orthotopic model of bladder cancer 4, we were able to observe a similar spectrum of metastatic UCB to the lung and bone. The use of BLI and microCT was instrumental in the non-invasive monitoring of tumor growth in situ in the bladder, and the later development of metastases. After primary and metastatic UCB tissues were harvested, they were grown in vitro, therefore providing ample material for further studies. Cytogenetic evaluation of primary and metastatic UCB cell lines revealed that these cell lines are indeed related, but still exhibit specific cytogenetic abnormalities. The karyotyping results suggest the metastatic cells may arise from clonal expansion. Using DNA microarrays comparing metastatic UCB cells with primary UCB cells, we identified TRAG3 as the most upregulated gene in UCB metastases. A similar approach has been reported previously in UCB, however, in contradistinction to our study, it was used to identify genes that were downregulated in UCB metastases 13. We then confirmed TRAG3 overexpression using standard qRT-PCR and IHC techniques. We noted that TRAG3 expression can be regulated by epigenetic mechanisms such as DNA methylation, as indirectly evidenced by increased expression of TRAG3 when UCB cells were treated with a DNA hypomethylating agent. We also found that T24-L and T24-B sublines with high TRAG3 expression (metastatic UCB) were more resistant to Docetaxel, Paclitaxel, and Vinblastine, compared to T24-P cells with low TRAG3 expression (primary UCB). In clinical specimens, we found that TRAG3 expression was elevated in tumor samples compared to adjacent histologically normal tissues from the same bladder, and was elevated in higher stages of UCB. These results suggest TRAG3 as a potential surrogate marker for predicting drug resistance of anti-microtubule agents in UCB patients with advanced stages.
TRAG3, also known as CSAG2 (Chondrosarcoma Associate Gene 2), was originally identified and described in ovarian cancer 3. A taxol-sensitive ovarian cancer cell line was compared to a taxol-resistant subline using cDNA differential display, which resulted in identifying a novel gene, termed TRAG3. To test the hypothesis that TRAG3 induces resistance in treatment-naïve ovarian cancer cells, TRAG3 cDNA was transfected in these cells, however, no resistance to Taxol was observed, indicating that TRAG3 is a surrogate marker of Taxol resistance, rather than an inducer of resistance 3. Alternatively, it could be one of many components that are involved in Taxol resistance. TRAG3 has been mapped to chromosome Xq28 within a complex coding for the MAGE (Melanoma Antigen Genes) family of tumor antigens 14. Using DNA microarray (Table 1), MAGE gene was significantly upregulated; however, qRT-PCR results indicated that MAGE mRNA is not highly elevated compared with TRAG3 (Supplementary data Figure S3). In addition, the pattern of TRAG3 mRNA upregulation, but not GAGE or MAGE mRNA upregulation, correlates with resistance to anti-microtubule agents in bladder cancer cell lines (Supplementary data Figure S3 and Table S214. It appears that elevated TRAG3 mRNA in bladder cancer cells can better predict their resistance to anti-microtubule agents compared with other chemotherapeutic agents (Supplementary data Table S2).
TRAG3 is usually absent in most normal tissues, except the testis 3, 14. Regulation of TRAG3 expression has been studied in detail in lung carcinoma. Yao et al. studied DNA methylation patterns of TRAG3, and noted that in normal tissues, the CpG islands in the TRAG3 promoter and exon 2 are heavily methylated; with loss of methylation noted in these 2 areas in malignant cells 6. We confirmed that treatment with a DNA hypomethylating agent in UCB resulted in increased TRAG3 expression, similar to reports in lung cancer 6, 15. The expression of TRAG3 mRNA has been previously reported in clinical specimens, including esophageal, liver, bile duct, stomach, breast, and colon cancers 16, as well as cervical cancer 17, melanoma 14, and chondrosarcoma 18. In ovarian cancer, TRAG3 expression has been studied in relation to clinical outcomes after radical surgery and chemotherapy. Patients with low TRAG3 expression had a better progression-free and overall survival compared to those patients with high TRAG3 expression 19.
Future studies should externally validate the current findings of increased TRAG3 expression in UCB. In patients with long-term follow-up after radical cystectomy, TRAG3 should be investigated as a prognostic marker of progression-free survival and overall survival in patients who do not receive chemotherapy. In addition, the ability of TRAG3 expression to predict response after cytotoxic chemotherapy should be investigated in patients with UCB. This could assist in selection of patients that should receive cytotoxic chemotherapy in the neoadjuvant or adjuvant setting in the absence of metastatic disease, or in a salvage setting, in the presence of metastases.
The future treatment of UCB lies in identifying which patients will have the best response to conventional chemotherapy. These patients will be spared the side effects related to ineffective treatment, while allowing them to be enrolled in clinical trials evaluating newer therapeutic agents.
Supplementary Material
ACKNOWLEDGEMENTS
We thank Ms. Mary Barnes for editorial assistance. This work was supported in part by NIH grant CA95730 (to J.T.H.) and small animal imaging research program NIH (U24 CA126608).
REFERENCES
- 1.Jemal A, Siegel R, Ward E, Hao Y, Xu J, Murray T, Thun MJ. Cancer statistics, 2008. CA Cancer J Clin. 2008;58:71–96. doi: 10.3322/CA.2007.0010. [DOI] [PubMed] [Google Scholar]
- 2.Garcia JA, Dreicer R. Systemic chemotherapy for advanced bladder cancer: update and controversies. J Clin Oncol. 2006;24:5545–5551. doi: 10.1200/JCO.2006.08.0564. [DOI] [PubMed] [Google Scholar]
- 3.Duan Z, Feller AJ, Toh HC, Makastorsis T, Seiden MV. TRAG-3, a novel gene, isolated from a taxol-resistant ovarian carcinoma cell line. Gene. 1999;229:75–81. doi: 10.1016/s0378-1119(99)00042-6. [DOI] [PubMed] [Google Scholar]
- 4.Karam JA, Fan J, Stanfield J, Richer E, Benaim EA, Frenkel E, Antich P, Sagalowsky AI, Mason RP, Hsieh JT. The use of histone deacetylase inhibitor FK228 and DNA hypomethylation agent 5-azacytidine in human bladder cancer therapy. Int J Cancer. 2007;120:1795–1802. doi: 10.1002/ijc.22405. [DOI] [PubMed] [Google Scholar]
- 5.Chen H, Toyooka S, Gazdar AF, Hsieh JT. Epigenetic regulation of a novel tumor suppressor gene (hDAB2IP) in prostate cancer cell lines. J Biol Chem. 2003;278:3121–3130. doi: 10.1074/jbc.M208230200. [DOI] [PubMed] [Google Scholar]
- 6.Yao X, Hu JF, Li T, Yang Y, Sun Z, Ulaner GA, Vu TH, Hoffman AR. Epigenetic regulation of the taxol resistance-associated gene TRAG-3 in human tumors. Cancer Genet Cytogenet. 2004;151:1–13. doi: 10.1016/j.cancergencyto.2003.08.021. [DOI] [PubMed] [Google Scholar]
- 7.Hoglund M, Gisselsson D, Hansen GB, White VA, Sall T, Mitelman F, Horsman D. Dissecting karyotypic patterns in malignant melanomas: temporal clustering of losses and gains in melanoma karyotypic evolution. Int J Cancer. 2004;108:57–65. doi: 10.1002/ijc.11558. [DOI] [PubMed] [Google Scholar]
- 8.Hoglund M, Gisselsson D, Sall T, Mitelman F. Coping with complexity. multivariate analysis of tumor karyotypes. Cancer Genet Cytogenet. 2002;135:103–109. doi: 10.1016/s0165-4608(01)00645-8. [DOI] [PubMed] [Google Scholar]
- 9.Wu KL, Beverloo B, Velthuizen SJ, Sonneveld P. Sequential analysis of chromosome aberrations in multiple myeloma during disease progression. Clin Lymphoma Myeloma. 2007;7:280–285. doi: 10.3816/CLM.2007.n.003. [DOI] [PubMed] [Google Scholar]
- 10.Sternberg CN, Yagoda A, Scher HI, Watson RC, Ahmed T, Weiselberg LR, Geller N, Hollander PS, Herr HW, Sogani PC, et al. Preliminary results of M-VAC (methotrexate, vinblastine, doxorubicin and cisplatin) for transitional cell carcinoma of the urothelium. J Urol. 1985;133:403–407. doi: 10.1016/s0022-5347(17)48996-8. [DOI] [PubMed] [Google Scholar]
- 11.Sternberg CN, Yagoda A, Scher HI, Watson RC, Geller N, Herr HW, Morse MJ, Sogani PC, Vaughan ED, Bander N, et al. Methotrexate, vinblastine, doxorubicin, and cisplatin for advanced transitional cell carcinoma of the urothelium. Efficacy and patterns of response and relapse. Cancer. 1989;64:2448–2458. doi: 10.1002/1097-0142(19891215)64:12<2448::aid-cncr2820641209>3.0.co;2-7. [DOI] [PubMed] [Google Scholar]
- 12.von der Maase H, Sengelov L, Roberts JT, Ricci S, Dogliotti L, Oliver T, Moore MJ, Zimmermann A, Arning M. Long-term survival results of a randomized trial comparing gemcitabine plus cisplatin, with methotrexate, vinblastine, doxorubicin, plus cisplatin in patients with bladder cancer. J Clin Oncol. 2005;23:4602–4608. doi: 10.1200/JCO.2005.07.757. [DOI] [PubMed] [Google Scholar]
- 13.Gildea JJ, Seraj MJ, Oxford G, Harding MA, Hampton GM, Moskaluk CA, Frierson HF, Conaway MR, Theodorescu D. RhoGDI2 is an invasion and metastasis suppressor gene in human cancer. Cancer Res. 2002;62:6418–6423. [PubMed] [Google Scholar]
- 14.Feller AJ, Duan Z, Penson R, Toh HC, Seiden MV. TRAG-3, a novel cancer/testis antigen, is overexpressed in the majority of melanoma cell lines and malignant melanoma. Anticancer Res. 2000;20:4147–4151. [PubMed] [Google Scholar]
- 15.Zhu B, Chen Z, Cheng X, Wu Y. Induction of TRAG-3 expression in A549 lung adenocarcinoma cell line by 5-aza-2' deoxyazacytidine. Lung Cancer. 2002;38:321–322. doi: 10.1016/s0169-5002(02)00310-0. [DOI] [PubMed] [Google Scholar]
- 16.Ohta M, Tanaka F, Sadanaga N, Yamaguchi H, Inoue H, Mori M. Expression of the TRAG-3 gene in human esophageal cancer: the frequent synchronous expression of MAGE-3 gene. Oncol Rep. 2006;15:1529–1532. [PubMed] [Google Scholar]
- 17.Narayan G, Bourdon V, Chaganti S, Arias-Pulido H, Nandula SV, Rao PH, Gissmann L, Durst M, Schneider A, Pothuri B, Mansukhani M, Basso K, et al. Gene dosage alterations revealed by cDNA microarray analysis in cervical cancer: identification of candidate amplified and overexpressed genes. Genes Chromosomes Cancer. 2007;46:373–384. doi: 10.1002/gcc.20418. [DOI] [PubMed] [Google Scholar]
- 18.Lin C, Mak S, Meitner PA, Wolf JM, Bluman EM, Block JA, Terek RM. Cancer/testis antigen CSAGE is concurrently expressed with MAGE in chondrosarcoma. Gene. 2002;285:269–278. doi: 10.1016/s0378-1119(02)00395-5. [DOI] [PubMed] [Google Scholar]
- 19.Materna V, Surowiak P, Kaplenko I, Spaczynski M, Duan Z, Zabel M, Dietel M, Lage H. Taxol-resistance-associated gene-3 (TRAG-3/CSAG2) expression is predictive for clinical outcome in ovarian carcinoma patients. Virchows Arch. 2007;450:187–194. doi: 10.1007/s00428-006-0346-7. [DOI] [PubMed] [Google Scholar]
Associated Data
This section collects any data citations, data availability statements, or supplementary materials included in this article.