Abstract
Issues of multiple-testing and statistical significance in genome-wide association studies (GWAS) have prompted statistical methods utilizing prior data to increase the power of association results. Using prior findings from genome-wide linkage studies on bipolar disorder (BPD), we employed a weighted false discovery approach (wFDR; (Roeder et al. 2006)) to previously reported GWAS data drawn from the Systematic Treatment Enhancement Program for Bipolar Disorder (STEP-BD). Using this method, association signals are up or down-weighted given the linkage score in that genomic region. Although no SNPs in our sample reached genome-wide significance through the wFDR approach, the strongest single SNP result from the original GWAS results (rs4939921 in myosin VB) is strongly up-weighted as it occurs on a linkage peak of chromosome 18. We also identify regions on chromosome 9, 17, and 18 where modestly associated SNP clusters coincide with strong linkage scores, implicating them as possible candidate regions for further analysis. Moving forward, we believe the application of prior linkage information will be increasingly useful to future GWAS studies that incorporate rarer variants into their analysis.
Introduction
Bipolar disorder (BPD) is a debilitating mental disorder that is common in the population (1-4% depending on the specific BPD classification (Merikangas et al. 2007)), yet has a complex etiology and life course across individuals. Family, twin, and adoption studies on BPD have convincingly shown that there is a substantial heritable component (Smoller and Finn 2003; Edvardsen et al. 2008), leading researchers to search for susceptibility genes, both in candidate regions and across the genome, that predispose individuals to BPD. To date, despite the high heritability of BPD, the discovery of susceptibility genes has been a challenging endeavor. Hypothesis-driven candidate gene approaches, most of which target genes involved in neurotransmitter systems, have largely been inconclusive with many initial findings failing to replicate. Some genes that have shown replication or significance in meta-analyses are the serotonin transporter (Cho et al. 2005; Lasky-Su et al. 2005), brain-derived neurotrophic factor (Kremeyer et al. 2006; Neves-Pereira et al. 2002; Sklar et al. 2002), d-amino acid oxidase activator (Detera-Wadleigh and McMahon 2006), monoamine oxidase A (Muller et al. 2007), and a gene that codes for 5,10-methylenetetrahydrofolate reductase (Gilbody et al. 2007). Unfortunately, none of these replicated findings have shown a large genetic effect, leaving much of the genetic variance in BPD to be explained.
In contrast, genome-wide linkage and association approaches have taken an agnostic approach to finding susceptibility genes for BPD. Family-based linkage approaches on the whole have not consistently implicated a single region (McGough et al. 2008), but the most comprehensive meta-analysis on BPD has implicated regions of chromosome 6q for Bipolar I, and 8q for Bipolar I and II (McQueen et al. 2005). More recently, population-based genome-wide association studies (GWAS) on BPD, which are able to detect smaller genetic effects, have identified associated SNPs in chromosome 16p12 (WTCCC 2007), the diacylglycerol kinase eta (DGKH) gene on chromosome 13 (Baum et al. 2008), and the myosin 5B (MYO5B) gene on chromosome 18 (Sklar et al. 2008). These three large-scale GWAS studies were then pooled together, finding a significant association in the ankyrin G (ANK3) gene on chromosome 10 and a replicated suggestive association signal in the alpha 1C subunit of the L-type voltage-gated calcium channel (CACNA1C) gene on chromosome 12, although none of the prior top signals were identified in the pooled analysis (Ferreira et al. 2008). Finally, a SNP in the zinc-finger protein 804A (ZNF804A) on chromosome 2 has shown association in both schizophrenia and BPD datasets, while a common polygenic approach compromising large clusters of SNPs has shown concordance in effects on schizophrenia and BPD (Williams et al. 2010), implicating shared genetic liability. Despite these large-scale efforts, the findings still represent a small proportion of the genetic variance in BPD (no top signals with an odds ratio greater than 1.6), suggesting a complex genetic etiology compromised of multiple genes with no single genetic risk factor being a sufficient cause of BPD.
One of the primary issues surrounding genome-wide analysis is the amount of multiple testing that arises from analyzing hundreds of thousands of SNPs. Although the use of Bonferroni correction for multiple testing limits the possibility of making type-I errors, by definition it also raises the probability of committing type-II errors, possibly diminishing the chances of detecting true signals of association. This has prompted statistical methods that utilize prior information to guide association scans or assist in prioritizing genetic regions in follow-up studies (e.g. Fan et al. 2010). In the current study, we apply a weighted false discovery rate procedure (wFDR; Roeder et al. 2006), taking prior linkage information derived from a genome-wide linkage meta-analysis (McQueen et al. 2005) to variably weight association signals from a GWAS drawn from the Systematic Treatment Enhancement Program for Bipolar Disorder (STEP-BD; Sklar et al. 2008). By incorporating meta-analytical prior information, the current technique lends an increase in detection power through an integrated empirical approach to genome-wide analysis.
Methods
GWAS Methods
Case-Control GWAS Sample
Our case sample consisted of 955 Caucasian bipolar I subjects drawn from the genetic repository of the Systematic Treatment Enhancement Program for Bipolar Disorder (STEP-BD). The STEP-BD sample is a longitudinal cohort drawn from the United States examining the effect of treatments in the course of BPD (Sachs et al. 2003). All subjects were diagnosed for bipolar I on the Affective Disorders Evaluation and the Mini-International Neuropsychiatric Interview. Our control sample consisted of 1,498 US Caucasian subjects drawn from the NIMH genetics initiative through the NIMH Center for Collaborative Studies (http://zork.wustl.edu/nimh). Of the controls, 454 came from anonymous blood cord donors and were phenotypically unscreened (Mansour et al. 2005). The remaining 1,044 controls completed an online self-administered psychiatric screen, and qualified as controls if they reported no history of schizophrenia, schizoaffective disorder, auditory hallucinations, delusions, and bipolar disorder (see Sklar et al. 2008 for further information).
SNP Selection
Genotyping for the STEP-BD cases and NIMH controls were all performed on the Affymetrix GeneChip Human mapping 500K chipset. Quality control procedures and subsequent association analysis on the genotyped SNPs were all performed using PLINK (Purcell et al. 2007). Our quality control procedures, which involve individual exclusion, SNP exclusion, and population stratification, follow that described in Sklar et al. (2008). We include the additional step of removing all SNPs with minor allele frequency (MAF) < .05 and all SNPs on the X chromosome, as the linkage data only covers the 22 autosomes. After exclusion, 342,191 SNPs were retained for further analysis.
GWAS Analysis
We initially performed a genome-wide association analysis on the 342,191 SNPs. We chose the Cochrane-Armitage trend test to generate the primary nominal, unweighted association statistics. Figure 1 shows the unweighted, unadjusted p-values across the 22 autosomes. These results are consistent with the original publication of these data (Sklar et al. 2008). The p-values from this analysis were then weighted according to linkage evidence in that particular region (see below).
Figure 1.
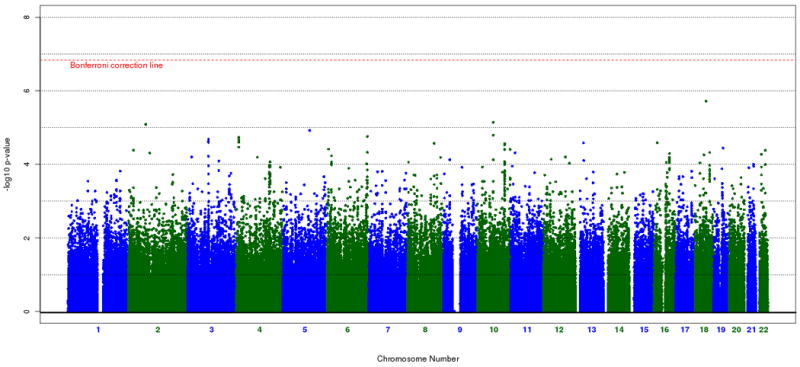
Cochran-Armitage association results of the STEP-BD cohort (342,191 SNPs). The red dashed line represents the genome-wide significant p-value threshold after Bonferroni correction.
Linkage Analysis Methods
For a detailed description of the combined linkage analysis samples, methods, results and conclusions, please see McQueen et al. (2005). Briefly, a genome-wide linkage trace was conducted on a combined sample consisting of eleven BPD linkage studies amounting to a total of 5,179 individuals from 1,067 families (McQueen et al. 2005). The combined sample was relatively homogenous with the majority of individuals being of Caucasian descent. Linkage statistics were generated using the affected relative pair methodology implemented in MERLIN (Abecasis et al. 2002) at 1 centimorgan (cM) intervals across the 22 autosomes. In the original combined analyses, two different affection status models were used - bipolar I and bipolar I and II. To maintain consistency with the case-control STEP-BD samples, only the linkage statistics from the bipolar I analysis (“narrow” definition) were used. Using MERLIN's implementation of the Whittemore and Halpern (1994) algorithm to test for allele sharing across all affected individuals, we generated nonparametric LOD scores via the Kong and Cox (1997) linear model. For the purposes of this study, we used the corresponding Z score (“Zmean”) from the MERLIN output at each 1 cM position as the linkage “priors” for the weighted association analysis.
Weighted Association Analysis Methods
Linkage Weights
The theoretical basis for using linkage weights in the context of genome-wide association analysis comes from the general literature of weighted hypothesis testing (Roeder et al. 2007). Roeder et al. (2006) proposed using weights from a linkage scan to attenuate the vast multiple testing pitfalls encountered with GWAS data. Investigators typically favor one chromosome region or another based on prior evidence – one primary consideration is linkage data (Roeder et al. 2006). Weighting association statistics using linkage data is a quantitative method of incorporating prior information into large-scale association scans. While there are numerous approaches to devising weights, there are only two criteria that must be satisfied: (1) each weight must be greater than or equal to 0 and (2) the mean of the weights must equal 1. As noted by Roeder et al. (2006), a reasonable weighting choice is to use nonparametric linkage scores generated from linkage scans. Because what constitutes a linkage region in binary terms is often not well defined, it follows that the quantitative linkage signals be used to generate continuous weights. In addition, it is recommended that the GWAS and prior linkage information come from a similar ethnic background, as genetic heterogeneity between ethnic backgrounds will reduce the power gained from using prior information. In the original description of using linkage statistics to weight association p-values, two continuous weighting schemes were introduced - exponential and cumulative. Exponential weights can be highly sensitive to large linkage signals while cumulative weights tend to be less so (Roeder et al. 2006). Given the large linkage signal in the original combined analysis for the narrow phenotype definition (bipolar I) found on chromosome 6q (LOD=4.2) we chose to use the cumulative weighting scheme in an attempt to weight the association signals in a more evenly distributed manner. We also used a scaling factor (B) of 2 (Roeder et al. 2006). The scaling factor in the context of cumulative weights (as used here) will constrain the influence of any individual linkage peak such that the weights will increase linearly for linkage scores (Z) near B, but reach an asymptote for large linkage scores (|Z – B|) (Roeder et al. 2006). We chose a scaling factor (B) of 2 based upon recommendations found in Roeder et al. (2006). This results in linkage scores greater than or equal to 2 units above B (2) to be approximately equally up-weighted. The same is true for linkage scores less than or equal to 2 units below B (2) in that they are equally down-weighted.
Weighted Association
The weighted association approach incorporates the weighting scheme directly into the association p-values. In order to match an association p-value with its respective linkage signal, we assigned a genetic distance to each SNP location. As a result, p-values for each SNP may be up-weighted or down-weighted depending upon the relative linkage signal in that region. The nominal p-values from the association test are divided by the respective weights given to the genomic region (determined by the linkage signal) to generate the weighted p-values. The weighted p-values are then used in the false-discovery rate (FDR) procedure to assess overall significance. The weighting procedure (and implementation of the FDR adjustment) was conducted in an R (http://www.r-project.org) script entitled, “weighted_FDR.R” (http://www.wpic.pitt.edu/wpiccompgen/fdr). For the FDR method, we used the method described in Storey (2002) with a significance level of 0.10.
Results
Primary Association Results
A histogram of weights across the genome is shown in figure 2. Our weighted association results for the set of 342,191 SNPs along with their respective weights, is shown in figure 3A and 3B. As mentioned in our methods section, we decided to use the cumulative weighting procedure as our official results, but include a graph and weight distribution for the exponential weighting procedure for the sake of comparison. None of the weighted association signals reach genome-wide significance after implementing the FDR method (multiple correction threshold 0.1/342,191 = 2.92 × 10⁻⁷). Our most significant association signal was at rs4939921 on chromosome 18p21.1 (weighted p = 4 × 10⁻⁷, weight = 5.2), residing in an intron of myosin VB (MYO5B), and is shown in figure 4A. While this was also the top signal in the unweighted association, the signal strength increased by almost an order of magnitude through the weighted approach (original p = 1.9 × 10⁻⁶). All but one of the neighboring SNPs with weighted p < .001 were found to be in linkage disequilibrium (LD) with rs4939921. Our second strongest signal came from rs4852259 on chromosome 2p13.3 (weighted p = 2.3 × 10⁻⁶, weight = 3.5), residing in an intron of the gene dysferlin (DYSF), also shown in figure 4B. This SNP was the third ranked signal in the unweighted association. Unlike the top signal, there were no neighboring SNPs with p < .001.
Figure 2.
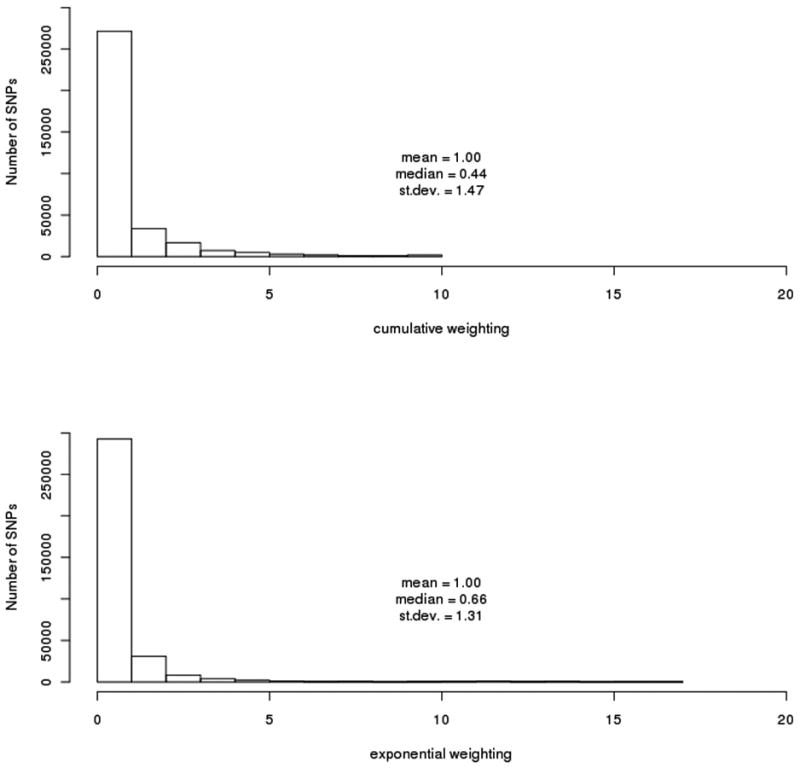
Distribution of weights across the genome. Cumulative weighting is shown on top and exponential weighting is shown on bottom. For both weighting schemes, the majority of SNPs (∼71%) have a weight less than one, leading them to have a higher (or less significant) p-value.
Figure 3A and B.
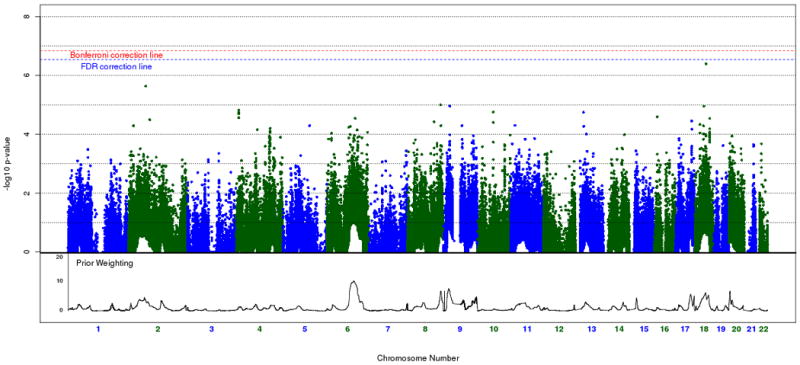
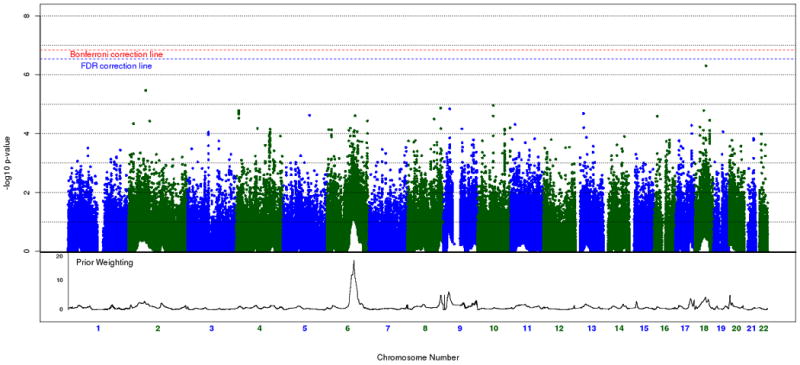
Weighted Cochran-Armitage association results of the STEP-BD cohort (342,191 SNPs). Figure 3A represents cumulative weighted p-values, which are used in subsequent analyses. Figure 3B represents exponential weighted p-values, which are not used in subsequent analyses. Prior weighting is shown at the bottom of each plot. The red dashed line represents significance after Bonferroni correction, whereas the blue dashed line represents significance after FDR correction at the 0.1 threshold.
Figure 4A and B.
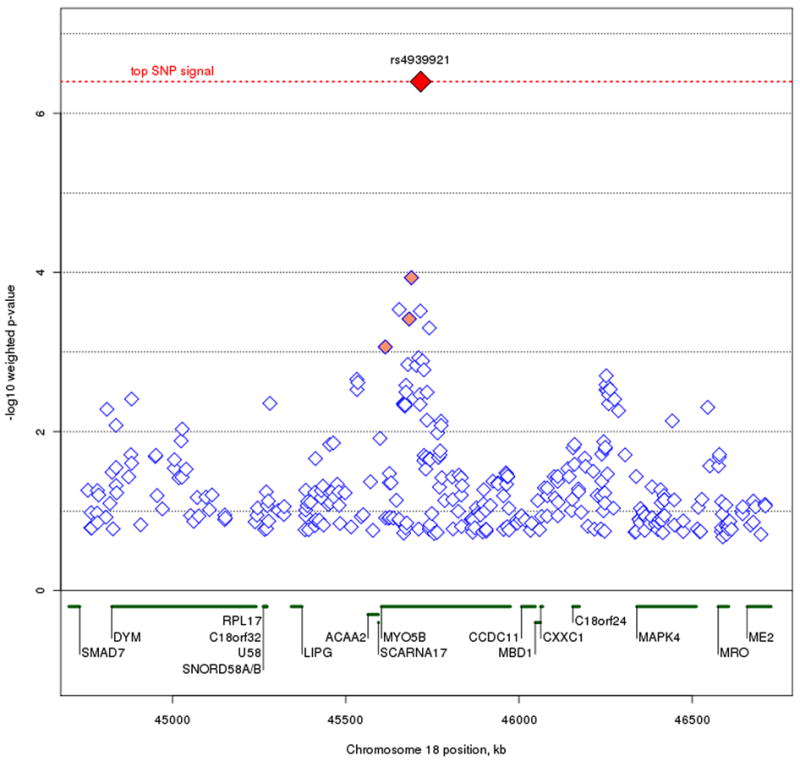
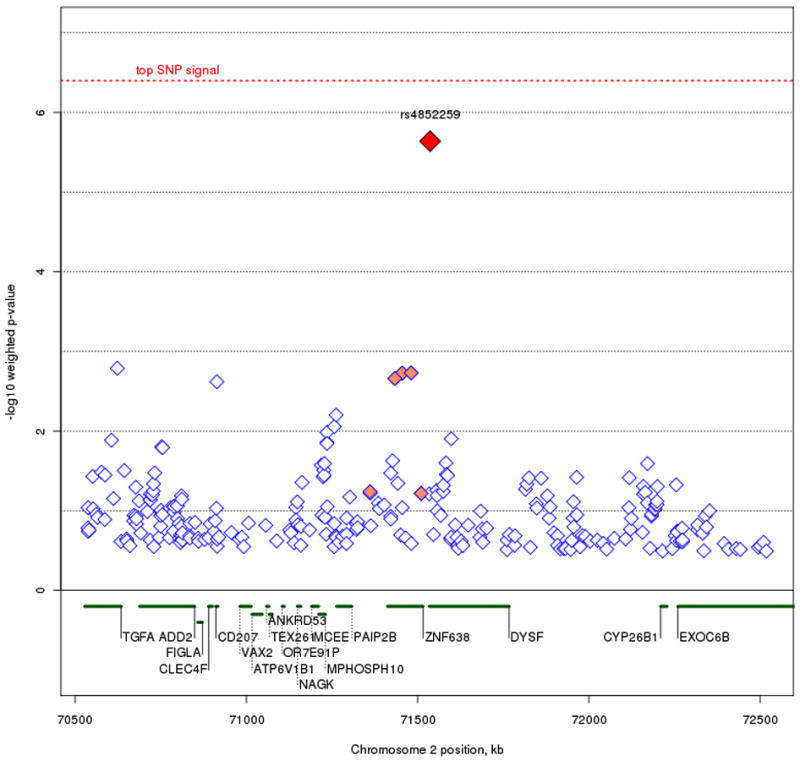
Plots of the top two regions of association. Figure 4A represents the MYO5B signal on chromosome 18q21.1-18q21.2. Figure 4B represents the DYSF signal on chromosome 2p13.3. The most associated SNP is marked in red. The color of the remaining SNPs reflects linkage disequilibrium (r2) with the most associated SNP (increasing red hue marks stronger r2). Gene regions are shown in green, and were taken from the March 2006 UCSC genome browser assembly.
Up-weighted Regions of Interest
Beyond our top SNP signals, we also looked for regions where strong linkage scores coincided with clusters of top SNP signals. To avoid redundancy, we used the original trend test p-values along with our linkage weights to set the basis for our criteria of identifying regions of interest. Specifically, we examined the top one percent (or 99th percentile) of unweighted p-values that resided within the top five percent (or 95th percentile) of weight values across the genome, resulting in 235 remaining SNPs (figure 5). The majority of SNPs that fit these criteria occur on Chromosomes 6, 8, 9, 17, 18, and 20. Previous work using the STEP-BD data has been done on the up-weighted region seen on chromosome 6 (Fan et al. 2010), so our focus here is on the remaining chromosomes. In particular, we looked for clusters of neighboring SNPs showing a consistent signal. We've highlighted three regions of interest (figure 6) on chromosomes 9p21.2, 17q24.2, and 18q12.2. The strongest signal on chromosome 9p21.2, rs17760820, resides in an intron of open reading frame C9orf82, with four nearby SNPs at p < .001 residing in introns of the intraflagellar transport 74 homolog (IFT74). The two genes are 54 kb apart, and the SNPs in IFT74 are in moderate LD with the SNPs in C9orf82. On chromosome 17q24.2, the notable cluster of neighboring signals all reside in an intergenic region. The top signal, rs16974356, is 220 kb telomeric of the mitogen-activated protein kinase kinase 6 (MAP2K6) gene, and 312 kb centromeric of the potassium inwardly-rectifying channel, subfamily J, member 16 (KCNJ16) gene. All the SNPs in this region with weighted p < .001 are in relatively high LD in this intergenic region. The SNP cluster on chromosome 18q12.2 also resides outside of a gene, with the nearest transcript being hypothetical protein LOC647946 where the 5′ end is 199 kb away from the top signal in the region, rs2862294. Although most of the nearby SNPs with weighted p < .001 are in LD with rs2862294, a few SNPs show no LD despite their close proximity.
Figure 5.
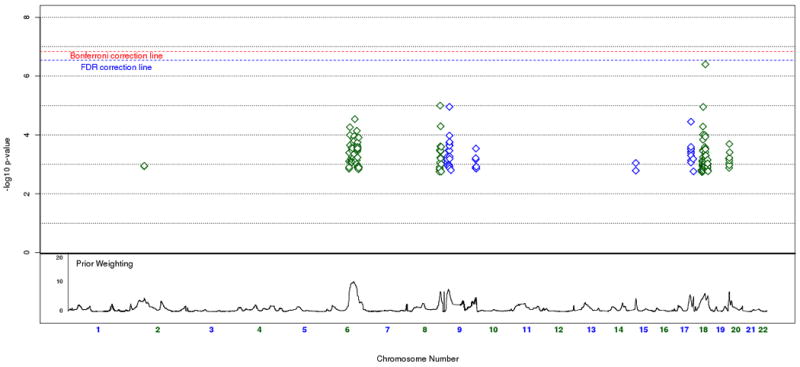
Up-weighted regions of interest. Cumulative weighted association plot of all SNPs with an unweighted p-value above the 99th percentile and above the 95th percentile of linkage weights. Prior weighting is shown at the bottom of the plot. Significance after Bonferroni correction is shown in red, and significance after FDR correction at 0.1 is shown in blue.
Figure 6A, B, and C.
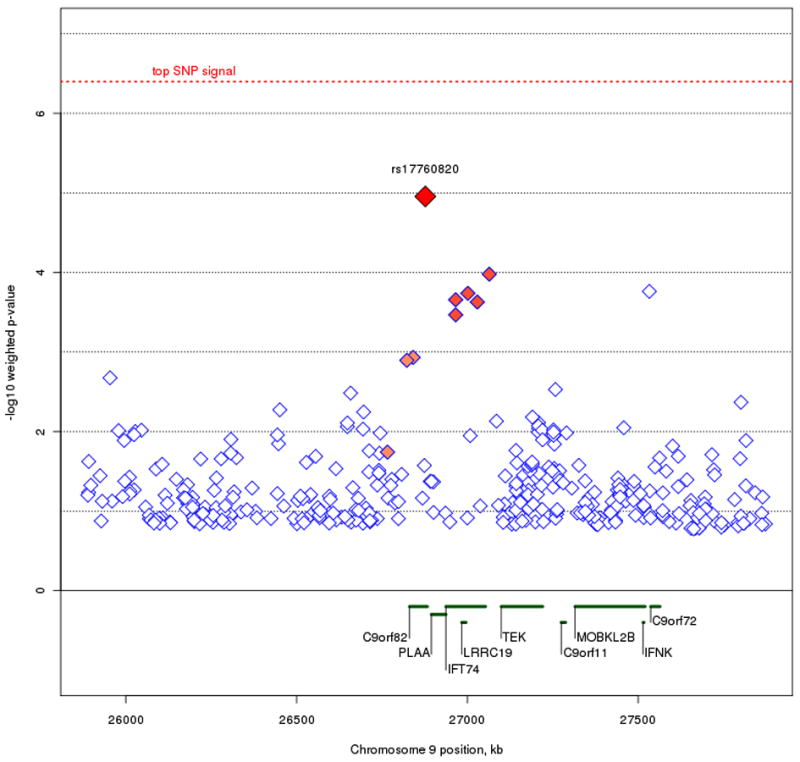
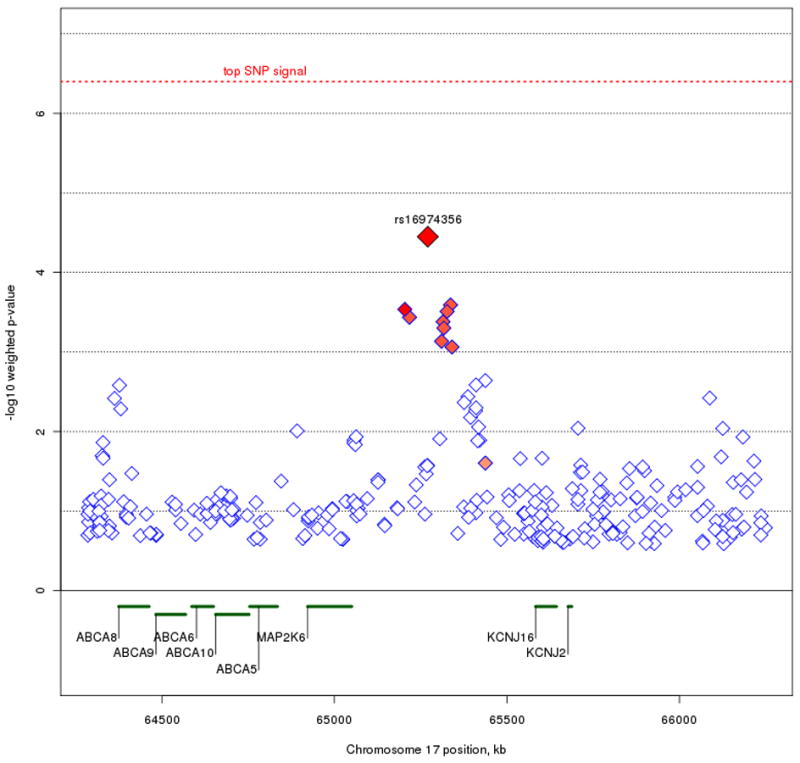
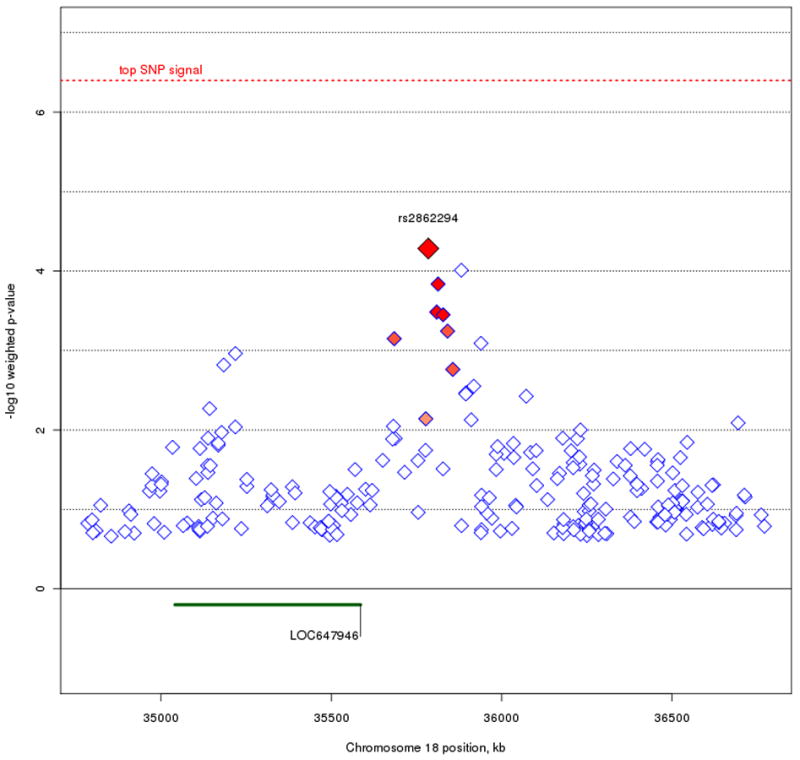
Plots of the three regions of interest. Figure 6A represents the C9orf82 signal on chromosome 9p21.1. Figure 6B represents the signal on chromosome 17q24.2. Figure 6C represents the signal on chromosome 18q12.2. The most associated SNP is marked in red. The color of the remaining SNPs reflects linkage disequilibrium (r2) with the most associated SNP (increasing red hue marks stronger r2). Gene regions are shown in green, and were taken from the March 2006 UCSC genome browser assembly.
Discussion
The primary goal of this study was to examine how prior linkage information could inform association signals for BPD across the genome. Using a linkage-weighted FDR approach, we've highlighted particular regions that would not have been addressed by association alone. Although no signal reached the conservative criteria of genome-wide significance, we report on a few areas where linkage evidence and strong association signals coincide.
Our strongest association signal, rs4939921 in MYO5B, was expected, as it was also the top SNP prior to the weighted association. In addition, this was the top signal reported in Sklar et al. (2008) where the STEP-BD sample was combined with another large BPD sample from the University College of London. MYO5B is a brain-expressed gene that is involved in protein transport and vesicle trafficking at the plasma membrane (Lise et al. 2006; Lapierre and Goldenring 2005), RNA transcription (Lindsay and McCaffrey 2009), and has recently been implicated in microvillus inclusion disease, a rare genetic disorder of the small intestine (Erickson et al. 2008; Muller et al. 2008). Although our prior linkage information up-weights this signal at MYO5B, a recent meta-analysis combining the STEP-BD sample with a number of other case-control BPD samples finds no evidence of association in this region (Ferreira et al. 2008). Our second strongest signal, rs4852259 in DYSF, resides in a gene that codes for skeletal muscle protein, and non-synonymous mutations in DYSF have resulted in limb girdle muscular dystrophy and Miyoshi myopathy (Bashir et al. 1998; Liu et al. 1998). In our literature review of DYSF, we did not find any evidence of brain expression or psychiatric effects of this gene.
We also identified genes in regions where prior linkage information and association signals coincide. At chromosome 9p21.1, signals reside in both C9orf82 and IFT74. While there is currently no known information on C9orf82, IFT74 (also known as capillary morphogenesis protein 1: CMG1) is a brain-expressed gene, whereby it codes a protein that transports material from the cell body along the dendritic and axonal processes of neurons (Momeni et al. 2006). IFT74 has been implicated in familial cases of amyotrophic lateral sclerosis (ALS) - frontotemporal dementia (FTD), although common SNPs do not seem to be implicated as causal variants of ALS-FTD (Xiao et al. 2008). On chromosome 17q24.2, none of the association signals occur within or adjacent to genes (all signals with weighted p < .001 are greater than 100 kb away from the nearest gene). The nearest genes that flank the signal are MAP2K6, part of the kinase mediated signal transduction pathway involved in cell cycle arrest, transcription activation, and apoptosis; and KCNJ16, coding a membrane protein that regulates potassium channel activity. Of note, MAP2K6 has been associated in mediating the onset of Huntington's disease (Arning et al. 2008), and KCNJ16 reflects ion channel activity, which has recently been implicated as a possible source of BPD pathogenesis (Ferreira et al. 2008). We can only speculate that the association signal may be involved in some sort of regulatory function relative to these genes. For the signal on chromosome 18q12.2, the current UCSC genome browser contains only a hypothetical gene, location 647946, in the region. Further annotation is necessary to determine whether location 647946 is indeed a coding region, and no functional information is currently known about it.
By incorporating genome-wide linkage and association data on BPD, we hope to identify susceptibility alleles and genes that would have otherwise been overlooked by any single method of genome-wide interrogation. Due to the conservative nature of genome-wide significance in association designs, true signals of small effect are inevitably overlooked. Prior linkage data serves to aid in their detection as it provides independent marker information on BPD across the genome. We should note that while our prior linkage information came from a substantial pool of linkage studies, this method could certainly be applied with data from a single linkage study. Although weighted designs with informative prior information maximize any potential power gains, the loss in power is small when using uninformative prior information (Roeder et al., 2006). Given that linkage signals are better suited to detect rarer alleles of high penetrance, we believe this method will be even more helpful as future GWAS increase the coverage of rarer SNP and CNV variants (MAF < .05) to their analyses. Furthermore, recent work using simulation and known genetic associations postulates that signals found in GWAS could actually be “synthetic associations” driven by rare genetic variants (Dickson et al. 2010). In this respect, combining linkage and association data can be useful in highlighting areas that are most promising for future sequencing studies; studies that would be able to putatively identify the effects of rare variants on BPD.
Acknowledgments
DP Howrigan's contribution to this work was partially supported by two institutional training grants from the National Institute of Child Health and Human Development (T32 HD007289, Michael C. Stallings, Director) and the National Institute of Mental Health (T32 MH016880, John K. Hewitt, Director) awarded to the Institute for Behavioral Genetics, University of Colorado. JW Smoller's contribution to this work was supported in part by the National Institute of Mental Health (MH063445).
Bibliography
- Abecasis GR, Cherny SS, Cookson WO, Cardon LR. Merlin--rapid analysis of dense genetic maps using sparse gene flow trees. Nat Genet. 2002;30(1):97–101. doi: 10.1038/ng786. [DOI] [PubMed] [Google Scholar]
- Arning L, Monte D, Hansen W, Wieczorek S, Jagiello P, Akkad DA, et al. ASK1 and MAP2K6 as modifiers of age at onset in Huntington's disease. J Mol Med. 2008;86(4):485–490. doi: 10.1007/s00109-007-0299-6. [DOI] [PubMed] [Google Scholar]
- Bashir R, Britton S, Strachan T, Keers S, Vafiadaki E, Lako M, et al. A gene related to Caenorhabditis elegans spermatogenesis factor fer-1 is mutated in limb-girdle muscular dystrophy type 2B. Nat Genet. 1998;20(1):37–42. doi: 10.1038/1689. [DOI] [PubMed] [Google Scholar]
- Baum AE, Akula N, Cabanero M, Cardona I, Corona W, Klemens B, et al. A genome-wide association study implicates diacylglycerol kinase eta (DGKH) and several other genes in the etiology of bipolar disorder. Mol Psychiatry. 2008;13(2):197–207. doi: 10.1038/sj.mp.4002012. [DOI] [PMC free article] [PubMed] [Google Scholar]
- Cho HJ, Meira-Lima I, Cordeiro Q, Michelon L, Sham P, Vallada H, et al. Population-based and family-based studies on the serotonin transporter gene polymorphisms and bipolar disorder: a systematic review and meta-analysis. Mol Psychiatry. 2005;10(8):771–781. doi: 10.1038/sj.mp.4001663. [DOI] [PubMed] [Google Scholar]
- Detera-Wadleigh SD, McMahon FJ. G72/G30 in schizophrenia and bipolar disorder: review and meta-analysis. Biol Psychiatry. 2006;60(2):106–114. doi: 10.1016/j.biopsych.2006.01.019. [DOI] [PubMed] [Google Scholar]
- Dickson SP, Wang K, Krantz I, Hakonarson H, Goldstein DB. Rare variants create synthetic genome-wide associations. PLoS Biol. 2010;8(1):e1000294. doi: 10.1371/journal.pbio.1000294. [DOI] [PMC free article] [PubMed] [Google Scholar]
- Edvardsen J, Torgersen S, Roysamb E, Lygren S, Skre I, Onstad S, et al. Heritability of bipolar spectrum disorders. Unity or heterogeneity? J Affect Disord. 2008;106(3):229–240. doi: 10.1016/j.jad.2007.07.001. [DOI] [PubMed] [Google Scholar]
- Erickson RP, Larson-Thome K, Valenzuela RK, Whitaker SE, Shub MD. Navajo microvillous inclusion disease is due to a mutation in MYO5B. Am J Med Genet. 2008;146A(24):3117–3119. doi: 10.1002/ajmg.a.32605. [DOI] [PubMed] [Google Scholar]
- Fan J, Ionita-Laza I, McQueen MB, Devlin B, Purcell S, Faraone SV, et al. Linkage disequilibrium mapping of the chromosome 6q21-22.31 bipolar I disorder susceptibility locus. Am J Med Genet (Neuropsychiatr Genet) 2010;153B(1):29–37. doi: 10.1002/ajmg.b.30942. [DOI] [PMC free article] [PubMed] [Google Scholar]
- Ferreira MA, O'Donovan MC, Meng YA, Jones IR, Ruderfer DM, Jones L, et al. Collaborative genome-wide association analysis supports a role for ANK3 and CACNA1C in bipolar disorder. Nat Genet. 2008;40:1056–1058. doi: 10.1038/ng.209. [DOI] [PMC free article] [PubMed] [Google Scholar]
- Gilbody S, Lewis S, Lightfoot T. Methylenetetrahydrofolate reductase (MTHFR) genetic polymorphisms and psychiatric disorders: a HuGE review. Am J Epidemiol. 2007;165(1):1–13. doi: 10.1093/aje/kwj347. [DOI] [PubMed] [Google Scholar]
- Kong A, Cox NJ. Allele-sharing models: LOD scores and accurate linkage tests. Am J Hum Genet. 1997;61(5):1179–1188. doi: 10.1086/301592. [DOI] [PMC free article] [PubMed] [Google Scholar]
- Kremeyer B, Herzberg I, Garcia J, Kerr E, Duque C, Parra V, et al. Transmission distortion of BDNF variants to bipolar disorder type I patients from a South American population isolate. Am J Med Genet (Neuropsychiatr Genet) 2006;141B(5):435–439. doi: 10.1002/ajmg.b.30354. [DOI] [PubMed] [Google Scholar]
- Lapierre LA, Goldenring JR. Interactions of myosin vb with rab11 family members and cargoes traversing the plasma membrane recycling system. Methods Enzymol. 2005;403:715–723. doi: 10.1016/S0076-6879(05)03062-4. [DOI] [PubMed] [Google Scholar]
- Lasky-Su JA, Faraone SV, Glatt SJ, Tsuang MT. Meta-analysis of the association between two polymorphisms in the serotonin transporter gene and affective disorders. Am J Med Genet B Neuropsychiatr Genet. 2005;133B(1):110–115. doi: 10.1002/ajmg.b.30104. [DOI] [PubMed] [Google Scholar]
- Lindsay AJ, McCaffrey MW. Myosin Vb localises to nucleoli and associates with the RNA polymerase I transcription complex. Cell Motil Cytoskeleton. 2009;66(12):1057–1072. doi: 10.1002/cm.20408. [DOI] [PubMed] [Google Scholar]
- Lise MF, Wong TP, Trinh A, Hines RM, Liu L, Kang R, et al. Involvement of myosin Vb in glutamate receptor trafficking. J Biol Chem. 2006;281(6):3669–3678. doi: 10.1074/jbc.M511725200. [DOI] [PubMed] [Google Scholar]
- Liu J, Aoki M, Illa I, Wu C, Fardeau M, Angelini C, et al. Dysferlin, a novel skeletal muscle gene, is mutated in Miyoshi myopathy and limb girdle muscular dystrophy. Nat Genet. 1998;20(1):31–36. doi: 10.1038/1682. [DOI] [PubMed] [Google Scholar]
- Mansour HA, Talkowski ME, Wood J, Pless L, Bamne M, Chowdari KV, et al. Serotonin gene polymorphisms and bipolar I disorder: focus on the serotonin transporter. Ann Med. 2005;37(8):590–602. doi: 10.1080/07853890500357428. [DOI] [PubMed] [Google Scholar]
- McGough JJ, Loo SK, McCracken JT, Dang J, Clark S, Nelson SF, et al. CBCL Pediatric Bipolar Disorder Profile and ADHD: Comorbidity and Quantitative Trait Loci Analysis. J Am Acad Child Adolesc Psychiatry. 2008;47(10):1151–1157. doi: 10.1097/CHI.0b013e3181825a68. [DOI] [PMC free article] [PubMed] [Google Scholar]
- McQueen MB, Devlin B, Faraone SV, Nimgaonkar VL, Sklar P, Smoller JW, et al. Combined analysis from eleven linkage studies of bipolar disorder provides strong evidence of susceptibility loci on chromosomes 6q and 8q. Am J Hum Genet. 2005;77(4):582–595. doi: 10.1086/491603. [DOI] [PMC free article] [PubMed] [Google Scholar]
- Merikangas KR, Akiskal HS, Angst J, Greenberg PE, Hirschfeld RM, Petukhova M, et al. Lifetime and 12-month prevalence of bipolar spectrum disorder in the National Comorbidity Survey replication. Arch Gen Psychiatry. 2007;64(5):543–552. doi: 10.1001/archpsyc.64.5.543. [DOI] [PMC free article] [PubMed] [Google Scholar]
- Momeni P, Schymick J, Jain S, Cookson MR, Cairns NJ, Greggio E, et al. Analysis of IFT74 as a candidate gene for chromosome 9p-linked ALS-FTD. BMC Neurol. 2006;6(44) doi: 10.1186/1471-2377-6-44. [DOI] [PMC free article] [PubMed] [Google Scholar]
- Muller DJ, Serretti A, Sicard T, Tharmalingam S, King N, Artioli P, et al. Further evidence of MAO-A gene variants associated with bipolar disorder. Am J Med Genet (Neuropsychiatr Genet) 2007;144B(1):37–40. doi: 10.1002/ajmg.b.30380. [DOI] [PubMed] [Google Scholar]
- Muller T, Hess MW, Schiefermeier N, Pfaller K, Ebner HL, Heinz-Erian P, et al. MYO5B mutations cause microvillus inclusion disease and disrupt epithelial cell polarity. Nat Genet. 2008;40(10):1163–1165. doi: 10.1038/ng.225. [DOI] [PubMed] [Google Scholar]
- Neves-Pereira M, Mundo E, Muglia P, King N, Macciardi F, Kennedy JL. The brain-derived neurotrophic factor gene confers susceptibility to bipolar disorder: evidence from a family-based association study. Am J Hum Genet. 2002;71(3):651–655. doi: 10.1086/342288. [DOI] [PMC free article] [PubMed] [Google Scholar]
- Roeder K, Devlin B, Wasserman L. Improving power in genome-wide association studies: weights tip the scale. Genet Epidemiol. 2007;31(7):741–747. doi: 10.1002/gepi.20237. [DOI] [PubMed] [Google Scholar]
- Roeder K, Bacanu SA, Wasserman L, Devlin B. Using linkage genome scans to improve power of association in genome scans. Am J Hum Genet. 2006;78(2):243–252. doi: 10.1086/500026. [DOI] [PMC free article] [PubMed] [Google Scholar]
- Sachs GS, Thase ME, Otto MW, Bauer M, Miklowitz D, Wisniewski SR, et al. Rationale, design, and methods of the systematic treatment enhancement program for bipolar disorder (STEP-BD) Biol Psychiatry. 2003;53(11):1028–1042. doi: 10.1016/s0006-3223(03)00165-3. [DOI] [PubMed] [Google Scholar]
- Sklar P, Smoller JW, Fan J, Ferreira MA, Perlis RH, Chambert K, et al. Whole-genome association study of bipolar disorder. Mol Psychiatry. 2008;13(6):558–569. doi: 10.1038/sj.mp.4002151. [DOI] [PMC free article] [PubMed] [Google Scholar]
- Sklar P, Gabriel SB, McInnis MG, Bennett P, Lim YM, Tsan G, et al. Family-based association study of 76 candidate genes in bipolar disorder: BDNF is a potential risk locus. Brain-derived neutrophic factor. Mol Psychiatry. 2002;7(6):579–593. doi: 10.1038/sj.mp.4001058. [DOI] [PubMed] [Google Scholar]
- Smoller JW, Finn CT. Family, twin, and adoption studies of bipolar disorder. Am J Med Genet (Semin Med Genet) 2003;123C(1):48–58. doi: 10.1002/ajmg.c.20013. [DOI] [PubMed] [Google Scholar]
- Storey JD. A direct approach to false discovery rates. Journal of the Royal Statistical Society: Series B (Statistical Methodology) 2002;64(3):479–498. Retrieved from http://www3.interscience.wiley.com/journal/118962341/abstract.
- Whittemore AS, Halpern J. A class of tests for linkage using affected pedigree members. Biometrics. 1994;50(1):118–127. Retrieved from http://www.ncbi.nlm.nih.gov/entrez/query.fcgi?cmd=Retrieve&db=PubMed&dopt=Citation&list_uids=8086596. [PubMed]
- Williams HJ, Norton N, Dwyer S, Moskvina V, Nikolov I, Carroll L, et al. Fine mapping of ZNF804A and genome-wide significant evidence for its involvement in schizophrenia and bipolar disorder. Mol Psychiatry. 2010 doi: 10.1038/mp.2010.36. [DOI] [PMC free article] [PubMed] [Google Scholar]
- WTCCC Genome-wide association study of 14,000 cases of seven common diseases and 3,000 shared controls. Nature. 2007;447(7145):661–678. doi: 10.1038/nature05911. [DOI] [PMC free article] [PubMed] [Google Scholar]
- Xiao S, Sato C, Kawarai T, Goodall EF, Pall HS, Zinman LH, et al. Genetic studies of GRN and IFT74 in amyotrophic lateral sclerosis. Neurobiol Aging. 2008;29(8):1279–1282. doi: 10.1016/j.neurobiolaging.2007.02.022. [DOI] [PubMed] [Google Scholar]


