Abstract
Objective
Current 2007 Partin Tables restricts the application of total PSA (tPSA) as a non-continuous biomarker by creating “groups” for the risk stratification with tPSA value of 0-2.5, 2.6-4.0, 4.1-6.0, 6.1-10.0, and >10.0 ng/ml. Hence we developed a “2010 Partin Nomogram” with tPSA as a continuous biomarker and employ “predictiveness curve” to calculate the percentile risk of a patient among the cohort.
Patients and Method
5730 and 1646 men were treated with radical prostatectomy (without neoadjuvant therapy) between 2000 and 2005 at the Johns Hopkins Hospital (JHH) and University Clinic Hamburg-Eppendorf (UCHE) respectively. Multinomial logistic regression analysis was performed to create a model for predicting risk of the four non-ordered pathologic stages i.e. organ-confined disease (OC), extraprostatic extension (EPE), seminal vesicle (SV+) and lymph node (LN+) involvement. Patient-specific risk was modelled as a function of the B-spline basis of tPSA (knots at the 1st, 2nd, and 3rd quartiles), clinical stage (T1c, T2a, and T2b/T2c) and biopsy Gleason score (5-6, 3+4=7, 4+3=7, 8-10).
Results
The “2010 Partin Nomogram” calculates patient-specific absolute risk for all four pathological outcomes (OC, EPE, SV+, LN+) given a patient's pre-operative clinical stage, tPSA, and biopsy Gleason score. While having comparable performance in terms of calibration and discriminatory power, this new model provides a more accurate prediction of patients’ pathological stage compared to the 2007 Partin Tables model. Further, the use of “predictiveness curves” has made possible to obtain percentile risk of a patient among the cohort and to also gauge the impact of risk thresholds for making decision regarding radical prostatectomy.
Conclusions
The “2010 Partin Nomogram” using tPSA as a continuous biomarker together with the corresponding “predictiveness curve” will aid clinicians and patients to make improved treatment decisions.
INTRODUCTION
Prostate cancer (PCa) is the second most common cancer diagnosed and the sixth most common cause of cancer death among men in the world, with about six-fold difference between high-incidence and low-incidence countries [1]. . The majority of men with clinically localized PCa are treated with radical prostatectomy (RP) or radiotherapy, which provides excellent cancer control [2]. However, there is no consensus regarding the optimal management of locally advanced PCa [3].
The preoperative ability to accurately predict pathologic stage of PCa permits improved patient counselling, more appropriate selection of treatment plan or risk-stratification for novel clinical trials for those with more advanced disease. Our group and others have published algorithms and nomograms predicting the pathologic stage of men with localized PCa [4-13]. The Partin Tables were updated in 2007 to reflect stage migration and it continues to provide a clinically useful adjunct to predict the pathological stage of PCa patients [7]. The 2007 Partin Tables have recently been successfully validated [14, 15]. The 2007 Partin Tables [7] utilized clinical stage, biopsy Gleason score and total prostate-specific antigen (tPSA) information to estimate the pathologic extent of disease. However, usefulness of tPSA was limited by creating “groups” for the risk stratification of patients with tPSA value of 0-2.5, 2.6-4.0, 4.1-6.0, 6.1-10.0, and >10.0 ng/ml.
Hence, we developed “2010 Partin Nomogram” for predicting patients’ pathologic stages based on tPSA measured at a continuous scale, clinical stage, and biopsy Gleason score. Moreover, we propose to provide clinicians and patients with the risk quantile plots, named the predictiveness curve [16] for each individual pathologic stage outcome as an additional tool for patient-specific decision making.
MATERIALS AND METHODS
The Johns Hopkins Hospital (JHH) Patient Cohort
The institutional review board at JHH approved this study and when required, written informed consent was obtained from study participants. From 2000 to 2005, a total of 5988 men were identified with PCa who underwent RP and staging pelvic lymphadenectomy at the JHH by any of 22 attending surgeons. All men enrolled had preoperative serum tPSA level assessed on an ambulatory basis before RP either before or at least 4 weeks after prostate biopsy, biopsy Gleason score determined at JHH, and clinical stage assigned by the attending physician (American Joint Committee on Cancer TNM staging system, 1992/2002) of T1c or T2a/b/c. Patients were excluded from the cohort when they lacked this information (n = 29), received preoperative neoadjuvant hormonal therapy (n = 107), pathologic diagnoses other than adenocarcinoma of the prostate (n = 7), absence of cancer on pathology (n = 4), or missing pathologic information (n = 33), preoperative treatment with 5-alpha reductase inhibitors (n = 71), chemotherapy (n = 5), or androgenic/estrogenic herbal therapies (n = 1). Additionally, 30 patients with tumour extending to an inked surgical margin of the prostate could not be interpreted as organ confined (OC) versus extraprostatic extension (EPE) were also excluded. One patients with biopsy Gleason score 2 + 2 = 4 was also excluded [17], leaving a cohort of 5730 patients (Table 1).
Table 1.
Demographic, clinical and pathologic information of patients in the JHH and UCHE cohorts.
| Variable | JHH | UCHE | P-value* |
|---|---|---|---|
| (N = 5730) | (N = 1646) | ||
| Age (years) | 57.4 ± 6.4 | 61.9 ± 5.7 | <2.2e-16 |
| PSA (ng/ml) | <2.2e-16 | ||
| <=2.5 | 452 (7.9) | 67 (4.1) | |
| 2.6 - 4.0 | 946 (16.5) | 211 (12.8) | |
| 4.1 - 6.0 | 1994 (34.8) | 434 (26.4) | |
| 6.1 - 8.0 | 1093 (19.1) | 354 (21.5) | |
| 8.1 - 10 | 578 (10.1) | 199 (12.1) | |
| >10 | 667 (11.6) | 381 (23.1) | |
| Clinical Stage | 8.1e-6 | ||
| T1c | 4419 (77.1) | 1207 (73.3) | |
| T2a | 998 (17.4) | 297 (18.0) | |
| T2b/c | 313 (5.5) | 142 (8.7) | |
| Biopsy Gleason score (%) | <2.2e-16 | ||
| <7 | 4402 (76.8) | 1059 (64.3) | |
| 3+4 =7 | 816 (14.2) | 403 (24.5) | |
| 4+3 = 7 | 348 (6.1) | 127 (7.7) | |
| >7 | 164 (2.9) | 57 (3.5) | |
| Organ confined (%) | 0.531 | ||
| Yes | 4204 (73.4) | 1221 (74.2) | |
| No | 1526 (26.6) | 425 (25.8) | |
| Extraprostatic extension (%) | 1.7e-6 | ||
| No | 4454 (77.7) | 1370 (83.2) | |
| Yes | 1276 (22.3) | 276 (16.8) | |
| Seminal vesicle involvement (%) | 5.9e-11 | ||
| No | 5550 (96.9) | 1535 (93.3) | |
| Yes | 180 (3.1) | 111 (6.7) | |
| Lymph node involvement (%) | 0.0018 | ||
| No | 5660 (98.8) | 1608 (97.7) | |
| Yes | 70 (1.2) | 38 (2.3) | |
p-value comparing JHH and UCHE based on two-sample t-test for continuous covariates and based on Chi-square test for discrete covariates
Pathologic Examination
All pelvic lymph nodes removed at surgery were sectioned and examined for the presence of cancer. The surgical specimen, the prostate and seminal vesicles were analyzed and the pathologic stage determined as OC if all cancer was confined within the prostate, EPE if cancer was evident outside the prostate and the seminal vesicles and the pelvic lymph nodes were free of disease, positive seminal vesicle involvement (SV+) if tumour invaded the muscular wall of the seminal vesicle without lymph node involvement, and lymph node involvement (LN+) if the pelvic lymph nodes demonstrated PCa.
University Clinic Hamburg-Eppendorf (UCHE) Patient Cohort
The cohort used for validating the risk models consist 1646 men who underwent RP (without neoadjuvant therapy) and staging pelvic lymphadenectomy between 2000 and 2005 at the UCHE. All patients included in the validation set have previously agreed to the scientific evaluation of their data. The characteristics of this validation cohort are presented in the Table 1.
Statistical Analysis
All data was analyzed using R version 2.7.1 (http://www.r-project.org/) statistical analysis software. Multinomial logistic regression analysis was performed to develop a model for predicting risk of the four non-ordered pathologic stage categories: OC, EPE, SV+, or LN+ based on the JHH cohort. Risk of following into each pathologic stage category was modelled as a function of natural B-spline basis of preoperative tPSA (with knots at the 1st, 2nd, and 3rd quartiles), clinical stage (AJCC-TNM 1992/2002) categorized as T1c, T2a, T2b/c, and biopsy Gleason score categorized as 5-6, 3+4=7, 4+3=7, and 8-10.
The “2010 Partin Nomogram” risk prediction capacity among patients meeting current RP criteria in the JHH cohort was characterized by the “predictiveness curves” using the method developed in Huang, Pepe, and Feng [16]. We calculated Risk for each subject in the cohort based on the risk model and make a quantile plot based on the estimated Risk. Consider a point on the curve with x-coordinate of value v, and then the value of its y-coordinate is the 100×vth percentile of Risk in the population. On the other hand, for a particular point on the curve, suppose the value of its y-coordinate is p, then the value of its x-coordinate corresponds to the percentage of subjects in the population with Risk smaller than or equal to p (i.e., the cumulative distribution function (CDF) of Risk at p). The CDF of Risk is a conceptually meaningful measure to clinicians and surgeons. We utilized bootstrap resampling with 1000 replications in order to generate 95% pointwise confidence intervals for these predictiveness curves.
RESULTS
The demographic, clinical and pathologic information of the JHH cohort and the UCHE cohort are shown in Table 1. Compared to the JHH cohort, subjects in the UCHE cohort appear to be older with higher PSA (p-value <0.01 based on two-sample t test), higher Gleason score, lower proportion of EPE, and higher proportion ofSV+ and LN+ (p-value < 0.01 based on chi-square test).
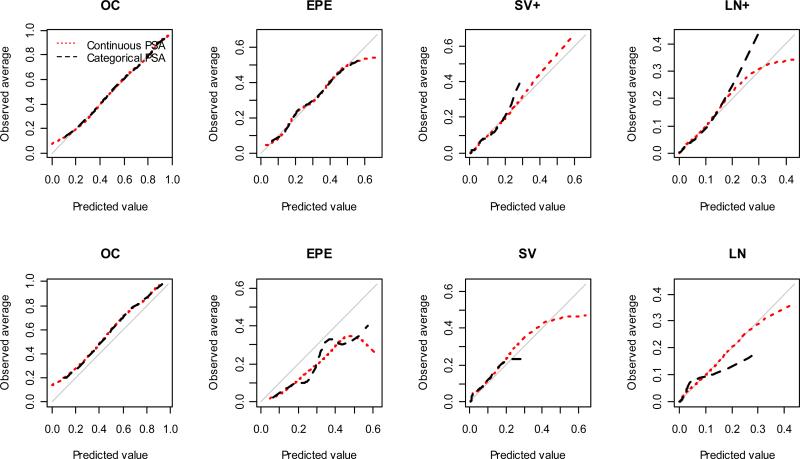
Calibration plots for each pathological stage are displayed in Figure 1. In the JHH cohort, both risk models are in general well calibrated for each pathological stage. For LN+, the model with categorical PSA has satisfying calibration when the predicted risk is smaller than 0.2, and tends to under-estimate the risk as the predicted risk gets larger; the model with continuous PSA has good calibration when the predicted risk is less than 0.3. Based on the validation UCHE cohort, the “2010 Partin Nomogram” model again has comparable calibration compared to the 2007 Partin Tables model [7]. Both models tend to slightly under-estimate the probability of OC and over-estimate the probability of EPE in the validation cohort. For LN+, the continuous PSA model is well calibrated when predicted risk is less than 0.3, whereas the categorical PSA model is well calibrated only for predicted risk less than 0.1. The larger spread of the predicted risk as a consequence of modelling PSA continuously is desirable since individual patient get a more accurate estimate of their risk especially for SV+ and LN+ pathology staging outcomes.
Figure 1.
Calibration plots for the risk model with categorical PSA and the risk model with continuous PSA estimated from the JHH dataset. The first row shows calibration of the risk models in the JHH dataset. The second row shows calibration of the risk models in the UCHE dataset.
The ROC curves for each pathological stage are shown in the Supplementary Figure 1. While maintaining a comparable performance regarding calibration and discriminatory power, the “2010 Partin Nomogram” provides an improved quantification of the risk by modelling tPSA as a continuous variable compared to the 2007 Partin Tables [7] where only categorized tPSA value was considered, as shown in the examples of Table 2. Use patients #6 and #7 as an example. They have same predicted risk of OC (46.6%) based on 2007 Partin Tables [7]. But with the “2010 Partin Nomogram”, their predicted probability of OC become 51.2% and 44.6% respectively, which could lead to a different treatment recommendation about RP if a decision rule of recommending only patients with OC probability larger than 50% for RP is used by a clinician. In another example, patients #16 to #20 have an estimated risk of LN+ around 4.0 to 4.5 based on the 2007 Partin Tables [7], but their predicted risks are much more spread out (2.9% to 7.3%) when PSA is modelled continuously.
Table 2.
Exemplary Results for Actual patient-specific risk for the four outcomes predicted by the 2007 Partin Tables and new “2010 Partin Nomogram”. All patients in the table have clinical stage T2a.
| 2007 Partin Tables |
2010 Partin Nomogram |
||||||||
|---|---|---|---|---|---|---|---|---|---|
| tPSA | OC | EPE | SN+ | LV+ | OC | EPE | SN+ | LV+ | |
| Gleason 5-6 | |||||||||
| Patient #1 | 4.1 | 71.4 | 26.9 | 1.4 | 0.4 | 74.6 | 24.1 | 1.1 | 0.2 |
| Patient #2 | 6 | 71.4 | 26.9 | 1.4 | 0.4 | 70.1 | 27.8 | 1.7 | 0.4 |
| Patient #3 | 6.1 | 68.5 | 29.3 | 1.8 | 0.3 | 69.9 | 28 | 1.7 | 0.4 |
| Patient #4 | 8 | 68.5 | 29.3 | 1.8 | 0.3 | 67 | 30.5 | 1.9 | 0.6 |
| Patient #5 | 10 | 68.5 | 29.3 | 1.8 | 0.3 | 64 | 33.3 | 2 | 0.7 |
| Gleason 3+4 | |||||||||
| Patient #6 | 4.1 | 46.6 | 43.8 | 7.1 | 2.5 | 51.2 | 41.4 | 5.9 | 1.5 |
| Patient #7 | 6 | 46.6 | 43.8 | 7.1 | 2.5 | 44.6 | 44.1 | 8.5 | 2.7 |
| Patient #8 | 6.1 | 42.8 | 45.8 | 9.1 | 2.3 | 44.4 | 44.2 | 8.6 | 2.8 |
| Patient #9 | 8 | 42.8 | 45.8 | 9.1 | 2.3 | 40.9 | 46.4 | 9.2 | 3.4 |
| Patient #10 | 10 | 42.8 | 45.8 | 9.1 | 2.3 | 37.6 | 48.8 | 9.6 | 4 |
| Gleason 4+3 | |||||||||
| Patient #11 | 4.1 | 34.4 | 53.7 | 7.1 | 4.8 | 39.3 | 51.9 | 6 | 2.8 |
| Patient #12 | 6 | 34.4 | 53.7 | 7.1 | 4.8 | 33 | 53.5 | 8.4 | 5.1 |
| Patient #13 | 6.1 | 31.3 | 55.4 | 8.9 | 4.3 | 32.8 | 53.6 | 8.4 | 5.2 |
| Patient #14 | 8 | 31.3 | 55.4 | 8.9 | 4.3 | 29.7 | 55.2 | 8.8 | 6.3 |
| Patient #15 | 10 | 31.3 | 55.4 | 8.9 | 4.3 | 26.8 | 57 | 9 | 7.1 |
| Gleason 8-10 | |||||||||
| Patient #16 | 4.1 | 39.2 | 45.7 | 10.7 | 4.5 | 43.8 | 44 | 9.3 | 2.9 |
| Patient #17 | 6 | 39.2 | 45.7 | 10.7 | 4.5 | 36.7 | 45.2 | 12.9 | 5.1 |
| Patient #18 | 6.1 | 35.5 | 47 | 13.5 | 4 | 36.5 | 45.3 | 13 | 5.2 |
| Patient #19 | 8 | 35.5 | 47 | 13.5 | 4 | 33.2 | 46.8 | 13.7 | 6.3 |
| Patient #20 | 10 | 35.5 | 47 | 13.5 | 4 | 30.1 | 48.6 | 14 | 7.3 |
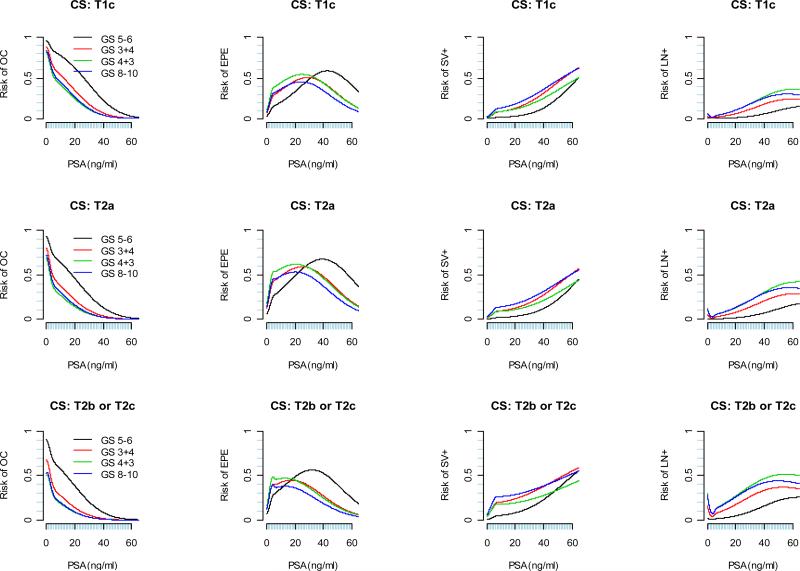
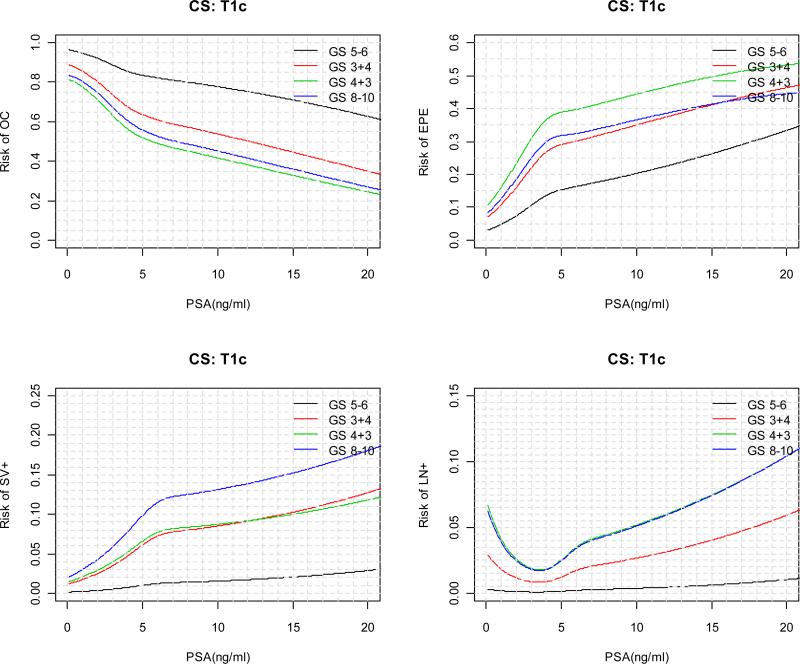
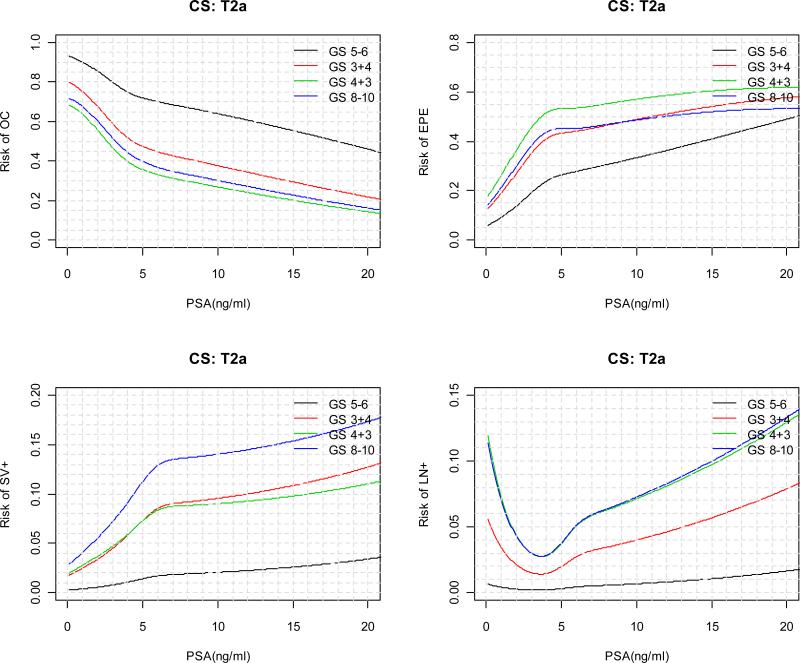
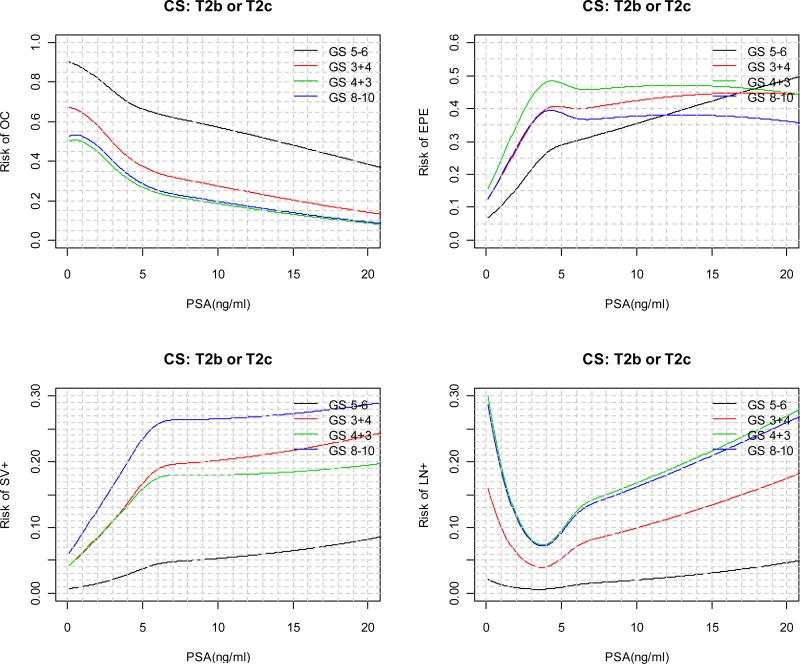
The predicted risks for each pathological outcome as a function of continuous PSA are displayed in Figure 2 for each clinical stage and biopsy Gleason score category. For patients with a particular clinical stage and biopsy Gleason score, as tPSA value increases, the risk of OC is monotone decreasing; the absolute risk of SV+ and LN+ are in general monotone increasing; the risks of EPE, on the other hand, tends to increase first and then decrease. In general, the decrease in the risk of EPE starts at lower tPSA value for patients with higher biopsy Gleason score and clinical stage. In practice, “2010 Partin Nomogram” as displayed in Figure 3 can be used by clinician to predict a patient's clinical stage.
Figure 2.
“2010 Partin Nomogram”: Risk of OC, EPE, SV+, LN+ as a function of continuous PSA, clinical stage, and biopsy Gleason score.
Figure 3.
“2010 Partin Nomogram” for predicting risk of OC, EPE, SV+, LN+ as a function of continuous PSA (≤ 20 ng/ml), clinical stage, and biopsy Gleason score.
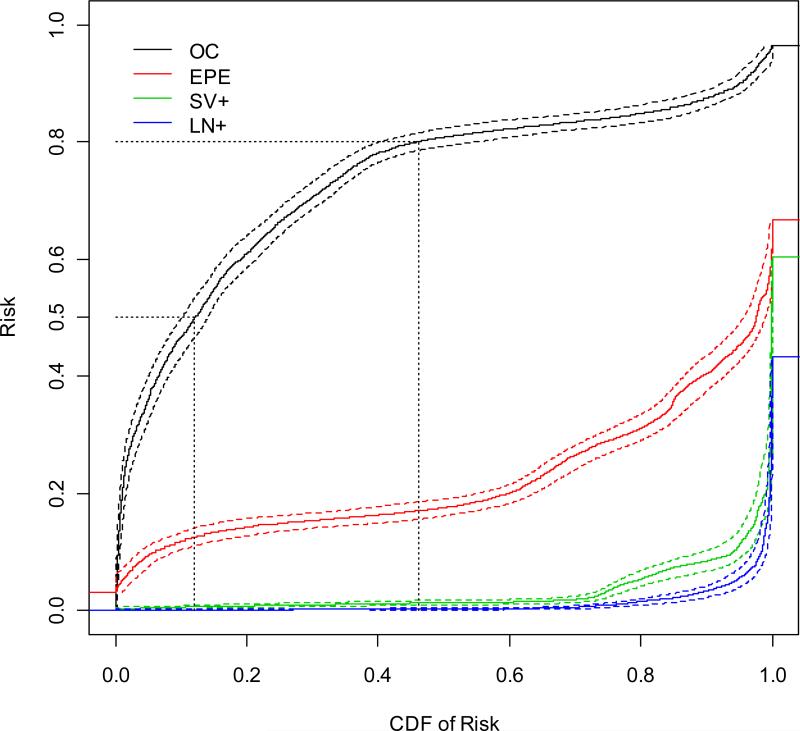
We generated the predictiveness curves for OC, EPE, SV+, and LN+ based on the proposed risk model. These curves together with their 95% pointwise bootstrap confidence intervals are displayed in Figure 4. In these curves, for a chosen x-coordinate value v, the corresponding value on the y-coordinate tells us about the 100vth percentile for the predicted risk of each pathological outcome. For example, the 10% risk percentile is 46.6% (95% CI=(43.4%, 50.0%)) for OC, 11.9% (95% CI=(10.4%, 13.3%)) for EPE, 0.59% (95% CI=(0.30%, 0.83%)) for SV+, and 0.11% (95% CI=(0.03%, 0.19%)) for LN+. On the other hand, fixing a value of interest on the y-axis, the corresponding value on the x-axis tells us about the percentage of subjects in the population with risk smaller the value of interest. For example, suppose there exist a pre-determined low risk threshold pL=0.5 and high risk threshold pH=0.8 for OC, such that if a patient's risk of OC is less than pL (higher than pH) then he is recommended against (for) RP. Then from Figure 3, when OC is considered, the CDF for pL is 12.1% with 95% CI (10.1%, 14.0%), 1-CDF for pH is 53.8% with 95% CI (44.9%, 59.7%). This implies that given the particular low and high risk thresholds, 53.8% of subjects in the population will be recommended RP and 12.1% will be recommended against it. Subsequently for 34.1% subjects in the population, the treatment recommendation is indecisive based on the current test. These types of information are useful for clinical decision makers to gauge the impact of given thresholds for RP. Moreover, when individual patients are concerned, knowing the percentage of subjects in the population with predicted risk less than one's predicted risk is also valuable to one's decision making in addition to the absolute risk itself.
Figure 4.
The predictiveness curves (solid lines) based on the “2010 Partin Nomogram” with regression spline of continuous tPSA, clinical stage, and biopsy Gleason score, as well as their 95% percentile bootstrap confidence intervals (dashed lines).
DISCUSSION
The accurate prediction of the pathological stage of PCa is critical as it may impact a patient's selection of treatment options [3]. The pre-treatment status of men diagnosed with PCa today, in the PSA screening era, has changed as evidenced by the major shifts that have occurred in tPSA level, biopsy Gleason score and clinical stage at the time of diagnosis, resulting in the increasing probability that they will have pathologically OC disease [3, 9, 18]. The Partin Tables has evolved during the last 15 years to adjust to major shifts in the presentation of contemporary PCa cases treated at JHH [4-7].
We applied a new model with B-spline basis for tPSA to evaluate the predicted probability (Risk) of a specific pathologic stage outcome (OC, EPE, SV+, or LN+) for this cohort. The “2010 Partin Nomogram” provides an improved quantification of the risk by modelling tPSA as a continuous variable compared to the 2007 Partin Tables [7] while achieving a comparable calibration and discriminatory performance as demonstrated in a validation set. In addition, we provided the risk quantile plots accompanying the new risk model which can be used to obtain the percentile value of a PCa patient's risk in the cohort and the percent of subjects in the population that would be recommended to undergo treatment given a risk threshold of interest. This information should prove useful to clinicians in selecting risk thresholds for RP and to individual patients in making treatment decision.
Notable in our study, JHH patient cohort has only 7% African American patients, therefore usefulness of Partin Tables in this ethnicity may be questionable especially when studies have shown some disparity in the biology of PCa between African American and Caucasian men [19-21]. However, Heath et al. [22] in a large multiethnic cohort of 3748 men with 32% African American showed that 2001 Partin Tables [6] performed equally well in both racial groups despite being difference in baseline clinical characteristics. In addition, the number of patients in our JHH cohort with PSA >20 ng/ml was 0.2%, and hence the utility of the risk model developed in men with PSA value >20 ng/ml might be questionable. Risk of OC with biopsy Gleason score 8-10 is slightly higher than that of Gleason score 4+3=7 because these patients are carefully selected for having limited Gleason score 8-10 cancer on biopsy at JHH after negative workup for metastasis (negative bone scan or negative CT). Additional pre-treatment variables such as quantitative pathology information (number of positive cores, total area of cancer on the biopsies), other PSA derivatives, PSA kinetics and tumour imaging may be useful to more accurately predict pathologic staging [23, 24]. We plan to attempt such an approach with a database that has all these variables. Further, the use of validated molecular biomarkers from the genome, proteome or metabolome may be proved useful to augment the predictive accuracy for PCa pathologic stage prediction [25, 26]
In conclusion, using tPSA as a continuous biomarker to construct “2010 Partin Nomogram” has demonstrated an improvement compared to the 2007 Partin Tables to predict pathologic stage outcome. We intend to develop a user-friendly computer program to allow the easy use by physician of the “2010 Partin Nomogram” and the corresponding predictiveness curves for patient-specific pathologic stage outcome prediction.
Supplementary Material
Acknowledgements
Funding for this project was provided by The Patana Fund, The Prostate Cancer Foundation, The Johns Hopkins University Prostate Cancer SPORE (Grant number: P50CA58236), and the Early Detection Research Network (EDRN) NCI/NIH (Grant number CA086323-06).
Reference
- 1.Baade PD, Youlden DR, Krnjacki LJ. International epidemiology of prostate cancer: geographical distribution and secular trends. Mol Nutr Food Res. 2009 Feb;53:171–84. doi: 10.1002/mnfr.200700511. [DOI] [PubMed] [Google Scholar]
- 2.Gerber GS, Thisted RA, Scardino PT, et al. Results of radical prostatectomy in men with clinically localized prostate cancer. Jama. 1996 Aug 28;276:615–9. [PubMed] [Google Scholar]
- 3.Campbell MF, Wein AJ, Kavoussi LR. In: Campbell-Walsh urology editor-in-chief, Alan J. Wein. 9th edn Kavoussi Louis R., et al., editors. W.B. Saunders; Philadelphia: 2007. [Google Scholar]
- 4.Partin AW, Yoo J, Carter HB, et al. The use of prostate specific antigen, clinical stage and Gleason score to predict pathological stage in men with localized prostate cancer. The Journal of urology. 1993 Jul;150:110–4. doi: 10.1016/s0022-5347(17)35410-1. [DOI] [PubMed] [Google Scholar]
- 5.Partin AW, Kattan MW, Subong EN, et al. Combination of prostate-specific antigen, clinical stage, and Gleason score to predict pathological stage of localized prostate cancer. A multi-institutional update. Jama. 1997 May 14;277:1445–51. [PubMed] [Google Scholar]
- 6.Partin AW, Mangold LA, Lamm DM, Walsh PC, Epstein JI, Pearson JD. Contemporary update of prostate cancer staging nomograms (Partin Tables) for the new millennium. Urology. 2001 Dec;58:843–8. doi: 10.1016/s0090-4295(01)01441-8. [DOI] [PubMed] [Google Scholar]
- 7.Makarov DV, Trock BJ, Humphreys EB, et al. Updated nomogram to predict pathologic stage of prostate cancer given prostate-specific antigen level, clinical stage, and biopsy Gleason score (Partin tables) based on cases from 2000 to 2005. Urology. 2007 Jun;69:1095–101. doi: 10.1016/j.urology.2007.03.042. [DOI] [PMC free article] [PubMed] [Google Scholar]
- 8.Kattan MW, Stapleton AM, Wheeler TM, Scardino PT. Evaluation of a nomogram used to predict the pathologic stage of clinically localized prostate carcinoma. Cancer. 1997 Feb 1;79:528–37. [PubMed] [Google Scholar]
- 9.Veltri RW, Miller MC, Partin AW, Poole EC, O'Dowd GJ. Prediction of prostate carcinoma stage by quantitative biopsy pathology. Cancer. 2001 Jun 15;91:2322–8. [PubMed] [Google Scholar]
- 10.Haese A, Chaudhari M, Miller MC, et al. Quantitative biopsy pathology for the prediction of pathologically organ-confined prostate carcinoma: a multiinstitutional validation study. Cancer. 2003 Feb 15;97:969–78. doi: 10.1002/cncr.11153. [DOI] [PubMed] [Google Scholar]
- 11.Ohori M, Kattan MW, Koh H, et al. Predicting the presence and side of extracapsular extension: a nomogram for staging prostate cancer. The Journal of urology. 2004 May;171:1844–9. doi: 10.1097/01.ju.0000121693.05077.3d. discussion 9. [DOI] [PubMed] [Google Scholar]
- 12.Koh H, Kattan MW, Scardino PT, et al. A nomogram to predict seminal vesicle invasion by the extent and location of cancer in systematic biopsy results. The Journal of urology. 2003 Oct;170:1203–8. doi: 10.1097/01.ju.0000085074.62960.7b. [DOI] [PubMed] [Google Scholar]
- 13.Cagiannos I, Karakiewicz P, Eastham JA, et al. A preoperative nomogram identifying decreased risk of positive pelvic lymph nodes in patients with prostate cancer. The Journal of urology. 2003 Nov;170:1798–803. doi: 10.1097/01.ju.0000091805.98960.13. [DOI] [PubMed] [Google Scholar]
- 14.Karakiewicz PI, Bhojani N, Capitanio U, et al. External validation of the updated Partin tables in a cohort of North American men. The Journal of urology. 2008 Sep;180:898–902. doi: 10.1016/j.juro.2008.05.044. discussion -3. [DOI] [PubMed] [Google Scholar]
- 15.Yu JB, Makarov DV, Sharma R, Peschel RE, Partin AW, Gross CP. Validation of the partin nomogram for prostate cancer in a national sample. The Journal of urology. Jan;183:105–11. doi: 10.1016/j.juro.2009.08.143. [DOI] [PubMed] [Google Scholar]
- 16.Huang Y, Sullivan Pepe M, Feng Z. Evaluating the predictiveness of a continuous marker. Biometrics. 2007 Dec;63:1181–8. doi: 10.1111/j.1541-0420.2007.00814.x. [DOI] [PMC free article] [PubMed] [Google Scholar]
- 17.Epstein JI. Gleason score 2-4 adenocarcinoma of the prostate on needle biopsy: a diagnosis that should not be made. The American journal of surgical pathology. 2000 Apr;24:477–8. doi: 10.1097/00000478-200004000-00001. [DOI] [PubMed] [Google Scholar]
- 18.Han M, Partin AW, Pound CR, Epstein JI, Walsh PC. Long-term biochemical disease-free and cancer-specific survival following anatomic radical retropubic prostatectomy. The 15-year Johns Hopkins experience. The Urologic clinics of North America. 2001 Aug;28:555–65. doi: 10.1016/s0094-0143(05)70163-4. [DOI] [PubMed] [Google Scholar]
- 19.Haqq C, Li R, Khodabakhsh D, et al. Ethnic and racial differences in prostate stromal estrogen receptor alpha. The Prostate. 2005 Oct 1;65:101–9. doi: 10.1002/pros.20272. [DOI] [PubMed] [Google Scholar]
- 20.Hoffman RM, Gilliland FD, Eley JW, et al. Racial and ethnic differences in advanced-stage prostate cancer: the Prostate Cancer Outcomes Study. Journal of the National Cancer Institute. 2001 Mar 7;93:388–95. doi: 10.1093/jnci/93.5.388. [DOI] [PubMed] [Google Scholar]
- 21.Oakley-Girvan I, Feldman D, Eccleshall TR, et al. Risk of early-onset prostate cancer in relation to germ line polymorphisms of the vitamin D receptor. Cancer Epidemiol Biomarkers Prev. 2004 Aug;13:1325–30. [PubMed] [Google Scholar]
- 22.Heath EI, Kattan MW, Powell IJ, et al. The effect of race/ethnicity on the accuracy of the 2001 Partin Tables for predicting pathologic stage of localized prostate cancer. Urology. 2008 Jan;71:151–5. doi: 10.1016/j.urology.2007.08.016. [DOI] [PubMed] [Google Scholar]
- 23.Karakiewicz PI, Hutterer GC. Predictive models and prostate cancer. Nature clinical practice. 2008 Feb;5:82–92. doi: 10.1038/ncpuro0972. [DOI] [PubMed] [Google Scholar]
- 24.Wang L, Hricak H, Kattan MW, et al. Prediction of seminal vesicle invasion in prostate cancer: incremental value of adding endorectal MR imaging to the Kattan nomogram. Radiology. 2007 Jan;242:182–8. doi: 10.1148/radiol.2421051254. [DOI] [PubMed] [Google Scholar]
- 25.De Marzo AM, Knudsen B, Chan-Tack K, Epstein JI. E-cadherin expression as a marker of tumor aggressiveness in routinely processed radical prostatectomy specimens. Urology. 1999 Apr;53:707–13. doi: 10.1016/s0090-4295(98)00577-9. [DOI] [PubMed] [Google Scholar]
- 26.Karam JA, Svatek RS, Karakiewicz PI, et al. Use of preoperative plasma endoglin for prediction of lymph node metastasis in patients with clinically localized prostate cancer. Clin Cancer Res. 2008 Mar 1;14:1418–22. doi: 10.1158/1078-0432.CCR-07-0901. [DOI] [PubMed] [Google Scholar]
Associated Data
This section collects any data citations, data availability statements, or supplementary materials included in this article.


