Abstract
Electronic states of iron ion complexes in human blood from patients with melanoma have been investigated by electron paramagnetic resonance (EPR). The measurements were performed at liquid nitrogen temperature (77 K) on an X-band EPR spectrometer. Numerous types of iron paramagnetic centers have been identified. In several kinds of protein complexes exemplified by methemoglobin, transferrin or ferritin, various forms of trivalent iron have been found. Three groups of patients with typical EPR spectra have been individualized. These groups differed in types and concentration of paramagnetic centers in peripheral blood. A good correlation has been found between the EPR results, the total iron ion complexes concentration and transferrin saturation.
Introduction
Electron paramagnetic resonance (EPR) is one of the most frequently applied methods in structural investigations of paramagnetic particles, e.g., free radicals. The EPR method makes possible the recording of the interaction between electromagnetic radiations and investigated paramagnetic samples placed into the magnetic field [1]. It is characterized by high sensitivity, short time of measurement and simple preparation of the paramagnetic samples. That is why it finds even wider applications in the investigations of biological substances. With the help of EPR, detection of the free radicals and investigations of the electronic states of various ions and their complexes, including the iron ions, become possible.
Iron complexes are the elements widely proliferated in nature, indispensable for almost all living organisms. The important role of iron in the metabolism is related to its ability to oxidize and reduce. Maintaining the regular level of iron ions in the body is extremely important since both its deficiency and overload can lead to serious disorders. In the human body three to five gram of iron can be found. About 70% of this quantity is bound in blood, mainly in the form of hemoglobin (Hb), about 25% is stored in proteins, ferritin and hemosiderin (stored pool), 3% is bound to myoglobin (tissue pool), and about 2% is named serum pool, i.e., iron bound to transferrin or solute iron. Gaining a thorough knowledge of the mechanism of iron metabolism at the cell level has been made possible by the development of modern technology. It enabled one also to investigate the effect of this element on regular functioning of the body.
Both normal and neoplastic cells take up iron by endocytosis with the help of the transferrin receptors. Some cells have the ability of iron uptake by adsorption pinocytosis. However, the effectiveness of such a process is much lower [2]. Such a characteristic reveal, i.e., the melanoma cells. This is a malignant neoplasm of skin arising mostly within the melanocytic nevus. It stems from the pigment cells—melanocytes—producing the melanin. It is characterized by a quick growth and numerous metastases. At the melanoma cells, there occurs the p97 antigen termed also melanotransferrin (MTf). It reveals a significant homology with transferrin and lactoferrin. Initially, MTf has been attributed an additional mechanism of iron uptake by melanoma cells. However, it happens that while it is true that MTf binds iron, it does not transfer this element to the interior of the cell. It has been also ascertained that the MTf expression does not depend on the intracellular iron concentration [3]. The mechanism of the iron concentration level-off during the progress of the neoplastic disease is probably related to the presence of the released proinflammatory cytokines and the production of the acute phase proteins. The monocytes and cytokine macrophages IL-1, IL-6, TNF-α enhance the production of ferritin, which is an iron-storing protein. At the same time, those cytokines induce a reduction in the expression of transferrin receptors. This, in turn, reduces the iron uptake through receptors and enhances the uptake of iron stemming from the cells that turn to phagocytes [4, 5]. The accumulation of iron in the cells of the reticuloendothelial system and in macrophages lowers the accessibility of iron for the erythrocyte system, which can lead to a reduction in the Hb concentration and anemia. Thus, understanding the role and functions of the of iron ion complexes in the development of cancer seems to be very reasonable.
The aim of the current work is to investigate the electron states of iron ion complexes in human blood by EPR spectroscopy and to check if the results obtained in this way can be related to the results of standard biochemical laboratory examinations of different blood elements.
Materials and Methods
Samples of whole blood have been collected from 20 patients with melanoma. All people participated in the project to develop a vaccine against melanoma in the Greater Poland Cancer Centre in Poznań. Blood collected from the patients was subjected to laboratory examinations. The results are given in Table 1. The following data have been determined: Hb concentration (mmol/l), iron concentration (Fe) (μg/dl), transferrin concentration (Tf) (g/l), total iron-binding capacity (TIBC) (μg/dl), unbound iron-binding capacity (UIBC) (μg/dl), ferritin concentration (Ferr) (μg/l) and transferrin saturation (%).
Table 1.
Results of the laboratory examinations of blood of the patients with melanoma
| Patient’s number | EPR spectrum type | Gender W/M | Hb (mmol/l) 7.6–10.0 | Fe (μg/dl) W: 37–145 M: 61–157 |
Tf (g/l) 2.0–3.6 | TIBC (μg/dl) 240–480 | UIBC (μg/dl) 115–350 | Ferr (μg/l) W: 15–150 M: 30–400 |
Transferrin saturation (%) W: <50 M: <60 |
|---|---|---|---|---|---|---|---|---|---|
| 1 | I | W | 7.7 | 54 | 3.1 | 354 | 300 | 16 | 15.3 |
| 2 | III | M | 10.4 | 101 | 2.8 | 324 | 223 | 76 | 31.2 |
| 3 | II | W | 8.0 | 86 | 3.0 | 331 | 245 | 30 | 25.9 |
| 4 | II | W | 8.9 | 86 | 3.0 | 337 | 251 | 65 | 25.5 |
| 5 | III | W | 8.9 | 88 | 3.0 | 336 | 248 | 49 | 26.2 |
| 6 | I | M | 9.8 | 118 | 2.9 | 349 | 231 | 103 | 33.8 |
| 7 | – | M | 8.6 | 86 | 2.7 | 316 | 230 | 248 | 27.2 |
| 8 | – | W | 9.4 | 74 | 2.3 | 270 | 196 | 64 | 27.4 |
| 9 | I | W | 7.6 | 45 | 2.6 | 329 | 284 | 112 | 13.7 |
| 10 | I | M | 9.6 | 106 | 2.8 | 336 | 230 | 175 | 31.6 |
| 11 | II | M | 10.1 | 80 | 2.3 | 290 | 210 | 90 | 27.6 |
| 12 | I | W | 8.9 | 89 | 3.0 | 365 | 276 | 75 | 24.4 |
| 13 | II | W | 7.9 | 59 | 3.0 | 384 | 325 | 81 | 15.4 |
| 14 | I | M | 8.8 | 59a | 3.1 | 398 | 339 | 166 | 14.8 |
| 15 | I | W | 8.6 | 104 | 2.9 | 368 | 264 | 142 | 28.3 |
| 16 | II | W | 8.1 | 79 | 2.4 | 284 | 205 | 137 | 27.8 |
| 17 | – | M | 9.9 | 142 | 2.5 | 330 | 188 | 240 | 43.0 |
| 18 | II | W | 8.3 | 78 | 2.6 | 327 | 249 | 40 | 23.9 |
| 19 | I | W | 8.2 | 83 | 3.2 | 389 | 306 | 35 | 21.3 |
| 20 | I | W | 8.1 | 185a | 2.7 | 324 | 157 | 35 | 54.1a |
| Mean value | 8.8 | 90 | 2.8 | 338 | 248 | 99 | 26.9 | ||
Hb Hemoglobin concentration (mmol/l), Fe iron concentration (μg/dl), Tf transferrin concentration (g/l), TIBC total iron-binding capacity (μg/dl), UIBC unbound iron-binding capacity (μg/dl), Ferr ferritin concentration (μg/l), transferrin saturation (%), W woman, M man
aAbove or below the laboratory norm. For examples of the EPR spectrum types see Figs. 2 and 3
Blood has also been collected from 20 healthy volunteers in order to observe the differences between the spectra of healthy and ill persons.
Immediately after collecting blood, a part of the sample was injected to the plastic phials prepared earlier and frozen in liquid nitrogen (77 K). The samples were stored at 77 K for all time.
The measurements (at a temperature of 77 K) were performed on an X-band Bruker EMX-10 EPR spectrometer operating at 9.4 GHz. The following settings were used: microwave power, 20 mW; modulation frequency, 100 kHz; second modulation amplitude, 1 mT.
Results and Discussion
For all except four examined patients, the blood laboratory data were contained within the laboratory-specified norm. Two of the examined patients (patients Nos. 2 and 11 in Table 1) exhibited a slightly enhanced Hb level, whereas the female patient No. 20 exhibited a largely enhanced level of iron in blood and an enhanced value of the transferrin saturation (Table 1). One patient (No. 14 in Table 1) exhibited a slightly lowered iron level.
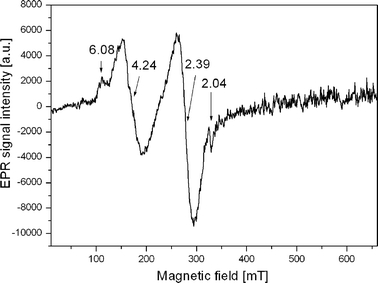
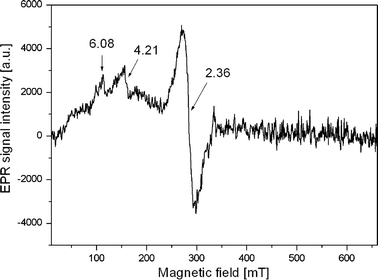
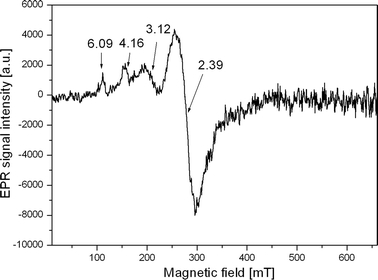
The collected blood samples were subjected to EPR measurements. A typical EPR spectrum of blood of healthy persons is shown in Fig. 1 and the exemplary EPR spectra of blood from patients ill with melanoma are presented in Figs. 2 and 3. On comparing the EPR spectra of healthy persons with those of patients ill with melanoma one can say that in the case of healthy persons there occurs a much more complex EPR spectrum with more lines coming from higher number of various types of Fe3+ complexes than in those with melanoma. The EPR lines for healthy people are also more intensive. For example, the EPR line amplitude at g = 4.16–4.24 is higher for healthy persons (Fig. 1) than for patients with melanoma (Figs. 2, 3). A similar dependence is observed for other lines. In case of healthy persons, the line at g = 2.04, which is not observed in the spectrum of patients with melanoma, was additionally registered. This line is probably derived from copper ions contained in ceruloplasmin, which is the main copper transport protein in blood [6].
Fig. 1.

EPR spectrum typical for a healthy person
Fig. 2.

EPR spectrum typical for patients from group II
Fig. 3.

EPR spectrum typical for patients from group III
The EPR spectra obtained for patients with melanoma differ both in the number of components of the EPR lines composing the spectra and their parameters, e.g., intensity. (Figs. 2, 3; Table 2). In the current work, four different kinds of components of the EPR spectra were individualized with g-factor amounting to: g = 6.08–6.09, g = 4.14–4.22, g = 3.12, g = 2.34–2.39. The interpretation of EPR of biological substances such as blood is not easy. The consequence of the presence of numerous iron–protein complexes is that the position and structure of resonance lines, apart from the content of paramagnetic complexes in blood, are affected also by many factors such as the sample storage conditions, pH [7] or measurement temperature [8].
Table 2.
Values of the spectroscopic parameters calculated for all EPR spectra of patients with melanoma
| Patient’s number | EPR signal amplitude for g = 6.08–6.09 line (a.u.) | EPR signal amplitude for g = 4.14–4.22 line (a.u.) | EPR signal amplitude for g = 3.12 line (a.u.) | EPR signal amplitude for g = 2.36–2.39 line (a.u.) |
|---|---|---|---|---|
| 1 | 0.8 | 1.35 | – | – |
| 2 | 1.4 | 1.5 | 2.15 | 12.3 |
| 3 | 1.4 | 2.0 | – | 4.7 |
| 4 | 1.5 | 1.9 | – | 2.4 |
| 5 | 0.8 | 1.6 | 3.6 | 7.4 |
| 6 | 1.2 | 2.4 | – | – |
| 7 | 0.55 | 0.9 | – | – |
| 8 | 9.2 (g = 5.77) | – | – | – |
| 9 | 0.9 | 1.0 | – | – |
| 10 | 0.9 | 1.95 | – | – |
| 11 | 0.9 | 1.5 | – | 8.5 |
| 12 | 2.0 | 1.9 | – | – |
| 13 | 1.0 | 1.1 | – | 15.1 |
| 14 | 0.7 | 1.4 | – | – |
| 15 | 0.9 | 2.2 | – | – |
| 16 | 0.8 | 2.2 | – | 8.3 |
| 17 | – | 1.9 | – | 4.3 |
| 18 | 0.85 | 1.8 | – | 19.0 |
| 19 | 0.9 | 1.9 | – | – |
| 20 | 0.6 | 3.5 | – | – |
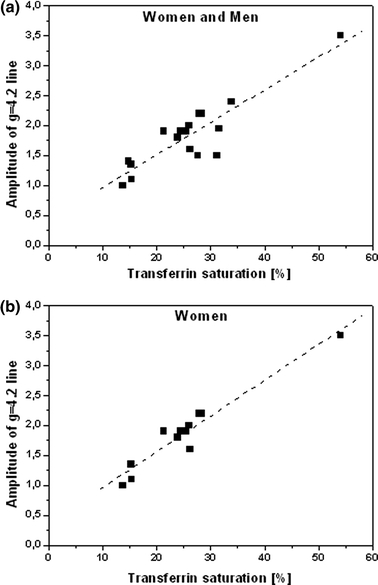
It is commonly admitted that the signal at g = 6.0 is due to the trivalent heme iron in methemoglobin (MetHb) [9–11] in which iron is at the third degree of oxidation instead of the second one. Trivalent iron cannot bind oxygen, the energy of the crystalline field at the Fe3+ ion is small and iron is in the high-spin state S = 5/2. A marginal percent of such Hb can be found in blood of every human. The EPR line recorded at g = 4.14–4.22 represents a typical signal from the non-heme iron Fe3+ ion in a system of low, rhombic symmetry in an octahedral or tetrahedral surrounding. Such systems give rise to low crystalline fields, hence iron is in the high-spin state S = 5/2. In some works [8, 9, 11, 18–20] this signal is a single peak and in others [6, 7, 13, 17] it shows a complex. Most authors have interpreted this signal as originating from Fe3+ in transferrin [7–9, 11–20]. Correlation of the signal amplitude changes with the transferrin saturation appears to confirm this interpretation (Fig. 4).
Fig. 4.

Amplitude of the EPR signal as a function of the transferrin saturation for all investigated patients, R 2 = 0.7985 a and for women, R 2 = 0.9298 b
The interpretation of the resonance lines at g = 3.12 and g = 2.34–2.39 is not univocal. These signals are not derived from the EPR cavity or vial. Control EPR spectra of the empty resonator with empty vials were made repeatedly and any additional lines were recorded. They are related to various heme protein complexes wherein iron is on the third degree of oxidation, the so-called hematin or hemin. Contrary to the case of MetHb, iron in hemin is in the low-spin state. According to the classification proposed by Ann Walker [7, 16], one can distinguish three kinds of signals originating in complexes of this type, depending on the positions of the histidine ligands axially attached to the iron ion. The signals at g = 3.12 and g = 2.34–2.39 are probably from the type-II centers, where the ligands are positioned parallel in the common plane. Such an arrangement causes an increase in field surrounding of the iron ion, which favors the low-spin state (considered as a “pure” low-spin system).
Depending on the type of the recorded EPR spectrum (Figs. 2, 3), patients were divided into several groups.
The first group characterized by the type-I EPR spectrum consisted of nine patients: six women and three men (Table 1). Their corresponding spectra are characterized by the presence of only two signals at g = 6.09 and g = 4.2. This group reveals very diverse blood biochemical parameters. However, at the same time high and much equalized TIBC level of 359 ± 30 (μg/dl) could be observed. The accurate biochemical parameters are given in Table 1.
The second group consisted of patients with type-II EPR spectra (Fig. 2). Six patients, five women and one man, belonged to this group. Their spectra are characterized by three signals at g = 6.08, g = 4.21 and g = 2.36. All the persons with such characteristic EPR spectra had a lowered level of iron in blood, on average 78 (μg/dl), whereas the norm median is 97 (μg/dl) for women and men taken together (Table 1).
In the case of patients No. 2 and No. 5 (Table 1), four lines in the EPR spectra at g = 6.09, g = 4.16, g = 3.12 and g = 2.39 (Fig. 3) have been observed.
The EPR spectrum of patient No. 8 has a completely different character. An intense line at g = 5.77 probably due to magnetic admixtures is seen.
The EPR spectrum recorded for patient No. 17 also differs from the ones discussed above. Apart from the lines at g = 4.14 and g = 2.34, also an EPR line at g = 8.10 has been recorded.
The spectrum for patient No. 7 shows only traces of EPR signals.
The biochemical parameters of the latter few patients do not show any deviations, i.e., do not show significant differences with respect to the remaining patients (Table 1). They can be assigned to no particular group.
Depending on the EPR spectra type ascribed to a particular groups of patients, in peripheral blood either a lack of certain Fe3+ complexes can be observed, such as low-spin iron in ferriheme complexes, or high-spin iron in ferritin micelles.
The analysis of the recorded spectra, contrary to our expectations, did not reveal signals due to the reactive oxygen species (ROS) in patient’s blood. It is possible that the lifetime of the radicals was so short that applying of a spin trap is required in order to register their presence.
Comparing the data collected in Tables 1 and 2 it was noticed that the signal at g = 4.2 is highly correlated with the transferrin saturation level and iron concentration. The correlations have been determined for both the whole pool of patients and for particular groups of patients with the corresponding type of the EPR spectrum ascribed. A classification with respect to gender has also been applied. The majority of the experimental results are well described by a linear function, which is confirmed by the values of the correlation coefficients R 2. In the analysis, the spectra of patients No. 7, 8 and 17 have not been taken into account since they deviated strongly from linearity. Figure 4a, b shows the exemplary relations obtained.
The coefficients R 2 most close to unity are obtained for dependences for patients of group I with the type-I spectra. Both transferrin saturation and iron concentration dependences only very slightly deviate from linearity. For group I, the classification with respect to gender did not significantly affect the changes in the coefficient R 2 when compared with that of the whole group. On the contrary, this classification applied to patients with the type-II spectra, where the value of the coefficient R 2 significantly improved: in the case of transferrin saturation R 2 = 0.6136 for the whole group and it has changed to R 2 = 0.9918 for women. On the other hand, in the case of iron concentration it has changed from R 2 = 0.6275 to R 2 = 0.7570, respectively. The dependence for men has not been determined due to a small number of male patients qualified to this group. However, not all determined dependences are linear. In the case of plots for men in the whole pool of patients, it would be hard to find such relations. In this case, the correlation coefficients for iron concentration amount to R 2 = 0.6607, although for transferrin saturation the corresponding value is R 2 = 0.4330.
The correlation of the signal amplitude at g = 4.2 with the iron concentration in blood and the transferrin saturation (defined as the quotient of the iron concentration in blood and TIBC) indicates to the fact that this resonance line comes just from the iron ions contained in transferrin. The remaining biochemical parameters of blood are not reflected in the spectra obtained. In the case of some patients, EPR signals of large widths of the order of several hundreds gauss and g-factor g ≫ 2.0 have been observed. These signals come probably from the iron Fe3+ ion complexes forming structures of various degrees of magnetic ordering.
Conclusion
The existence of a correlation of the iron ion concentration in blood and transferrin saturation with the amplitude of the EPR line at g = 4.2 has been determined. This line is a typical signal from the non-heme iron Fe3+ ion in a system of low, rhombic symmetry in an octahedral or tetrahedral surrounding.
Only in healthy people the complexes of copper Cu2+ were observed.
EPR signals recorded for healthy people show more different types and higher concentration of paramagnetic species than those in patients with melanoma.
Acknowledgments
This work was partially funded by a grant from the Mayor of Poznan.
Open Access
This article is distributed under the terms of the Creative Commons Attribution Noncommercial License which permits any noncommercial use, distribution, and reproduction in any medium, provided the original author(s) and source are credited.
References
- 1.J.A. Weil, A.L. Bolton, Electron Paramagnetic Resonance. Elementary Theory and Practical Applications, 2nd edn. (Wiley, New York, 2007)
- 2.Richardson DR, Ponka P. Biochim. Biophys. Acta. 1997;1331:1–40. doi: 10.1016/s0304-4157(96)00014-7. [DOI] [PubMed] [Google Scholar]
- 3.Kwok JC, Richardson DR. Crit. Rev. Oncol. Hematol. 2002;42:65–78. doi: 10.1016/S1040-8428(01)00213-X. [DOI] [PubMed] [Google Scholar]
- 4.Feelders RA, Vreugdenhil G, Eggermont AMM, Kuiper-Kramer PA, van Eijk HG, Swaak AJG. Eur. J. Clin. Invest. 1998;28:520–527. doi: 10.1046/j.1365-2362.1998.00323.x. [DOI] [PubMed] [Google Scholar]
- 5.G. Weiss, Eur. J. Clin. Invest. 32, 70–78 (2002) [DOI] [PubMed]
- 6.D.A. Svistunenko, N.A. Davies, M.T. Wilson, R.P. Stidwill, M. Singer, C.E. Cooper, J. Chem. Soc. Perkin Trans. 2, 2539–2543 (1997)
- 7.Moreira LM, Poli AL, Lyon JP, Saade J, Costa-Filho AJ, Imasato H. Comp. Biochem. Phys. Part B. 2008;150:292–300. doi: 10.1016/j.cbpb.2008.03.020. [DOI] [PubMed] [Google Scholar]
- 8.L.F. Gamarra, W.M. Pontuschka, E. Amaro Jr., A.J. Costa-Filho, G.E.S. Brito, E.D. Vieira, S.M. Carneiro, D.M. Escriba, A.M.F. Falleiros, V.L. Salvador, Mater. Sci. Eng. C 28, 519–525 (2008)
- 9.Ślawska-Waniewska A, Mosiniewicz-Szablewska E, Nedelko N, Gałązka-Friedman J, Friedman A. J. Magn. Magn. Mater. 2004;272–276:2417–2419. doi: 10.1016/j.jmmm.2003.12.843. [DOI] [Google Scholar]
- 10.Nagai M, Mawatari K, Nagai Y, Yoneyama Y, Hori H. Biochem. Biophys. Res. Commun. 1995;210(2):483–490. doi: 10.1006/bbrc.1995.1686. [DOI] [PubMed] [Google Scholar]
- 11.Fujita Y, Tsuchiya K, Abe S, Takiguchi Y, Kubo S, Sakurai H. Forensic Sci. Int. 2005;152:39–43. doi: 10.1016/j.forsciint.2005.02.029. [DOI] [PubMed] [Google Scholar]
- 12.Murali A, Rao JL, Navendra GL, Harinathundu T. Opt. Mater. 1997;7:41–46. doi: 10.1016/S0925-3467(96)00063-8. [DOI] [Google Scholar]
- 13.Kolesar JM, Schelman WR, Geiger PG, Holen KD, Traynor AM, Alberti DB, Thomas JP, Chitambar CR, Wilding G, Antholine WE. J. Inorg. Biochem. 2008;102:693–698. doi: 10.1016/j.jinorgbio.2007.10.013. [DOI] [PMC free article] [PubMed] [Google Scholar]
- 14.Farnaud S, Amini M, Rapisarda C, Cammack R, Bui T, Drake A, Evans RW, Rahmanto YS, Richardson DR. Int. J. Biochem. Cell Biol. 2008;40:2739–2745. doi: 10.1016/j.biocel.2008.07.003. [DOI] [PubMed] [Google Scholar]
- 15.Bou-Abdallah F, Chasteen ND. J. Biol. Inorg. Chem. 2008;13:15–24. doi: 10.1007/s00775-007-0304-0. [DOI] [PubMed] [Google Scholar]
- 16.F.A. Walker, Coordin. Chem. Rev. 185–186, 471–534 (1999)
- 17.C.A. Hubel, A.V. Kozlov, V.E. Kagan, R.W. Evans, S.T. Davidge, M.K. McLaughlin, J.M. Roberts, Am. J. Obstet. Gynecol. 175, 692–700 (1996) [DOI] [PubMed]
- 18.R. Aasa, P. Aisen, J. Biol. Chem. 243(9), 2399–2404 (1968) [PubMed]
- 19.Maghraby AM, Ali MA. Radiat. Phys. Chem. 2007;76:1600–1605. doi: 10.1016/j.radphyschem.2007.01.008. [DOI] [Google Scholar]
- 20.Sakurai H, Tsuchiya K. Naturwissenschaften. 1989;76:24–25. doi: 10.1007/BF00368306. [DOI] [PubMed] [Google Scholar]


