

Abstract
Abstract behavior-guiding rules and strategies allow monkeys to avoid errors in rarely encountered situations. In the present study, we contrasted strategy-related neuronal activity in the dorsolateral prefrontal cortex (PFdl) and the orbital prefrontal cortex (PFo) of rhesus monkeys. On each trial of their behavioral task, the monkeys responded to a foveal visual cue by making a saccade to one of two spatial targets. One response required a leftward saccade, the other required a saccade of equal magnitude to the right. The cues instructed the monkeys to follow one of two response strategies: to stay with their most recent successful response or to shift to the alternative response. Neurons in both areas encoded the stay and shift strategies after the cue appeared, but there were three major differences between the PFo and the PFdl: (1) many strategy-encoding cells in PFdl also encoded the response (left or right), but few, if any, PFo cells did so; (2) strategy selectivity appeared earlier in PFo than in PFdl; and (3) on error trials, PFo neurons encoded the correct strategy—the one that had been cued but not implemented—whereas in PFdl the strategy signals were weak or absent on error trials. These findings indicate that PFo and PFdl both contribute to behaviors guided by abstract response strategies, but do so differently, with PFo encoding a strategy and PFdl encoding a response based on a strategy.
Introduction
The ability to use abstract rules and strategies to guide behavior allows monkeys to make beneficial choices before learning concrete stimulus-response associations (Wise and Murray, 1999) and, more generally, to reduce errors in rare contexts (Genovesio and Wise, 2008). Rules differ from strategies in subtle ways, but they share many properties. They both provide an important adaptive advantage over the phylogenetically older, general-purpose learning mechanism that depends on slow, cumulative, trial-and-error learning by reinforcement. Abstract rules and strategies, for example, can guide responses to novel stimuli, even when stimulus generalization provides no help in making beneficial choices. The prefrontal cortex (PF), as a whole, contributes to behavior-guiding rules and strategies (Genovesio and Wise, 2008), but many questions remain about functional specializations within PF.
The dorsolateral prefrontal cortex (PFdl, area 46) has long been thought to play a role in behaviors guided by abstract rules and strategies (Owen et al., 1996; Monchi et al., 2001; Brass et al., 2003; Bunge et al., 2003, 2005; Mansouri et al., 2009). In support of this idea, neurophysiological studies of PFdl have found rule- and strategy-related activity (White and Wise, 1999; Asaad et al., 2000; Hoshi et al., 2000; Wallis et al., 2001; Wallis and Miller, 2003a; Genovesio et al., 2005; Mansouri et al., 2006; Yamada et al., 2010), and damage to this area causes deficits in rule-based behaviors in both humans (Milner, 1963; Stuss et al., 2000; Barceló and Knight, 2002) and monkeys (Collins et al., 1998; Buckley et al., 2009).
The orbital prefrontal cortex (PFo, areas 11 and 13) has not received as much attention in studies of abstract rules and strategies. It has usually been viewed as a neural substrate for processing reward and affective information (Schultz, 2006; Wallis, 2007; Watanabe and Sakagami, 2007), including updated valuations of neural representations (Baxter and Murray, 2002) and the assignment of causal relations between object choices and outcomes (Walton et al., 2010). In accord with this idea, studies of neuronal activity in PFo have focused on expected or received reward outcomes (Thorpe et al., 1983; Tremblay and Schultz, 1999; Hikosaka and Watanabe, 2000; Wallis and Miller, 2003b; Padoa-Schioppa and Assad, 2006, 2008; Simmons and Richmond, 2008; Kennerley and Wallis, 2009a,b; Kennerley et al., 2009; Bouret and Richmond, 2010; Kobayashi et al., 2010), with less consideration of advanced cognition. However, PFo also contains neurons that show rule-dependent activity (Wallis et al., 2001; Wallis and Miller, 2003a; Yamada et al., 2010), and lesions to PFo impair rule-based behavior in a way that points to a critical role in updating rule valuations (Buckley et al., 2009).
In a recent study, we contrasted activity in PFdl and PFo at feedback time and found that PFo neurons encoded the response chosen by monkeys, regardless of its outcome. PFdl neurons, in contrast, encoded a combination of response and outcome (Tsujimoto et al., 2009). The present report extends the analysis of these data to the cue period.
Materials and Methods
Subjects and behavioral task.
We studied two male rhesus monkeys (Macaca mulatta), weighing 10 and 11 kg. All procedures conformed to the Guide for the Care and Use of Laboratory Animals and were approved by the Institutional Animal Care and Use Committee.
Before recordings began, the monkeys were operantly conditioned to perform a saccade task (Fig. 1A), which has been described previously (Tsujimoto et al., 2009, 2010). Each monkey was restrained comfortably in a primate chair, with its head stabilized and oriented toward a video monitor 32 cm away.
Figure 1.

Behavioral task and recording locations. A, Sequence of task events for correct trials, from top to bottom. Each dark gray rectangle represents the video monitor viewed by the monkey. The red arrows indicate the target of gaze. B, Cues and the response strategies each instructed. C, Coronal section based on MRI. Angle of penetration (black lines) allowed sampling of neuronal activity in both PFdl (green) and PFo (brown). Fix, Fixation period; LOS, lateral orbital sulcus; MOS, medial orbital sulcus; PS, principal sulcus.
Each trial began after a 1 s intertrial interval. A white fixation spot (0.6° filled circle) appeared at the center of the video monitor, along with two saccade targets (2.0° unfilled white squares, 11.6° left and right from center). To continue the trial, the monkey needed to fixate on the central circle. Initial fixation was constrained within a ±3° square window centered on the fixation point, but in practice, both monkeys maintained fixation more accurately than required.
After the monkey maintained fixation for 1.5 s, a visual cue appeared at the fixation point for 0.5 s. For each trial, one cue was selected pseudorandomly from a set of four stimuli (Fig. 1B) comprising vertical and horizontal bars (light gray, 1.0° × 4.9°) and squares (yellow and purple, 2.0° × 2.0°). The vertical bar and yellow square instructed the monkeys to select the same response on the current trial as they had on the previous trial (stay cues); the horizontal bar and purple square cued a shift from the previous response to the alternative (shift cues). The stay and shift trials were intermixed pseudorandomly and both occurred on approximately half of the trials.
The monkey continued to fixate the cue for the entire period of its presentation, as well as during the delay period that followed. The delay period lasted 1.0, 1.25, or 1.5 s (selected pseudorandomly), during which the fixation spot and the two saccade targets remained on the screen. The fixation spot then disappeared as the go or trigger signal for a saccade. Up to this point in the trial, fixation breaks caused the trial to be aborted, but this requirement ended with the go cue. Once the monkey made a saccade to one of the two squares (±3.75°), both targets became solid white on every trial, whether correctly or incorrectly performed. After 0.5 s of target fixation, feedback was delivered. A drop of fluid (0.2 ml) served as reward feedback after correct responses; the presentation of red squares over both targets served as negative feedback after errors.
After errors, the cue from that trial was repeated on correction trials, which were presented until the monkey obtained a reward by responding correctly, defined on the basis of the most recently rewarded response. In practice, the monkeys rarely required more than one correction trial after an error.
Data collection.
Before data collection, an access port (18 mm inner diameter) was implanted over the exposed dura mater of the frontal lobe. The position and angle of the port was adjusted based on magnetic resonance images (MRI) so that both PFdl and PFo were accessible simultaneously (Fig. 1C). Single-neuron activity was recorded from PF using up to 16 platinum-iridium electrodes (0.5–1.5 MΩ at 1 kHz; Thomas Recording) inserted into the cortex with a multielectrode drive (Thomas Recording), which enabled independent control of each electrode. In typical recording sessions, approximately half of the electrodes were advanced into PFo and the others were maintained more superficially in PFdl. Signals from each electrode were recorded using a multichannel acquisition processor (Plexon). Single-neuron potentials were isolated offline using a cluster cutting technique (Off Line Sorter; Plexon). Spike sorting was based on the multiple criteria, including principal component analysis, the minimal interspike intervals, and close visual inspection of the entire waveforms for every isolated cell. An infrared oculometer (Arrington Research) recorded eye position.
Histology.
The recording sites were reconstructed by standard histological analysis, supplemented by structural MRI. Near the end of data collection, electrolytic lesions (20 μA for 20 s, anodal current) were placed in selected locations at two depths per penetration. After 10 d, the animal was deeply anesthetized and then perfused through the heart with 10% (v/v) formol saline. The penetration sites and tracks were reconstructed in Nissl-strained sections by reference to recovered electrolytic lesions and the marking pins inserted at the time of the perfusion.
Data analysis.
Correction trials were excluded from all analyses reported here, as were error trials except where noted. All the analyses were done using SPSS software (SPSS) and MatLab with Statistics Toolbox (MathWorks).
To identify task-related neurons and to maintain consistency with the previous papers in this series (Tsujimoto et al., 2009, 2010), we used the Kruskal–Wallis test (α = 0.05) to compare mean firing rates among four defined task periods: a fixation period (0.5–1.0 s after fixation onset), a cue period (0–0.5 s after cue onset), a delay period (0–1.0 s after cue offset), and a feedback period (from 0.3 s before feedback onset until 0.2 s afterward). If activity during any task period significantly differed from that during another task period, a neuron was classified as task-related.
Then, to examine strategy-dependent activity, we applied a two-factor ANOVA (α = 0.05) to cue-period activity for all task-related neurons. The factors used were response (left and right) and strategy (stay and shift).
For average population activity, we measured the mean firing rate of each neuron in 20 ms bins aligned on cue onset. The average was computed separately for each neuron's preferred (P) and anti-preferred (A) strategy. To confirm these results, we also calculated the normalized population averages, based on the z-score of each bin's firing rate relative to the mean activity from 1.0 s before cue onset to 0.5 s after reward onset. As a measure of strategy selectivity, the average firing rate for the anti-preferred strategy was subtracted from that for the preferred strategy (P − A). Cross-correlation analysis was applied to these different plots, with a 20 ms bin step. The analogous procedure was conducted for responses (left vs right).
As another measure of strategy selectivity, we computed the area under the receiver operating characteristic (ROC) curve for the cue period. These ROC values reflect the capacity of an ideal observer to detect some signal based on single-trial activity, and they have the advantage that the value is not affected by a cell's mean discharge rate or by its dynamic range. Ideally, an ROC value of 0.5 would indicate no strategy selectivity and a value of 1.0 would reflect complete selectivity. Because of our procedure, which involved identifying preferred and anti-preferred strategies, a positive bias was introduced. Accordingly, a bootstrap analysis was performed to test whether the observed ROC values exceeded those expected by chance (Wallis and Miller, 2003b). For each neuron, we shuffled the strategy designation (stay vs shift) for each trial and recalculated the ROC values. This process was repeated 1000 times for each neuron, and the shuffled ROC values were compared with observed values (Mann–Whitney U test, α = 0.05). An analogous procedure was conducted for the responses.
The time course of strategy selectivity was estimated with a sliding ROC analysis (Rainer and Miller, 2000; Muhammad et al., 2006). We computed the area under ROC curve in a 200 ms centered window that stepped across the trial in increments of 20 ms (smaller time windows yielded unstable results). The onset latency of the strategy selectivity was defined as the point at which the sliding ROC curve exceeded 2 SDs above the shuffled ROC value for three consecutive 20 ms steps. The result was confirmed with a previously published method that used an ROC threshold of 0.6 for three consecutive steps (Wallis and Miller, 2003a). Peak time was defined as the bin that showed maximum ROC value during the cue period.
We also compared strategy selectivity in correct and error trials. To do so, we used a bootstrap procedure that was introduced in a previous paper (Tsujimoto et al., 2010). As noted above, one measure of strategy coding was the P − A activity difference observed in population averages. First, we computed the observed P − A activity difference for correct trials. Second, the strategy labels were applied to error trials based on the response that had been made. If, for example, a cell preferred the stay strategy on correct trials, then error trials with stay responses were designated “preferred,” regardless of the cell's activity on those trials. The observed strategy signal for error trials was calculated as P − A on this basis. Third, the strategy designation (stay or shift) was shuffled randomly across all (correct and error) trials. The preferred and anti-preferred strategies were then reassessed for both correct and error trials, using the same labeling convention as for the observed data. Then, P − A activity differences were computed separately for correct and error trials. This shuffling procedure was repeated 1000 times, which yielded a distribution of 1000 sets of P − A activity differences, to which the observed set of P − A activity differences could be compared.
Results
Behavior
Details of the behavioral results, including oculomotor behavior, were described previously (Tsujimoto et al., 2009). Briefly, both monkeys performed the task proficiently, averaging 93% correct responses (Table 1) with reaction times of ∼310 ms (Table 2). The reaction times did not differ significantly between stay and shift trials (t test, p > 0.05). Both monkeys maintained stable and accurate fixation throughout the fixation and cue periods.
Table 1.
Percentage of correct responses, correction trials omitted
| Cue | Monkey 1 |
Monkey 2 |
||
|---|---|---|---|---|
| Right | Left | Right | Left | |
| Stay | 92% | 92% | 93% | 93% |
| Shift | 94% | 94% | 94% | 93% |
Table 2.
Reaction times (ms, mean ± SD)
| Cue | Monkey 1 |
Monkey 2 |
||
|---|---|---|---|---|
| Right | Left | Right | Left | |
| Stay | 291 ± 65 | 331 ± 62 | 301 ± 30 | 326 ± 36 |
| Shift | 296 ± 68 | 322 ± 68 | 294 ± 30 | 325 ± 36 |
Neuronal database and strategy-selective activity
The neuronal database consisted of activity records from 873 isolated neurons, 524 from PFdl and 349 from PFo. Of these neurons, 671 (77%) were task-related (Kruskal–Wallis test, p < 0.05), 393 (75%) in PFdl and 278 (80%) in PFo. Table 3 gives the breakdown by monkey and area. The task-related cells, which had a mean of 83 ± 29 (SD) trials per neuron, were then tested for strategy selectivity by two-way ANOVA.
Table 3.
Numbers of cells showing main effects of strategy or response, numbers of task-related neurons, and numbers of isolated neurons
| Area | Strategy selective |
Response selective |
Task related |
Isolated |
||||
|---|---|---|---|---|---|---|---|---|
| Monkey 1 | Monkey 2 | Monkey 1 | Monkey 2 | Monkey 1 | Monkey 2 | Monkey 1 | Monkey 2 | |
| PFdl | 23 | 25 | 33 | 22 | 207 | 186 | 270 | 254 |
| PFo | 40 | 9 | 13 | 3 | 200 | 78 | 253 | 96 |
Figure 2A illustrates the activity of a PFdl neuron with significant strategy selectivity. Its cue-period activity was significantly higher when the cue instructed a shift from the previous response (14.0 ± 5.1 spikes/s, mean ± SD) than when it instructed staying with the previous response (7.5 ± 3.9 spikes/s; F(1,103) = 55.1, p < 0.001). The PFo neuron shown in Figure 2B also exhibited strategy selectivity during the cue period, with significantly higher activity on stay trials (9.3 ± 3.5 spikes/s) than on shift trials (6.1 ± 3.8 spikes/s; F(1,89) = 15.5, p < 0.001). Figure 2C shows another PFo neuron, one with a preference for shift trials (6.6 ± 4.8 spikes/s for shift; 4.1 ± 3.9 spikes/s for stay, F(1,89) = 7.3, p = 0.008).
Figure 2.

Three examples of strategy-selective neurons. A–C, Neuron activity aligned on cue onset. Raster displays show spike times sorted chronologically from top to bottom with spike-density averages below each display. Stay (thick lines) and shift (thin lines) responses shown separately. Correct trials only. Background shading represents the cue period. A, PFdl neuron from monkey 2. B, PFo neuron from monkey 1. C, PFo neuron from monkey 2. sp/s, Spikes per second.
According to the two-way ANOVA, 48 of 393 (12%) task-related PFdl neurons showed a main effect of strategy during the cue period. In PFo, 49 of 278 (18%) task-related neurons did so. These frequencies did not differ significantly (χ2 = 3.43, p = 0.064), and Table 3 gives the breakdown by area and monkey. For the vast majority of strategy-selective neurons (94% in PFdl and 84% in PFo), no difference was observed between the two cues that instructed each preferred strategy (t test, α = 0.05). Among the strategy-selective cells, 32 of 48 PFdl neurons and 28 of 49 PFo neurons showed higher cue-period activity in stay trials, with the remaining cells preferring shift trials. The proportions of stay- and shift-preferring cells did not differ significantly from the chance level of 0.5 in PFo (binominal test, p = 0.10), but did differ in PFdl (p = 0.007). Because some neurons may encode strategies by decreasing firing rate from baseline, we also examined the number of cells that showed significant decreases in activity (vs the average over the entire trial) for only one of the two strategies and no significant modulation for the other (t test, α = 0.05). In PFdl, 8 of 48 strategy-encoding cells satisfied this criteria; in PFo, 3 of 49 did so.
Although the cue-period activity of neurons shown in Figure 2 did not differ significantly between the responses (left vs right), a subpopulation of strategy-related neurons in PFdl showed effects of both strategy and response. Figure 3 illustrates two examples. The PFdl neuron in Figure 3A increased its activity only when the cue instructed the monkey to stay with the left response and did not show a significant change in activity when the correct response was to the right for either stay or shift trials. This neuron showed significant main effects of both the strategy (F(1,81) = 4.9, p = 0.03) and response (F(1,81) = 14.4, p < 0.001), as well as their interaction (F(1,81) = 12.5, p = 0.001). Another PFdl neuron, shown in Figure 3B, also showed significant strategy (F(1,66) = 8.3, p = 0.005), response (F(1,66) = 52.3, p ≪ 0.001), and interaction (F(1,66) = 10.3, p = 0.002) effects, with a preference for stay-right trials.
Figure 3.

Two PFdl neurons with cue-period activity encoding both strategy and response. A, Neuron from monkey 1 encoding a combination of the stay strategy and leftward responses (for details on the format, see Fig. 2). Black arrows show the direction of response. B, Neuron from monkey 2 encoding the stay strategy effect and rightward responses.
Among 48 PFdl neurons with strategy selectivity, 33% (n = 16) also had a significant main effect of the response. In PFo, only 4 of 49 (8%) of the strategy-selective neurons did so, just 1.6 cells more than expected by chance. These proportions were significantly different (χ2 = 7.91, p = 0.005). The strategy-response conjunctions discussed so far involved neurons selected for showing strategy-selective activity. We also tested the entire population of task-related PFdl and PFo cells for strategy and response coding and obtained similar results. Figure 4A shows that task-related cells in PFdl showed both strategy and response effects, but those in PFo showed mainly strategy effects, compared with chance levels (dashed line). Figure 4, B and C, shows the complete results of ANOVA for task-related cells. Among such cells, significant response effects were observed more frequently in PFdl (n = 55, 14%) than in PFo (n = 16, 5.8%) (χ2 = 10.83, p = 0.001). The proportion of cells with significant response effects in PFo was only 2.1 cells more than the number expected by chance.
Figure 4.

A, Results of two-way ANOVA, main and interactive effects. Dashed line represents percentage expected by chance. B, C, Venn diagrams of results from ANOVA for PFdl (B) and PFo (C), showing main effects, interactive effects, and their combinations. D, Strategy selectivity as measured by ROC analysis. Area under ROC curve was computed for all task-related (t-r) cells and cells with significant strategy effects. The value of the shuffled ROC gives value expected by chance (dashed line). E, Response selectivity as measured by area under ROC curve computed for the all task-related cells. Error bars indicate SEM. *p < 0.001.
Population analysis
The cells that showed a significant strategy effect by ANOVA had a mean ROC value (Fig. 4D, light gray) of 0.72 ± 0.12 (SD) and 0.68 ± 0.12 for PFdl and PFo, respectively. The ROC analysis was also performed for the entire population of task-related neurons (Fig. 4D, dark gray). This population, which includes the 12–18% of task-related cells with strategy effects, as well as the task-related cells lacking such effects, nevertheless showed significantly higher ROC values compared with shuffled data in both PFdl and PFo (Mann–Whitney U test, p ≪ 0.001). These findings indicate robust encoding of the strategy by task-related cells in both areas.
The ROC analysis was also applied to response coding during the cue period. In accord with the results from ANOVA, the overall task-related population in PFdl significantly encoded the upcoming response during the cue period, but not in PFo. As illustrated in Figure 4E, response coding in PFdl yielded an ROC value of 0.62 ± 0.08 versus 0.55 ± 0.01 for shuffled data, which was a significant difference (p < 0.001, Mann–Whitney U test). In PFo, the ROC value was 0.56 ± 0.05 versus 0.56 ± 0.01 for shuffled data (p = 0.45, not significant). This finding indicates that despite a small number of cells in PFo showing significant effects of response by ANOVA (Fig. 4C) the task-related population did not encode a sufficiently strong response signal for external detection.
To characterize the strategy-selective activity in greater detail, we examined the average population activity for neurons with strategy-selectivity during the cue period (n = 48 and 49 for PFdl and PFo, respectively). Figure 5A shows that both PFdl and PFo neurons began to discriminate their preferred and anti-preferred strategy shortly after the onset of the strategy-instructing cue. Normalized population averages confirmed these findings for both PFdl and PFo (Fig. 5B). Figure 5C plots the difference between the preferred and the anti-preferred strategy. Although both PFdl and PFo showed a similar strategy signal during the cue period, there were two differences noted. The strategy signal seemed to increase more rapidly in PFo than in PFdl, and in PFdl, the discharge rate was modulated only for the preferred strategy. The time course of the strategy signal in PFdl significantly differed from that of PFo (Kolmogorov–Smirnov test, D = 0.38, p < 0.001). Accordingly, we examined this point in more detail.
Figure 5.
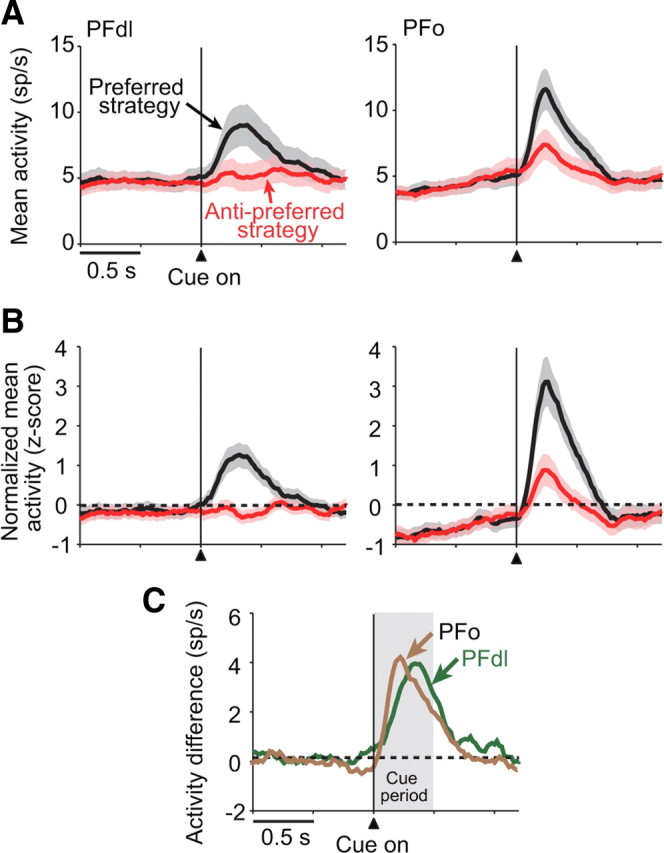
Strategy-selective population means. A, Mean population activity (shaded area, SEM) for PFdl (left) and PFo (right) neurons with significant strategy-selective activity during the cue period (n = 48 and 49, respectively), computed separately for each neuron's preferred (black) and anti-preferred (red) strategy. Vertical line shows the time of cue onset. B, Normalized (z-score) population averages for the same data as shown in A. C, Difference in activity between the preferred and anti-preferred strategies.
First, we examined when the SEM envelopes for preferred and anti-preferred strategies separated for the first time after cue onset. Based on the data plotted in Figure 5A, this separation occurred 139 ms after cue onset in PFo and 180 ms after cue onset in PFdl, a difference of approximately two 20 ms bins. A cross-correlation analysis of the difference plot (Fig. 5C) also shows a forward shift of two bins (30–50 ms) for the PFo population relative to the PFdl population.
Second, we calculated sliding ROC values. Figure 6A shows a moving average of the area under the ROC curve for each cell, and Figure 6B gives the population average of these values. These plots confirm the robust encoding of strategy signals in both PFdl and PFo and, like the population averages in Figure 5, suggest that the selectivity appeared sooner in PFo than in PFdl. Their SEM envelopes separated 180–200 ms after cue onset and, at that point, the PFo curve is shifted forward by three bins (∼60 ms) relative to PFdl.
Figure 6.

A, Sliding ROC plots for PFdl (top) and PFo (bottom) neurons with strategy-selective activity during the cue period (as in Fig. 5A), with the area under the ROC curve color-coded for each cell, ranked according to the onset of strategy selectivity. B, Means with SEM (shading) for the data in A. C, Cumulative fraction of neurons meeting criteria for the onset of strategy selectivity from cue onset. D, Cumulative fraction of neurons reaching peak strategy encoding by ROC analysis.
To further test this apparent difference in time course statistically, we computed the onset latency and peak time of the strategy selectivity, using the sliding ROC analysis depicted in Figure 6A. To estimate the onset time of strategy selectivity, we searched each neuronal record for the first time that the ROC value exceeded 2 SD of the shuffled value for three consecutive bins. Figure 6C shows the cumulative fraction of neurons that met that criterion as a function of time after cue onset. PFo neurons tended to satisfy the criteria sooner than those in PFdl (Kolmogorov–Smirnov test, D = 0.52, p = 0.0036). The median latency was also significantly different between PFdl and PFo (280 ms vs 200 ms for PFdl vs PFo, respectively; Wilcoxon rank-sum test, p = 0.04). To confirm this effect with another criterion, we used the definition of onset latency from a previous study (Wallis and Miller, 2003a), which was the point at which the sliding ROC curve exceeded 0.6 for three consecutive bins. This test yielded similar results, with median latencies of 300 versus 230 ms for PFdl vs PFo, respectively (Wilcoxon rank-sum test, p = 0.015). Peak strategy-encoding time showed the same tendency (Fig. 6D) (Kolmogorov–Smirnov test, D = 0.43, p = 0.029), with medians of 340 versus 280 ms for PFdl versus PFo, respectively.
We recognize that testing the overall distribution of onset times is problematic because the addition of cells with lagging onset times to an otherwise leading population can shift means and medians in a potentially misleading way. Inspection of the distributions, however, indicated that no such distortion occurred in the present dataset, which dealt only with the 500 ms period of cue presentation.
Because neurons in PFdl encoded the response (left or right) as well as the strategy (shift or stay) during the cue period, we compared the time course of these two signals. Figure 7 shows the results. Both ROC analysis (Fig. 7A) and the population activity averages (Fig. 7B) show that the response signal developed along with the strategy signal in PFdl. Unlike the strategy signal in either PFdl or PFo, the response signal persisted throughout the cue period, in accord with the requirement to prospectively encode the future action for implementation once the go cue appeared.
Figure 7.

A, Sliding ROC plots for the response (left or right) chosen on each trial (red). This curve presents a measure of response coding in PFdl compared with the sliding ROC plots for strategy coding in PFdl (green) and PFo (brown) (see Fig. 6B). B, Response encoding in PFdl, measured by population activity means. Response coding is measured as the difference in activity between preferred and anti-preferred responses (red), plotted with the analogous difference means for strategy coding in PFdl (green) and PFo (brown) (see Fig. 5C).
Error trials
To examine strategy selectivity in error trials, we performed the bootstrap procedure explained in Materials and Methods, above. To summarize this test, we examined whether the observed population activity difference between preferred and anti-preferred strategies exceeded the range of shuffled data for both correct and error trials. We needed to analyze error-trial activity at the population level because the low proportion of errors precluded a cell-by-cell analysis.
As shown on the abscissa of Figure 8, A and B, the observed strategy signal (red square) for correct trials vastly exceeded all 1000 sets of shuffled data in both PFdl and PFo (p < 0.001). The ordinate of each plot shows that, on error trials, the observed value significantly differed from the shuffled data for the PFo population (p = 0.002) (Fig. 8B), but fell within the range of the shuffled data for the PFdl population and did not differ significantly (p = 0.2) (Fig. 8A). This result indicates that the strategy signal was weak or absent on error trials in PFdl.
Figure 8.

A, Activity difference between preferred (pref) and anti-preferred (anti) strategies for the observed (red square) and shuffled data (blue points), for PFdl. The data for correct and error trials are shown on the abscissa and ordinate, respectively, with the distribution shown (top and right). For the calculation of error data, we used 42 neurons that showed a significant main effect of strategy by ANOVA and had at least one error trial. B, PFo results for 45 neurons, data shown as in A. C, Average population activity in the error trials (dashed lines) and correct trials (solid lines) for PFdl neurons with significant strategy-selective activity. Preferred and anti-preferred strategies correspond to each neuron's strategy preference for the correct trials. D, Strategy selectivity for PFo neurons, data shown as in C. n.s., Not significant.
Figure 8B shows that the strategy encoded by PFo neurons on error trials was the one that had been cued but not implemented. Take, for example, a neuron that preferred stay trials when the monkey performed correctly. On correct trials, the monkey made a response corresponding to the cue, and therefore such a neuron would prefer trials with both stay cues and stay responses. So, by definition, P − A > 0 for both cues and responses. On error trials, we found that such cells had greater activity for trials with stay cues than for trials with shift cues. But after a stay cue, the monkey made a shift response. Applying our labeling convention to such a cell, error trials with shift responses were labeled “anti-preferred” and, therefore, P − A < 0 for error trials (Fig. 8B). A negative value on error trials indicates a preference for the strategy cued.
The bootstrap-based findings on error trials were confirmed in the population averages (Fig. 8C,D). In PFdl, the activity was not clearly modulated during the cue period on error trials (dashed lines) and the cells' preferred and anti-preferred averages did not differ significantly (paired t test, t27 = 1.4, p = 0.16) (Fig. 8C). In contrast, on correct trials, the difference between preferred and anti-preferred activity averages was highly significant (t47 = 7.0, p < 0.001). PFo neurons, in contrast, showed similar activity during error trials and correct trials, even though the cued strategy was not implemented correctly (Fig. 8D). On error trials, the mean activity significantly differed between the cells' preferred and anti-preferred strategies (t39 = 2.5, p = 0.016), as it did on correct trials (t48 = 10.9, p < 0.001). There was no difference in activity related to the preferred strategy on correct versus error trials (t87 = 1.0, p = 0.30, not significant).
Recording sites
We plotted the recorded sites and the positions of strategy-selective neurons based on reconstructed surface penetrations (Fig. 9), MRI reconstructions of electrode tracks, and the location of electrolytic marking lesions. The PFdl recordings came from both dorsal and ventral banks of the principal sulcus in both monkeys (Fig. 9A), with a few neurons in the adjacent cortex. There was no clear clustering of strategy-selective neurons in PFdl. PFo recording sites differed slightly between monkeys (Fig. 9B). In monkey 1, they came mainly from area 11; in monkey 2, recording sites were more medial and caudal and came mainly from area 13 (Carmichael and Price, 1994). Histological analysis showed that the recording sites were in homotypical cortex and did not extend caudally into the agranular part of area 13. As in PFdl, there was no unequivocal clustering of strategy-selective neurons, although they tended to be recorded from the more rostrolateral part of area 11 (Fig. 9B).
Figure 9.

Penetration sites. A, Penetration sites for PFdl recordings. Lateral view, composite of two monkeys. Each shape represents the site of an electrode array, which included four or more electrodes (green, monkey 1; red, monkey 2). Circles, squares, and triangles represent sites with one or more neurons showing strategy-selective cells, response-selective cells, or both, respectively. Xs mark penetration sites where none of the recorded neurons showed significant effects for either response or strategy. B, Penetration sites for PFo recording, data shown as in A. AS, Arcuate sulcus; PS, principal sulcus; MOS, medial orbital sulcus; LOS, lateral orbital sulcus.
Discussion
The present study examined cue-period encoding of abstract response strategies in PFdl and PFo. Using a different version of the task, we previously reported strategy-selective neurons in PFdl and in the dorsal PF cortex (areas 8 and 9) during the cue period (Genovesio et al., 2005, 2008). The current results confirmed this finding for PFdl and showed that PFo contains neurons with similar properties. Likewise, Wallis et al. (2001) found neurons encoding abstract rules in both PFdl and PFo. In addition, here we found significant differences in strategy signals between PFdl and PFo. In what follows, we first discuss PFo, then compare it with PFdl.
Orbital prefrontal cortex
The experimental design allowed us to rule out simple motor or sensory correlates of neuronal activity. The strategy effects examined here were independent of information about response targets or movements because the same strategy led to both rightward and leftward saccades on different trials. The strategy signal observed here was also not a simple reflection of physical properties of visual cues. Our task used two different visual submodalities (orientation and color) to instruct strategies, and there was rarely any difference in strategy coding for these two kinds of cues. All stimuli and both responses had the same value and the same outcome associations over the long term. In addition, in a control task to be described in a future report (our unpublished data), drops of fluid served as strategy cues instead of visual inputs, and the results were similar. Furthermore, some strategy-selective cells in PFdl showed a strategy effect only in right-response or left-response trials, even though the cues were the same for both. Thus, the neurons described here did not encode cues, movements, or targets. We made no attempt, however, to distinguish rules from strategies (Genovesio and Wise, 2008).
A possible role for PFo in response strategies was first suggested by lesion studies. PFo was included in a lesion that abolished the implementation of abstract strategies (Bussey et al., 2001). That lesion, however, also included the ventral PF cortex (mainly area 12), which could have caused the deficit. In line with this possibility, deficits on a different strategy task have been attributed to the ventral PF cortex, with PFo lesions causing no effect (Baxter et al., 2009). Likewise, it has long been known that ventral PF cortex is important for learning matching and nonmatching rules (Kowalska et al., 1991; Rushworth et al., 1997; Bussey et al., 2001; Buckley et al., 2009). The present results show that PFo plays a role in abstract rules and strategies, although not all kinds of strategies (Baxter et al., 2009). Together, PFo, the ventral PF cortex (Wang et al., 2000; Baxter et al., 2009), PFdl, and the dorsal PF cortex (Genovesio et al., 2005) all appear to contribute to a range of strategy- and rule-guided behaviors.
Contrasting orbital and dorsolateral prefrontal cortex
A prevalent idea about the functional specializations of PFdl and PFo is that PFo processes information about reward and affect, including the valuation of stimuli (Padoa-Schioppa, 2007; Wallis, 2007; Kennerley and Wallis, 2009a; Kennerley et al., 2009), with PFdl being more closely related to the selection of goals and actions (Passingham, 1993; Genovesio et al., 2006; Tanji and Hoshi, 2008; Tsujimoto et al., 2008). Our results do not contradict this idea, but suggest that the role of PFo is broader than that synthesis suggests. PFo appears to have a role in strategy-based behavior that extends beyond the valuation of stimuli. According to a recent lesion study, PFo plays a role in updating the valuation of rules as well as stimuli (Buckley et al., 2009). Our findings also indicate that PFo functions extend beyond the representation of stimulus value and stimulus–outcome associations to encompass abstract rules and strategies.
The general similarity of strategy coding in PFo and PFdl is consistent with anatomical findings of reciprocal connections between them (Barbas and Pandya, 1989; Carmichael and Price, 1996; Cavada et al., 2000). Despite these similarities, PFo and PFdl differed in three respects. First, the proportion of strategy-encoding neurons that also encoded response choices (or goals) was significantly higher in PFdl than in PFo. These conjunctions could have reflected either previous or future choices, and they agree with findings indicating that response choices are rarely encoded in PFo, at least before feedback (for discussion, see Tsujimoto et al., 2009). Second, strategy selectivity appeared sooner in PFo than in PFdl, as does reward information (Wallis and Miller, 2003b). Third, on error trials, PFo neurons encoded the strategy that had been cued (but not implemented), whereas in PFdl, the strategy signal was weak or absent. These results provide neurophysiological evidence that PFdl and PFo contribute differently to abstract response strategies.
The differences between PFdl and PFo, like their similarities, are likely to depend on their anatomical connections (Passingham et al., 2002). In particular, PFdl sends projections to a variety of premotor areas, which in turn project to the primary motor cortex (Preuss and Goldman-Rakic, 1989; Lu et al., 1994; Luppino et al., 2003; Takada et al., 2004). In contrast to PFdl, PFo is strongly interconnected with sensory areas of the cortex, such as the inferotemporal cortex, and is much less directly connected to motor areas (Jones and Powell, 1970; Barbas, 1988; Webster et al., 1994; Saleem et al., 2008). The finding that strategy selectivity appeared sooner in PFo than in PFdl seems to be consistent with these anatomical differences. Our task instructed a strategy by visual cues, in particular by stimulus color and orientation. These visual features are represented in the inferotemporal cortex, so PFo would have more direct access to these representations than would PFdl. As explained above, the strategy signals in PFo do not reflect stimulus features per se; they instead encode a strategy or rule selected on the basis of stimuli with these features.
The three ways that PFdl differs from PFo in strategy coding—the conjunction of strategy coding with response coding, later strategy signals, and weak or absent strategy coding on error trials—suggest a model in which PFo provides a strategy signal to PFdl, which selects a response based on the strategy and a memory of the previous response. Conjunctions with responses would be expected for an area involved in response selection. Not only do response–strategy conjunctions occur mainly in PFdl compared with PFo (Fig. 4), but these areas also encode the conjunction of responses and upcoming reward quantity (Wallis and Miller, 2003b; Kennerley and Wallis, 2009b), along with other response–outcome conjunctions (Barraclough et al., 2004; Tsujimoto and Sawaguchi, 2004; Seo and Lee, 2009). The later onset for strategy signals in PFdl compared with PFo (Figs. 5, 6) also supports this model because response selection follows strategy selection in the present task. The observation that PFdl's response signal also develops at this later time (Fig. 7) is consistent with this view, with strategy encoded earlier than the response in PFo but not in PFdl. Error-trial activity provides further support (Fig. 8). Consistent with our previous report (Genovesio et al., 2008), the strategy signal in PFdl was weak or absent on error trials, which could have contributed to the implementation of the incorrect strategy or to the selection of a response independent of either strategy. We expect that a robust strategy signal in PFdl is needed for the selection of the appropriate response.
Buckley et al. (2009) concluded that PFdl lesions impaired the maintenance of a selected rule in working memory. Our findings do not disagree with that conclusion, although we note that attentional factors can also explain their results. The contents of working memory are used to guide appropriate actions and its contents are thought to be monitored (Petrides, 2000a,b; Champod and Petrides, 2007; Baddeley, 2010). Monitoring, in this sense, is an attentional function applied to the contents of memory. The weakness of the strategy signal in PFdl on error trials (Fig. 8C) could reflect inattention to the strategy selected by neural networks that include PFo.
In conclusion, we note that the results for error trials resemble previous findings for PFo and PFdl, with some important differences. At feedback time, PFo neurons encode the response made regardless of outcome, whereas response-related activity in PFdl is weak or absent on error trials (Tsujimoto et al., 2009). Here, we found that, during the cue period, PFo neurons encode the strategy cued, regardless of outcome, whereas strategy-related activity in PFdl is weak or absent. These results in PFo differ, however, in that the feedback-period signal reflects the response implemented (although incorrect), but the cue-period signal reflects the correct strategy (although the one not implemented). A recent report by Kennerley and Wallis (2009a) might help interpret this combination of results. They suggest that PFo encodes many variables that are useful for choices, not merely the outcomes associated with stimuli. Viewed in this context, PFo could encode the strategy cued and the response made for use in making future decisions, even when that strategy was not implemented and the response was not correct.
Footnotes
This work was supported by the Division of Intramural Research of the National Institute of Mental Health (Z01MH-01092) and by Grants-in-Aid from the Ministry of Education, Culture, Sports, Science and Technology (21119513) and Japan Society for the Promotion of Science (22700340). We thank Dr. Andrew R. Mitz, James Fellows, and Ping-Yu Chen for technical support.
References
- Asaad WF, Rainer G, Miller EK. Task-specific neural activity in the primate prefrontal cortex. J Neurophysiol. 2000;84:451–459. doi: 10.1152/jn.2000.84.1.451. [DOI] [PubMed] [Google Scholar]
- Baddeley A. Working memory. Curr Biol. 2010;20:R136–R140. doi: 10.1016/j.cub.2009.12.014. [DOI] [PubMed] [Google Scholar]
- Barbas H. Anatomic organization of basoventral and mediodorsal visual recipient prefrontal regions in the rhesus monkey. J Comp Neurol. 1988;276:313–342. doi: 10.1002/cne.902760302. [DOI] [PubMed] [Google Scholar]
- Barbas H, Pandya DN. Architecture and intrinsic connections of the prefrontal cortex in the rhesus monkey. J Comp Neurol. 1989;286:353–375. doi: 10.1002/cne.902860306. [DOI] [PubMed] [Google Scholar]
- Barceló F, Knight RT. Both random and perseverative errors underlie WCST deficits in prefrontal patients. Neuropsychologia. 2002;40:349–356. doi: 10.1016/s0028-3932(01)00110-5. [DOI] [PubMed] [Google Scholar]
- Barraclough DJ, Conroy ML, Lee D. Prefrontal cortex and decision making in a mixed-strategy game. Nat Neurosci. 2004;7:404–410. doi: 10.1038/nn1209. [DOI] [PubMed] [Google Scholar]
- Baxter MG, Murray EA. The amygdala and reward. Nat Rev Neurosci. 2002;3:563–573. doi: 10.1038/nrn875. [DOI] [PubMed] [Google Scholar]
- Baxter MG, Gaffan D, Kyriazis DA, Mitchell AS. Ventrolateral prefrontal cortex is required for performance of a strategy implementation task but not reinforcer devaluation effects in rhesus monkeys. Eur J Neurosci. 2009;29:2049–2059. doi: 10.1111/j.1460-9568.2009.06740.x. [DOI] [PMC free article] [PubMed] [Google Scholar]
- Bouret S, Richmond BJ. Ventromedial and orbital prefrontal neurons differentially encode internally and externally driven motivational values in monkeys. J Neurosci. 2010;30:8591–8601. doi: 10.1523/JNEUROSCI.0049-10.2010. [DOI] [PMC free article] [PubMed] [Google Scholar]
- Brass M, Derrfuss J, Matthes-von Cramon G, von Cramon DY. Imitative response tendencies in patients with frontal brain lesions. Neuropsychology. 2003;17:265–271. doi: 10.1037/0894-4105.17.2.265. [DOI] [PubMed] [Google Scholar]
- Buckley MJ, Mansouri FA, Hoda H, Mahboubi M, Browning PG, Kwok SC, Phillips A, Tanaka K. Dissociable components of rule-guided behavior depend on distinct medial and prefrontal regions. Science. 2009;325:52–58. doi: 10.1126/science.1172377. [DOI] [PubMed] [Google Scholar]
- Bunge SA, Kahn I, Wallis JD, Miller EK, Wagner AD. Neural circuits subserving the retrieval and maintenance of abstract rules. J Neurophysiol. 2003;90:3419–3428. doi: 10.1152/jn.00910.2002. [DOI] [PubMed] [Google Scholar]
- Bunge SA, Wallis JD, Parker A, Brass M, Crone EA, Hoshi E, Sakai K. Neural circuitry underlying rule use in humans and nonhuman primates. J Neurosci. 2005;25:10347–10350. doi: 10.1523/JNEUROSCI.2937-05.2005. [DOI] [PMC free article] [PubMed] [Google Scholar]
- Bussey TJ, Wise SP, Murray EA. The role of ventral and orbital prefrontal cortex in conditional visuomotor learning and strategy use in rhesus monkeys (Macaca mulatta) Behav Neurosci. 2001;115:971–982. doi: 10.1037//0735-7044.115.5.971. [DOI] [PubMed] [Google Scholar]
- Carmichael ST, Price JL. Architectonic subdivision of the orbital and medial prefrontal cortex in the macaque monkey. J Comp Neurol. 1994;346:366–402. doi: 10.1002/cne.903460305. [DOI] [PubMed] [Google Scholar]
- Carmichael ST, Price JL. Connectional networks within the orbital and medial prefrontal cortex of macaque monkeys. J Comp Neurol. 1996;371:179–207. doi: 10.1002/(SICI)1096-9861(19960722)371:2<179::AID-CNE1>3.0.CO;2-#. [DOI] [PubMed] [Google Scholar]
- Cavada C, Compañy T, Tejedor J, Cruz-Rizzolo RJ, Reinoso-Suárez F. The anatomical connections of the macaque monkey orbitofrontal cortex: a review. Cereb Cortex. 2000;10:220–242. doi: 10.1093/cercor/10.3.220. [DOI] [PubMed] [Google Scholar]
- Champod AS, Petrides M. Dissociable roles of the posterior parietal and the prefrontal cortex in manipulation and monitoring processes. Proc Natl Acad Sci U S A. 2007;104:14837–14842. doi: 10.1073/pnas.0607101104. [DOI] [PMC free article] [PubMed] [Google Scholar]
- Collins P, Roberts AC, Dias R, Everitt BJ, Robbins TW. Perseveration and strategy in a novel spatial self-ordered sequencing task for nonhuman primates: effects of excitotoxic lesions and dopamine depletions of the prefrontal cortex. J Cogn Neurosci. 1998;10:332–354. doi: 10.1162/089892998562771. [DOI] [PubMed] [Google Scholar]
- Genovesio A, Wise SP. The neurophysiology of abstract response strategies. In: Bunge SA, Wallis JD, editors. Neuroscience of rule-guided behavior. Oxford: Oxford UP; 2008. pp. 81–107. [Google Scholar]
- Genovesio A, Brasted PJ, Mitz AR, Wise SP. Prefrontal cortex activity related to abstract response strategies. Neuron. 2005;47:307–320. doi: 10.1016/j.neuron.2005.06.006. [DOI] [PMC free article] [PubMed] [Google Scholar]
- Genovesio A, Brasted PJ, Wise SP. Representation of future and previous spatial goals by separate neural populations in prefrontal cortex. J Neurosci. 2006;26:7305–7316. doi: 10.1523/JNEUROSCI.0699-06.2006. [DOI] [PMC free article] [PubMed] [Google Scholar]
- Genovesio A, Tsujimoto S, Wise SP. Encoding problem-solving strategies in prefrontal cortex: activity during strategic errors. Eur J Neurosci. 2008;27:984–990. doi: 10.1111/j.1460-9568.2008.06048.x. [DOI] [PMC free article] [PubMed] [Google Scholar]
- Hikosaka K, Watanabe M. Delay activity of orbital and lateral prefrontal neurons of the monkey varying with different rewards. Cereb Cortex. 2000;10:263–271. doi: 10.1093/cercor/10.3.263. [DOI] [PubMed] [Google Scholar]
- Hoshi E, Shima K, Tanji J. Neuronal activity in the primate prefrontal cortex in the process of motor selection based on two behavioral rules. J Neurophysiol. 2000;83:2355–2373. doi: 10.1152/jn.2000.83.4.2355. [DOI] [PubMed] [Google Scholar]
- Jones EG, Powell TP. An anatomical study of converging sensory pathways within the cerebral cortex of the monkey. Brain. 1970;93:793–820. doi: 10.1093/brain/93.4.793. [DOI] [PubMed] [Google Scholar]
- Kennerley SW, Wallis JD. Evaluating choices by single neurons in the frontal lobe: outcome value encoded across multiple decision variables. Eur J Neurosci. 2009a;29:2061–2073. doi: 10.1111/j.1460-9568.2009.06743.x. [DOI] [PMC free article] [PubMed] [Google Scholar]
- Kennerley SW, Wallis JD. Encoding of reward and space during a working memory task in the orbitofrontal cortex and anterior cingulate sulcus. J Neurophysiol. 2009b;102:3352–3364. doi: 10.1152/jn.00273.2009. [DOI] [PMC free article] [PubMed] [Google Scholar]
- Kennerley SW, Dahmubed AF, Lara AH, Wallis JD. Neurons in the frontal lobe encode the value of multiple decision variables. J Cogn Neurosci. 2009;21:1162–1178. doi: 10.1162/jocn.2009.21100. [DOI] [PMC free article] [PubMed] [Google Scholar]
- Kobayashi S, Pinto de Carvalho O, Schultz W. Adaptation of reward sensitivity in orbitofrontal neurons. J Neurosci. 2010;30:534–544. doi: 10.1523/JNEUROSCI.4009-09.2010. [DOI] [PMC free article] [PubMed] [Google Scholar]
- Kowalska DM, Bachevalier J, Mishkin M. The role of the inferior prefrontal convexity in performance of delayed nonmatching-to-sample. Neuropsychologia. 1991;29:583–600. doi: 10.1016/0028-3932(91)90012-w. [DOI] [PubMed] [Google Scholar]
- Lu MT, Preston JB, Strick PL. Interconnections between the prefrontal cortex and the premotor areas in the frontal lobe. J Comp Neurol. 1994;341:375–392. doi: 10.1002/cne.903410308. [DOI] [PubMed] [Google Scholar]
- Luppino G, Rozzi S, Calzavara R, Matelli M. Prefrontal and agranular cingulate projections to the dorsal premotor areas F2 and F7 in the macaque monkey. Eur J Neurosci. 2003;17:559–578. doi: 10.1046/j.1460-9568.2003.02476.x. [DOI] [PubMed] [Google Scholar]
- Mansouri FA, Matsumoto K, Tanaka K. Prefrontal cell activities related to monkeys' success and failure in adapting to rule changes in a Wisconsin Card Sorting Test analog. J Neurosci. 2006;26:2745–2756. doi: 10.1523/JNEUROSCI.5238-05.2006. [DOI] [PMC free article] [PubMed] [Google Scholar]
- Mansouri FA, Tanaka K, Buckley MJ. Conflict-induced behavioural adjustment: a clue to the executive functions of the prefrontal cortex. Nat Rev Neurosci. 2009;10:141–152. doi: 10.1038/nrn2538. [DOI] [PubMed] [Google Scholar]
- Milner B. The effects of different brain lesions on card sorting. Arch Neurol. 1963;9:90–100. [Google Scholar]
- Monchi O, Petrides M, Petre V, Worsley K, Dagher A. Wisconsin Card Sorting revisited: distinct neural circuits participating in different stages of the task identified by event-related functional magnetic resonance imaging. J Neurosci. 2001;21:7733–7741. doi: 10.1523/JNEUROSCI.21-19-07733.2001. [DOI] [PMC free article] [PubMed] [Google Scholar]
- Muhammad R, Wallis JD, Miller EK. A comparison of abstract rules in the prefrontal cortex, premotor cortex, inferior temporal cortex, and striatum. J Cogn Neurosci. 2006;18:974–989. doi: 10.1162/jocn.2006.18.6.974. [DOI] [PubMed] [Google Scholar]
- Owen AM, Evans AC, Petrides M. Evidence for a two-stage model of spatial working memory processing within the lateral frontal cortex: a positron emission tomography study. Cereb Cortex. 1996;6:31–38. doi: 10.1093/cercor/6.1.31. [DOI] [PubMed] [Google Scholar]
- Padoa-Schioppa C. Orbitofrontal cortex and the computation of economic value. Ann N Y Acad Sci. 2007;1121:232–253. doi: 10.1196/annals.1401.011. [DOI] [PubMed] [Google Scholar]
- Padoa-Schioppa C, Assad JA. Neurons in the orbitofrontal cortex encode economic value. Nature. 2006;441:223–226. doi: 10.1038/nature04676. [DOI] [PMC free article] [PubMed] [Google Scholar]
- Padoa-Schioppa C, Assad JA. The representation of economic value in the orbitofrontal cortex is invariant for changes of menu. Nat Neurosci. 2008;11:95–102. doi: 10.1038/nn2020. [DOI] [PMC free article] [PubMed] [Google Scholar]
- Passingham RE. Oxford: Oxford UP; 1993. The frontal lobes and voluntary action. [Google Scholar]
- Passingham RE, Stephan KE, Kötter R. The anatomical basis of functional localization in the cortex. Nat Rev Neurosci. 2002;3:606–616. doi: 10.1038/nrn893. [DOI] [PubMed] [Google Scholar]
- Petrides M. The role of the mid-dorsolateral prefrontal cortex in working memory. Exp Brain Res. 2000a;133:44–54. doi: 10.1007/s002210000399. [DOI] [PubMed] [Google Scholar]
- Petrides M. Dissociable roles of mid-dorsolateral prefrontal and anterior inferotemporal cortex in visual working memory. J Neurosci. 2000b;20:7496–7503. doi: 10.1523/JNEUROSCI.20-19-07496.2000. [DOI] [PMC free article] [PubMed] [Google Scholar]
- Preuss TM, Goldman-Rakic PS. Connections of the ventral granular frontal cortex of macaques with perisylvian premotor and somatosensory areas: anatomical evidence for somatic representation in primate frontal association cortex. J Comp Neurol. 1989;282:293–316. doi: 10.1002/cne.902820210. [DOI] [PubMed] [Google Scholar]
- Rainer G, Miller EK. Effects of visual experience on the representation of objects in the prefrontal cortex. Neuron. 2000;27:179–189. doi: 10.1016/s0896-6273(00)00019-2. [DOI] [PubMed] [Google Scholar]
- Rushworth MF, Nixon PD, Eacott MJ, Passingham RE. Ventral prefrontal cortex is not essential for working memory. J Neurosci. 1997;17:4829–4838. doi: 10.1523/JNEUROSCI.17-12-04829.1997. [DOI] [PMC free article] [PubMed] [Google Scholar]
- Saleem KS, Kondo H, Price JL. Complementary circuits connecting the orbital and medial prefrontal networks with the temporal, insular, and opercular cortex in the macaque monkey. J Comp Neurol. 2008;506:659–693. doi: 10.1002/cne.21577. [DOI] [PubMed] [Google Scholar]
- Schultz W. Behavioral theories and the neurophysiology of reward. Annu Rev Psychol. 2006;57:87–115. doi: 10.1146/annurev.psych.56.091103.070229. [DOI] [PubMed] [Google Scholar]
- Seo H, Lee D. Behavioral and neural changes after gains and losses of conditioned reinforcers. J Neurosci. 2009;29:3627–3641. doi: 10.1523/JNEUROSCI.4726-08.2009. [DOI] [PMC free article] [PubMed] [Google Scholar]
- Simmons JM, Richmond BJ. Dynamic changes in representations of preceding and upcoming reward in monkey orbitofrontal cortex. Cereb Cortex. 2008;18:93–103. doi: 10.1093/cercor/bhm034. [DOI] [PubMed] [Google Scholar]
- Stuss DT, Levine B, Alexander MP, Hong J, Palumbo C, Hamer L, Murphy KJ, Izukawa D. Wisconsin Card Sorting Test performance in patients with focal frontal and posterior brain damage: effects of lesion location and test structure on separable cognitive processes. Neuropsychologia. 2000;38:388–402. doi: 10.1016/s0028-3932(99)00093-7. [DOI] [PubMed] [Google Scholar]
- Takada M, Nambu A, Hatanaka N, Tachibana Y, Miyachi S, Taira M, Inase M. Organization of prefrontal outflow toward frontal motor-related areas in macaque monkeys. Eur J Neurosci. 2004;19:3328–3342. doi: 10.1111/j.0953-816X.2004.03425.x. [DOI] [PubMed] [Google Scholar]
- Tanji J, Hoshi E. Role of the lateral prefrontal cortex in executive behavioral control. Physiol Rev. 2008;88:37–57. doi: 10.1152/physrev.00014.2007. [DOI] [PubMed] [Google Scholar]
- Thorpe SJ, Rolls ET, Maddison S. The orbitofrontal cortex: neuronal activity in the behaving monkey. Exp Brain Res. 1983;49:93–115. doi: 10.1007/BF00235545. [DOI] [PubMed] [Google Scholar]
- Tremblay L, Schultz W. Relative reward preference in primate orbitofrontal cortex. Nature. 1999;398:704–708. doi: 10.1038/19525. [DOI] [PubMed] [Google Scholar]
- Tsujimoto S, Sawaguchi T. Neuronal representation of response-outcome in the primate prefrontal cortex. Cereb Cortex. 2004;14:47–55. doi: 10.1093/cercor/bhg090. [DOI] [PubMed] [Google Scholar]
- Tsujimoto S, Genovesio A, Wise SP. Transient neuronal correlations underlying goal selection and maintenance in prefrontal cortex. Cereb Cortex. 2008;18:2748–2761. doi: 10.1093/cercor/bhn033. [DOI] [PMC free article] [PubMed] [Google Scholar]
- Tsujimoto S, Genovesio A, Wise SP. Monkey orbitofrontal cortex encodes response choices near feedback time. J Neurosci. 2009;29:2569–2574. doi: 10.1523/JNEUROSCI.5777-08.2009. [DOI] [PMC free article] [PubMed] [Google Scholar]
- Tsujimoto S, Genovesio A, Wise SP. Evaluating self-generated decisions in frontal pole cortex of monkeys. Nat Neurosci. 2010;13:120–126. doi: 10.1038/nn.2453. [DOI] [PMC free article] [PubMed] [Google Scholar]
- Wallis JD. Orbitofrontal cortex and its contribution to decision-making. Annu Rev Neurosci. 2007;30:31–56. doi: 10.1146/annurev.neuro.30.051606.094334. [DOI] [PubMed] [Google Scholar]
- Wallis JD, Miller EK. From rule to response: neuronal processes in the premotor and prefrontal cortex. J Neurophysiol. 2003a;90:1790–1806. doi: 10.1152/jn.00086.2003. [DOI] [PubMed] [Google Scholar]
- Wallis JD, Miller EK. Neuronal activity in primate dorsolateral and orbital prefrontal cortex during performance of a reward preference task. Eur J Neurosci. 2003b;18:2069–2081. doi: 10.1046/j.1460-9568.2003.02922.x. [DOI] [PubMed] [Google Scholar]
- Wallis JD, Anderson KC, Miller EK. Single neurons in prefrontal cortex encode abstract rules. Nature. 2001;411:953–956. doi: 10.1038/35082081. [DOI] [PubMed] [Google Scholar]
- Walton ME, Behrens TE, Buckley MJ, Rudebeck PH, Rushworth MF. Separable learning systems in the macaque brain and the role of orbitofrontal cortex in contingent learning. Neuron. 2010;65:927–939. doi: 10.1016/j.neuron.2010.02.027. [DOI] [PMC free article] [PubMed] [Google Scholar]
- Wang M, Zhang H, Li BM. Deficit in conditional visuomotor learning by local infusion of bicuculline into the ventral prefrontal cortex in monkeys. Eur J Neurosci. 2000;12:3787–3796. doi: 10.1046/j.1460-9568.2000.00238.x. [DOI] [PubMed] [Google Scholar]
- Watanabe M, Sakagami M. Integration of cognitive and motivational context information in the primate prefrontal cortex. Cereb Cortex. 2007;17(Suppl 1):i101–i109. doi: 10.1093/cercor/bhm067. [DOI] [PubMed] [Google Scholar]
- Webster MJ, Bachevalier J, Ungerleider LG. Connections of inferior temporal areas TEO and TE with parietal and frontal cortex in macaque monkeys. Cereb Cortex. 1994;4:470–483. doi: 10.1093/cercor/4.5.470. [DOI] [PubMed] [Google Scholar]
- White IM, Wise SP. Rule-dependent neuronal activity in the prefrontal cortex. Exp Brain Res. 1999;126:315–335. doi: 10.1007/s002210050740. [DOI] [PubMed] [Google Scholar]
- Wise SP, Murray EA. Role of the hippocampal system in conditional motor learning: mapping antecedents to action. Hippocampus. 1999;9:101–117. doi: 10.1002/(SICI)1098-1063(1999)9:2<101::AID-HIPO3>3.0.CO;2-L. [DOI] [PubMed] [Google Scholar]
- Yamada M, Pita MC, Iijima T, Tsutsui K. Rule-dependent anticipatory activity in prefrontal neurons. Neurosci Res. 2010;67:162–171. doi: 10.1016/j.neures.2010.02.011. [DOI] [PubMed] [Google Scholar]