

Abstract
The repertoire of neural activity patterns that a cortical network can produce constrains the ability of the network to transfer and process information. Here, we measured activity patterns obtained from multisite local field potential recordings in cortex cultures, urethane-anesthetized rats, and awake macaque monkeys. First, we quantified the information capacity of the pattern repertoire of ongoing and stimulus-evoked activity using Shannon entropy. Next, we quantified the efficacy of information transmission between stimulus and response using mutual information. By systematically changing the ratio of excitation/inhibition (E/I) in vitro and in a network model, we discovered that both information capacity and information transmission are maximized at a particular intermediate E/I, at which ongoing activity emerges as neuronal avalanches. Next, we used our in vitro and model results to correctly predict in vivo information capacity and interactions between neuronal groups during ongoing activity. Close agreement between our experiments and model suggest that neuronal avalanches and peak information capacity arise because of criticality and are general properties of cortical networks with balanced E/I.
Introduction
In the cortex, populations of neurons continuously receive input from upstream neurons, integrate it with their own ongoing activity, and generate output destined for downstream neurons. Such cortical information processing and transmission is limited by the repertoire of different activated configurations available to the population. The extent of this repertoire may be quantified by its entropy H; in the context of information theory, entropy characterizes the information capacity of the population (Shannon, 1948; Rieke et al., 1997; Dayan and Abbott, 2001). Information capacity is important because, as the name suggests, it defines upper limits on aspects of information processing. For example, consider the information transmitted from input to output by a population that only has two states in its repertoire (H ≤ 1 bit). No matter how much information the input contains, the information content of its output cannot exceed 1 bit. A network with low entropy presents a bottleneck for information transmission in the cortex. Thus, it is important to understand the mechanisms that modulate the entropy of cortical networks.
Cortical activity depends on the ratio of fast excitatory (E) to inhibitory (I) synaptic inputs to neurons in the network. This E/I ratio remains fixed on average even during highly fluctuating activity levels (Shu et al., 2003; Okun and Lampl, 2008). However, it is currently not known whether a particular E/I ratio is advantageous for certain aspects of information processing. The existence of such an optimal ratio is suggested by two competing effects of E/I on entropy. First, a large E/I ratio, i.e., if excitation is insufficiently restrained by inhibition, can cause very high correlations between neurons (Dichter and Ayala, 1987). Because increased correlations decrease entropy (Rieke et al., 1997; Dayan and Abbott, 2001), we anticipate that a sufficiently large E/I ratio limits information transmission. This is consistent with findings that moderate levels of correlation can play an important role in population coding (Pola et al., 2003; Jacobs et al., 2009). At the other extreme, i.e., a small E/I ratio, weak excitatory drive is expected to reduce correlations as well as the overall level of neural activity. Although reduced correlations can lead to higher entropy, this increase may be counteracted by a concurrent drop in activity. Sufficiently suppressed activity reduces entropy (Rieke et al., 1997; Dayan and Abbott, 2001). Accordingly, we hypothesize that cortical entropy and information transmission are maximized for an intermediate E/I ratio.
Here we tested our hypothesis experimentally in cortex cultures, anesthetized rats, and awake monkeys and compared our results with predictions from a computational model. We discovered an optimal intermediate E/I ratio distinguished by (1) maximal entropy and (2) maximal information transmission between input and network output. This finding was based on analysis of both ongoing and stimulus-evoked population activity. Moreover, at this optimal E/I ratio, ongoing activity emerges in the form of neuronal avalanches (Beggs and Plenz, 2003) and interactions within the network are moderate. Agreement with our model suggests that, by maintaining this particular E/I ratio, the cortex operates near criticality and optimizes information processing.
Materials and Methods
In vitro multielectrode array recordings and pharmacology. Cortex–ventral tegmental area organotypic cocultures were grown on planar integrated multielectrode arrays (MEAs) (for details, see Shew et al., 2009). In brief, the MEA contained 60 recording electrodes (8 × 8 grid with no corner electrodes, 30 μm diameter, 200 μm interelectrode spacing). Local field potential (LFP) signals were sampled at 4 kHz and low-pass filtered (50 Hz cutoff). Experiments consisted of a 1 h recording of ongoing activity, followed by 0.5–1 h of stimulus-evoked activity. Next, the antagonists were bath applied, and recordings of ongoing activity followed by stimulus-evoked activity were repeated. We applied either (1) DNQX (0.5–1 μm) + AP-5 (10–20 μm) or (2) picrotoxin (PTX) (5 μm). The stimuli consisted of brief electric shocks delivered through a single electrode of the array located near layers 2/3 of the cortex culture. Each stimulus had a bipolar time course with amplitude −S for 50 μs in duration, followed by an amplitude at +S/2 for 100 μs. We tested three similar sets of stimuli, each with 10 different stimulus levels (in μA): S1 = 10, 20, 30, 50, 60, 80, 100, 120, 150, 200; S2 = 6, 12, 24, 50, 65, 80, 100, 125, 150, 200; or S3 = 6, 12, 24, 50, 74, 100, 150, 200, 300, 400. Different amplitudes were applied in pseudorandom order at 5 s intervals.
MEA recordings in monkey.
All procedures were in accordance with National Institutes of Health guidelines and were approved by the National Institute of Mental Health Animal Care and Use Committee. Ninety-six-channel MEA (10 × 10 grid with no corner electrodes, 400 μm separation, and 1.0 mm electrode length) (BlackRock Microsystem) were chronically implanted in the left arm representation region of premotor cortex of two monkeys (Macaca mulatta, adults, one male and one female). Ongoing activity was recorded for 30 min. Monkeys were awake but not engaged by any task or controlled sensory stimulation. Extracellular signals were sampled at 30 kHz and filtered offline (1–100 Hz; phase neutral, fourth-order Butterworth). For Figure 5B, a 4 × 4 subset of electrodes was analyzed, matching spatial dimensions of the 4 × 4 coarse resolution view of the in vitro data (see below). For Figure 5C, 4 × 4 patterns based on a coarse-binned set of 8 × 8 electrodes spanning larger spatial area were analyzed.
Figure 5.
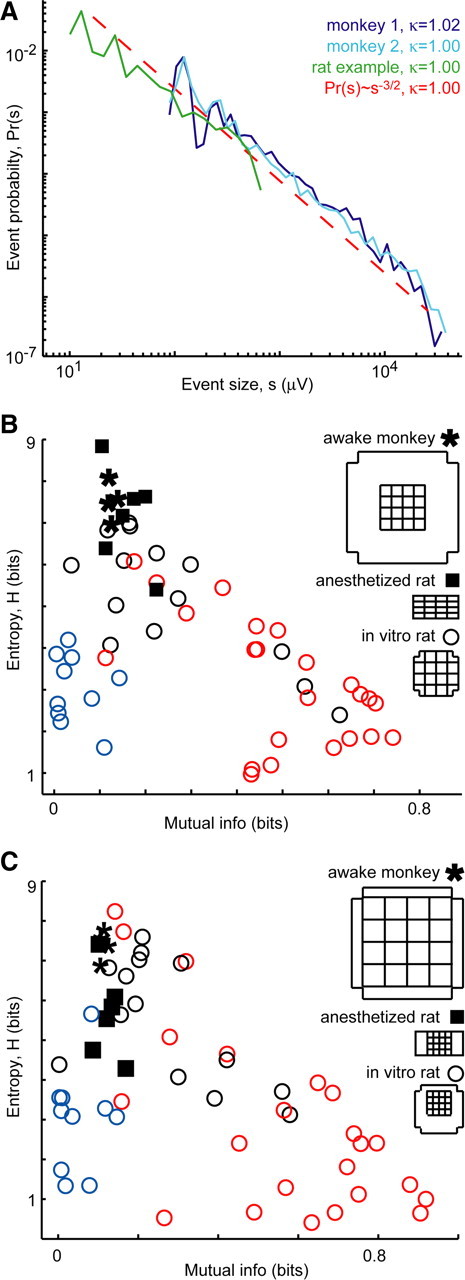
In vivo properties predicted from in vitro results. A, Population event size distributions from ongoing activity in two awake monkeys (blue) and an example rat (green) are near a power law with exponent −1.5 (dashed line), i.e., they exhibit neuronal avalanches and κ ≈ 1. B, In line with in vitro and model predictions for κ ≈ 1, in vivo entropy was high and mutual information between recording sites was moderate (asterisks, 2 recordings on different days from each monkey; squares, anesthetized rats; n = 6). The spatial extent of recorded area was approximately matched. C, The result holds even when the spatial scales and resolution differ by factor of 4.
MEA recordings in rats.
Urethane-anesthetized rats aged 15–25 d were studied. As described previously (Gireesh and Plenz, 2008), an MEA was inserted into superficial layers of barrel cortex (Michigan probe 8 × 4 electrodes, 200 μm interelectrode distance). Ongoing activity was recorded for 20–30 min (4 kHz sampling rate, 1–3000 Hz bandwidth) and filtered between 1 and 100 Hz (phase neutral, fourth-order Butterworth) to obtain the LFP. In Figure 5B, the 8 × 4 MEA was coarse binned into a 4 × 4 pattern with two electrodes contributing to each bit. In Figure 5C, 4 × 4 patterns based on only 16 electrodes were also analyzed.
Population event detection.
For each electrode, the SD of the LFP was calculated. Automated (Matlab) population event detection entailed first identifying large (less than −4 SD in vitro, −3 SD in vivo) negative LFP fluctuations. Second, the time stamp ti, amplitude ai, and electrode ei of each negative peak (nLFP) occurring during these large fluctuations was extracted. Next, consecutive nLFPs were assigned to the same population event if they occurred sufficiently close (ti+1 − ti < τ) in time. The time threshold τ was determined based on the inter-nLFP interval distribution, as described previously (Shew et al., 2009).
Event size distribution, neuronal avalanches, and κ.
We defined the size s of a population event as the sum of all ai that occur during the event. During one recording, we typically measured thousands of population events. We used a statistical measure called κ to quantify the character of each recording. The measure κ was developed to provide a network-level gauge of the E/I ratio, as demonstrated in a previous study (Shew et al., 2009). Similar to the Kolmogorov statistic, κ is computed based on the cumulative probability distribution of event sizes, F(β), which describes the probability of observing an event with size less than β. More specifically, κ quantifies the similarity of the measured F(β) and a theoretical reference distribution FNA(β). The reference distribution was chosen based on empirical observations that cortical networks with unaltered E/I tend to generate a probability distribution of population event sizes, P(s)∼s−1.5, which defines neuronal avalanches (Beggs and Plenz, 2003; Petermann et al., 2009; Shew et al., 2009). Importantly, population events are not considered to be neuronal avalanches unless they have this statistical property. Thus, FNA(β)∼β−0.5 is the cumulative distribution corresponding to neuronal avalanches, and κ assesses how close the observed distribution is to that of neuronal avalanches. By definition, κ is 1 plus the sum of 10 differences between F(β) and FNA(β):
 |
Therefore, κ ≈ 1 indicates a good match with the reference distribution and the existence of neuronal avalanches. Positive (negative) deviations away from κ ≈ 1 indicate a hyperexcitable (hypoexcitable) network and the absence of neuronal avalanches. The 10 points at which the differences are computed are logarithmically spaced over the range of measured event sizes. It was shown previously that κ is not sensitive to changes in the number of differences (5–100 were tried) (Shew et al., 2009).
Binary patterns and entropy H.
Each population event is represented by an 8 × 8 binary pattern with 1 bit per recording electrode. A bit is set to 1 if the corresponding electrode is active during the event; otherwise, it is set to 0. The entropy of this set of patterns is defined as
 |
where n is the number of unique binary patterns, and pi is the probability that pattern i occurs. In Figure 2B, the black curve is based on the 8 × 8 binary patterns, which represent the 60 electrodes of the MEA. We also studied entropy at different spatial resolutions by coarse binning and for different spatial extents by using subregions of the MEA. The green curves in Figures 2D, 3A,B, and 4A were obtained by reducing spatial resolution through coarse binning of 8 × 8 patterns into square 4 × 4 patterns. Each bit in the 4 × 4 pattern was dependent on the state of four neighboring 2 × 2 electrode sets; if at least one electrode was active, the bit was set to 1. Reduced spatial extent was tested with 16-bit patterns based on only 16 electrodes arranged in a 4 × 4 square (Fig. 2D). As pointed out in Results, these 4 × 4 patterns also reduce potential under sampling bias when compared with 8 × 8 patterns.
Figure 2.
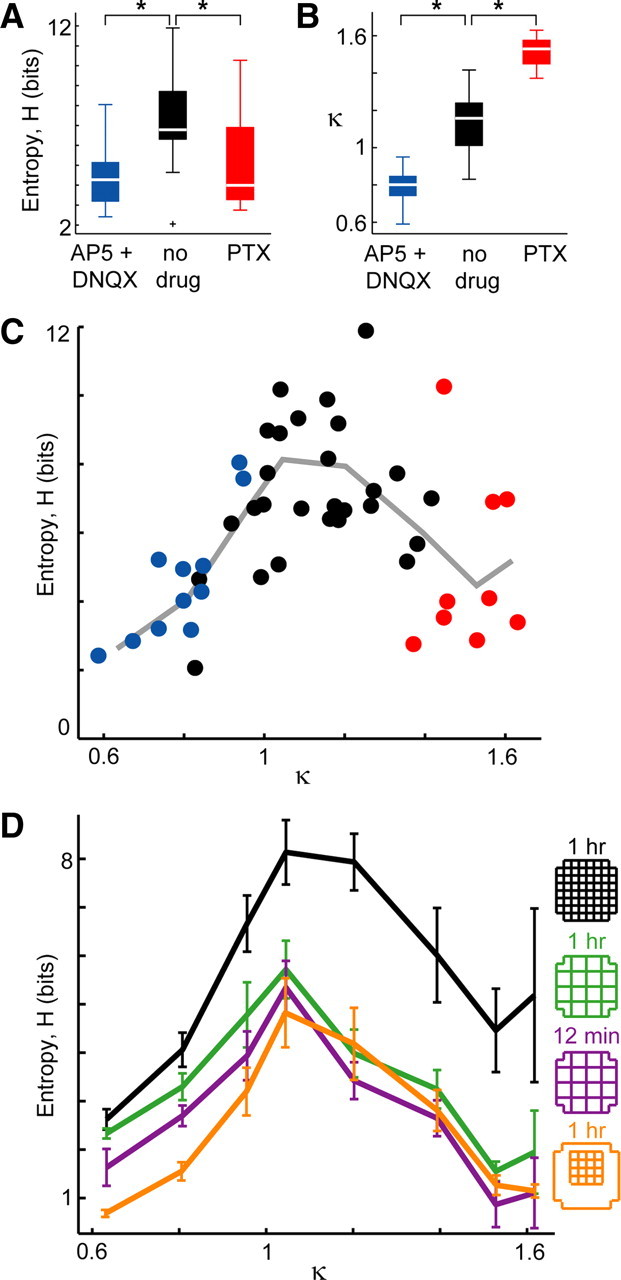
Ongoing activity: peak information capacity at intermediate E/I ratio specified by κ ≈ 1. A, Information capacity (entropy H) of the pattern repertoire is maximized when no drugs perturb the E/I ratio. Significant differences are marked; *p < 0.05. Box plot lines indicate lower quartile, median, upper quartile; whiskers indicate range of data, excluding outliers (+, >1.5 times the interquartile range). B, The statistic κ provides a graded measure of E/I condition based on network dynamics (see Materials and Methods). C, Entropy H peaks near κ ≈ 1. Each point represents one recording of ongoing activity (n = 47; 8 × 8 MEA; 1 h; color indicates drug condition: red, PTX; blue, AP-5/DNQX; black, no drug). Line is the binned average of points. D, The peak in entropy H is robust to changes in spatial resolution (green; 4 × 4 coarse binned, 1 h), spatial extent (orange; 4 × 4 subregion, 1 h), and duration (purple; 4 × 4 coarse binned, 12 min) of recording (black, same data as in C). Error bars indicate mean ± SEM.
Figure 3.
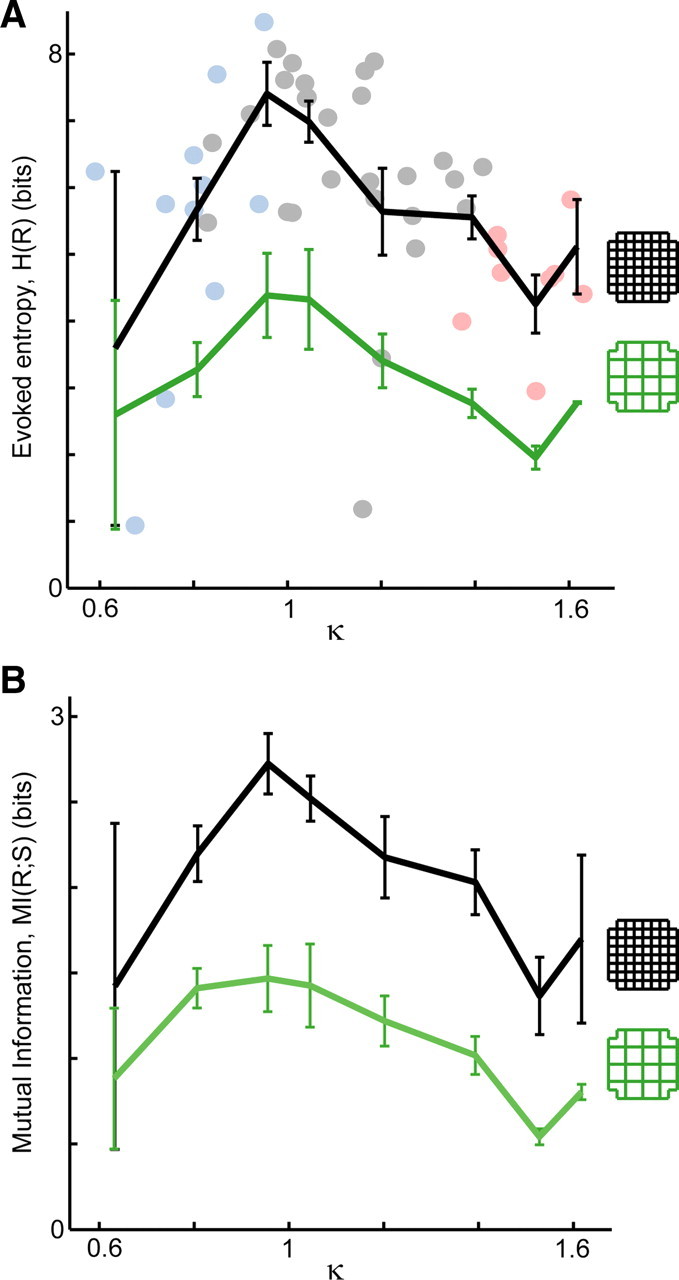
Stimulus-evoked activity: peak information transmission at intermediate E/I ratio specified by κ ≈ 1. A, Single shock stimuli with 10 different amplitudes (10–200 μA) were applied 40 times each using a single electrode. The pattern repertoire of stimulus-evoked activity has maximum entropy near κ = 1. This holds for 8 × 8 response patterns (black line) as well as coarse-resolution 4 × 4 patterns (green line). Points correspond to 8 × 8 patterns: light blue, AP-5/DNQX; gray, no drug; pink, PTX. B, The efficacy of information transfer, i.e., mutual information of stimulus and response, also peaks near κ = 1 (black, 8 × 8; green, 4 × 4). Error bars indicate SEM.
For stimulus-evoked activity, binary patterns were defined based on LFP activity measured during 500 ms after the stimulus. If the measured response at an electrode exceeded −8 SD of the noise, then the corresponding bit was set to 1; otherwise, it was set to 0. The stimulation electrode was always set to 0.
Note that the lack of corner electrodes on the MEA means that the corner bits of 8 × 8 patterns are always zero. This implies that the maximum entropy we could possibly record for 8 × 8 patterns is 260 rather than 264. For coarse-binned 4 × 4 patterns, the likelihood that the corner bits are active is slightly lower (∼25% lower). These effects are present for all E/I ratios examined. Therefore, they may affect the absolute values of entropy measurements, but they are not important for our conclusions, which are primarily based on changes in entropy. This is further confirmed by the robustness of our results to selecting 4 × 4 subregions from the center of the MEA for which corner electrodes are not missing (see Fig. 2D).
The calculation of entropy entails estimating the occurrence probability for each pattern. Therefore, H generally will depend on number N of observed patterns unless N is so large that the probability of each pattern is well represented by the samples recorded. H will be underestimated for sufficiently small N but becomes independent of N for sufficiently large N. To estimate potential “undersampling bias,” we computed corrected values following the quadratic extrapolation method (Magri et al., 2009). First, we randomly selected a fraction f of samples from the full set of N patterns. We recomputed the entropy for fractions f = 0.1 to 1 in steps of 0.1. We repeated this 10 times for each f. Next, we fit the average H versus f data with the following function:
 |
The fit parameter H0 is the estimated corrected value reported in Results.
Mutual information.
From a set of N binary patterns, we defined a participation vector qi (length N) for each recording site i. qi(j) = 1 or 0 indicated that site i was active or inactive during event j. The interaction between site i and site j was quantified by the mutual information (Rieke et al., 1997; Dayan and Abbott, 2001) of qi and qj defined as
 |
where p(x) is the probability of x, and p(x,y) is the joint probability x and y. Mutual information (MI) quantifies (in bits) the information shared by the two sites and provides similar information as a cross-correlation (supplemental Fig. S1, available at www.jneurosci.org as supplemental material). The MI values reported in Results were averages over all pairs of sites:
 |
For the in vitro experiments, we also used mutual information in a different way to quantify the efficacy of information transmission between stimulus and response. Here we computed MI(S;R) = H(R) − H(R|S). H(R) is the entropy of the full set of response patterns for all stimuli. H(R|S) is the conditional entropy (Rieke et al., 1997; Dayan and Abbott, 2001).
Likelihood of participation L.
Likelihood of participation Li for site i was defined as the fraction of patterns in which the site participated:
 |
The average likelihood of participation L for all M sites is discussed in text and defined as
 |
Data shuffling to destroy interactions.
For the purpose of understanding how the entropy changes as a result of interactions between sites, we created surrogate datasets by shuffling the events in which sites participated. The 1 and 0 were randomly reordered in each participation vector qi such that interactions between sites were destroyed, but Li and N remained fixed.
Model.
The model consisted of M = 16 binary sites (1, active; 0, inactive). Each site was intended to model the activity of a large group of neurons like the nLFP recorded at an electrode in the experiments. The strength of interactions between site i and site j was modeled as an activation probability; pij was the probability that site i would be activated at time t + 1 if site j was active at time t. Therefore, if a set J(t) of sites were active at time t, then site i would be active with probability PiJ(t) = 1−Πj∈J(t)(1−pij). Increasing (decreasing) the E/I ratio was modeled by increasing (decreasing) the average pij in the range between 0.1/M and 1.5/M (all pij were initially drawn from a uniform distribution on [0,1], and then all were scaled down by dividing by a constant). Population events were modeled by activating a single initial site (such as an electrical shock applied at a single electrode or a spontaneous activation in the experiments) and recording the resulting activations that propagated through the network. These dynamics were defined by
 |
where si(t) was the state of site i at time t, θ[x] = 0 (1) for x < 0 (>0), and ζi(t) was a random number drawn from a uniform distribution on [0,1] at each update of each site. The states of all sites were updated simultaneously at each time step. Each population event in the model was represented with a 16-bit binary pattern (1 indicates the site was active at least once during the response to the stimulus, otherwise 0). By simulating 1000 population events (always initiated at the same site), we generated a set of patterns for which the entropy was computed. From the event size distribution of network events, we computed κ (Shew et al., 2009). The event size was defined as the sum of all activations from all sites during the population event. The range of average pij values studied with the model resulted in a range of κ = 0.6 to 1.6.
Statistical analysis.
For determining the statistical significance of differences in entropy for different drug conditions and differences in κ for different drug conditions, we first used a one-way ANOVA to establish that at least one drug category was different from at least one other. Next we performed a post hoc test of significant pairwise differences between the drug categories using a t test with the Bonferroni's correction for multiple comparisons. The same procedure was used to assess significance of differences in H and MI for different categories of κ.
Results
In all of our experiments, MEA recordings of the LFP (Fig. 1A) were used to obtain patterns of cortical population activity. We defined a recording site as “active” if it presented a large, negative deflection in the LFP (Fig. 1A, green). We have demonstrated previously that such negative LFP deflections correlate with increased firing rates of the local neuronal population for each of the experimental preparations studied here: superficial layers of organotypic cultures (Shew et al., 2009), urethane-anesthetized rat (Gireesh and Plenz, 2008) and awake monkeys (Petermann et al., 2009). We define a “population event” as a set of electrodes that were active together within a short time (see Materials and Methods). In our analysis, each population event was represented by a binary spatial pattern with 1 bit per recording site and 1 or 0 indicating an active or inactive site, respectively (Fig. 1B, top). For each 1 h recording in vitro (n = 47) or 30 min recording in vivo (n = 2 monkeys, n = 6 rats), we typically observed 103 to 104 population events.
Figure 1.
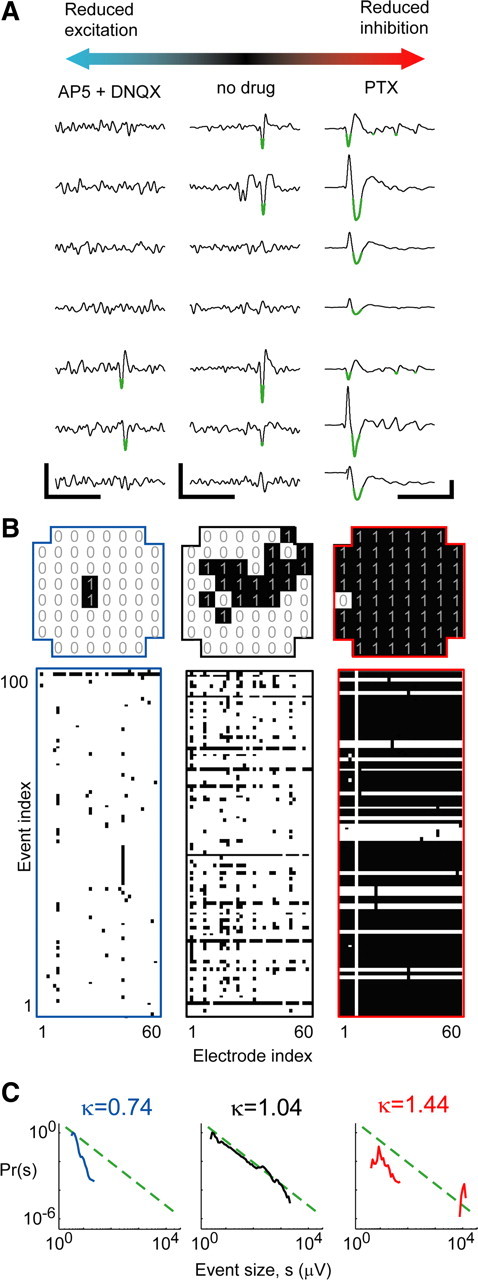
Measuring the neural activation pattern repertoire for a range of E/I conditions. A, Example LFP recordings under conditions of reduced E (left), unperturbed E/I (middle), and suppressed reduced I (right). Calibration: 250 ms, 10 μV (left, middle); 250 ms, 100 μV (right). Population events were defined based on large negative deflections (less than −4 SD; green). B, Top, Single examples of population events represented as binary patterns: 1, Active site; 0, inactive. Bottom, Rasters including 100 consecutive population events represented as binary patterns; each row represents one event, and each column represents one recording site. Left, Reduced E. Middle, Unperturbed. Right, Reduced I. C, Shape of event size distributions reveal changes in E/I, which are quantified with κ (see Materials and Methods; broken line, power law with exponent of −1.5).
First, we systematically explored a range of E/I conditions in cortex slice cultures. A reduced E/I ratio was obtained by bath application of antagonists of AMPA and NMDA glutamate receptor-mediated synaptic transmission (DNQX, 0.5–1 μm; AP-5, 10–20 μm). This resulted in population events that were typically small in spatial extent (Fig. 1B,C, left). Conversely, an increased E/I ratio was obtained with an antagonist of fast GABAA receptor-mediated synaptic inhibition (PTX, 5 μm), which led to stereotyped, spatially extended population events (Fig. 1B,C, right). In contrast, unperturbed E/I (Fig. 1B,C, middle) typically yielded a diverse pattern repertoire. The raster plots in Figure 1B (bottom) display examples of 100 consecutive population events recorded under the three different E/I conditions. Figure 1C displays example probability distributions of population event sizes for the three E/I conditions. We performed 11 recordings with reduced AP-5/DNQX, 27 with no drug, and 9 with PTX. For each recording, we measured both ongoing activity and stimulus-evoked activity. For all recordings, we assessed the information capacity by computing the Shannon entropy of the full set of recorded binary patterns (Shannon, 1948; Rieke et al., 1997; Dayan and Abbott, 2001) (see Materials and Methods).
Peak information capacity of ongoing activity for intermediate E/I and neuronal avalanches
Our first finding was that the entropy H for ongoing activity peaks at an intermediate E/I ratio. This was demonstrated with two different approaches. First, we compared entropy with the three pharmacological categories: AP-5/DNQX, no drug, and PTX. We found that, under the unperturbed E/I condition, the average H was significantly higher than either the reduced E/I condition of the AP-5/DNQX or the increased E/I condition of PTX (Fig. 2A) (ANOVA, p < 0.05). Second, we compared entropy with a previously developed statistical measure called κ, which characterizes E/I based on population dynamics of the network (Shew et al., 2009) (see Materials and Methods). An advantage over the three pharmacology categories is that κ is a graded measure, thus providing a continuous function of entropy H versus E/I. A detailed definition of κ is given in Materials and Methods. Briefly, κ quantifies the shape of the population event size distribution, which is sensitive to changes in E/I (Fig. 1C): κ < 1 indicated reduced E/I, and κ > 1 indicated increased E/I (Fig. 2B). Indeed, κ was significantly different for the two pharmacological manipulations compared with the no-drug condition (Fig. 2B) (p < 0.05). When we plotted entropy versus κ (Fig. 2C), we discovered a peaked function with maximum entropy occurring for κ ≈ 1. This confirms our finding of peak entropy for the no-drug condition (Fig. 2A) and provides a more refined view of the data; the peak occurred at κ* = 1.16 ± 0.12 (mean ± SD, uncertainty determined by rebinning the experimental data) (supplemental Fig. S2, available at www.jneurosci.org as supplemental material). The statistical significance of the peak in H was confirmed by comparing H for the 10 experiments with κ closest to 1 with the 10 experiments with smallest κ and 10 with largest κ (p < 0.05).
In addition to providing a graded measure of E/I, κ assesses the statistical character of ongoing cortical population dynamics. Specifically, κ ≈ 1 is the signature of neuronal avalanches (Shew et al., 2009), a type of population dynamics defined by a power-law population event size distribution with a power-law exponent near −1.5 (Beggs and Plenz, 2003; Stewart and Plenz, 2006; Gireesh and Plenz, 2008; Petermann et al., 2009; Shew et al., 2009). The computation of κ entails first computing the difference between a measured event size distribution and a theoretical reference distribution defined as a power law with exponent −1.5 (Fig. 1C, green dashed). Next, this difference is added to 1 [for historical reasons (Shew et al., 2009)], resulting in κ = 1 for an exact match with a −1.5 power law, i.e., neuronal avalanches. In this context, our findings indicate that entropy is maximized under conditions that result in neuronal avalanches.
Next we tested the robustness of the peak in H with respect to changes in spatial and temporal scales of recordings. First, as shown in Figure 2D (green), we found that the peak in H remained close to κ = 1 (κ* = 1.01 ± 0.02), even when the original 8 × 8 patterns were coarse grained to obtain 4 × 4 patterns at half the spatial resolution (see Materials and Methods). Second, the peak was also maintained when the spatial extent of the recorded area was reduced by 75% (4 × 4 electrodes near center of the MEA) (Fig. 2D). Finally, we confirmed that the peak persisted for a restricted recording duration of 12 min rather than 1 h (Fig. 2D, purple). The robustness of our finding to shorter recording durations is important because estimations of entropy depend on the number of samples recorded (see below).
Peak information transmission between stimulus and response for intermediate E/I and neuronal avalanches
We now present measurements of stimulus-evoked activation patterns. A priori, one can expect a different distribution of stimulus-evoked patterns compared with ongoing activity and thus different entropy. Indeed, studies suggest that ongoing activity is more diverse than typical stimulus-evoked activity (Fiser, 2004; Luczak et al., 2009; Churchland et al., 2010). However, if the entropy of evoked patterns changes with E/I in the same way that we found for ongoing activity, then evoked entropy may also peak near κ = 1. This possibility is in line with significant evidence that ongoing activity in the cortex is intimately related to stimulus-evoked activity (Kenet et al., 2003; Ji and Wilson, 2007; Han et al., 2008; Luczak et al., 2009). For instance, stimulus-evoked activity patterns recur during ongoing activity, at both the population level (Kenet et al., 2003; Han et al., 2008) and the level of spike sequences (Ji and Wilson, 2007). Therefore, our next aim was to test whether our finding of peak entropy near κ = 1 also holds for stimulus-evoked activity.
Stimuli consisted of 10 different amplitude single bipolar shocks each applied 40 times in randomized order through a single electrode of the MEA within cortical layers II/III (see Materials and Methods). A binary pattern was constructed to represent each response during the 20–500 ms after the stimulus. The evoked entropy H was calculated for the set of 400 stimulus-evoked activation patterns for each E/I. As found for ongoing activity, the evoked entropy was highest near κ = 1 for both fine and coarse spatial resolution (Fig. 3A, black shows 8 × 8, green shows coarse-grained 4 × 4) (p < 0.05).
In Introduction, we gave a simple example in which information transmission from input to output was limited because of low entropy. With our measurements of network responses (i.e., output) to stimuli (i.e., input), we can directly test whether efficacy of information transmission is optimized when entropy is maximized. This idea is concisely summarized in the following equation: MI(S;R) = H(R) − H(R|S). Here, MI(S;R) is the mutual information of stimulus and response, which quantifies the information transmission (Rieke et al., 1997; Dayan and Abbott, 2001). H(R) is the entropy of the full set of response patterns for all stimuli, whereas H(R|S) is the conditional entropy (Rieke et al., 1997; Dayan and Abbott, 2001). As shown above, H(R) is maximized near κ = 1. Because H(R|S) is always positive, MI(S;R) is bounded by H(R) and thus potentially also peaks near κ = 1. Indeed, we measured MI(S;R) under different E/I conditions and found that stimulus–response mutual information was maximized near κ = 1 (Fig. 3B, black shows 8 × 8, green shows coarse-grained 4 × 4) (p < 0.05).
Competition between activity rates and interactions explains peak in entropy
To identify and quantify the mechanisms leading to the peak in entropy near κ = 1, we analyzed in more detail the coarse-grained 4 × 4 patterns measured during ongoing activity (Fig. 2D, green). A priori, the total number of unique patterns that are possible is 216, implying a maximum H ≤ log2(216) = 16 bits. This maximum would be reached if all 216 patterns occurred with equal probability. However, during a 1 h recording, the network did not generate all possible patterns, nor were different patterns equally likely, resulting in H that was always below 16 bits. The peak in H was explained by three main factors that changed with the E/I ratio: (1) the number N of patterns observed during the recording, (2) the likelihood L that sites participate in patterns, and (3) the strength of interactions between sites. The first two effects are related to the rates of observed activity and impose upper bounds on H: effect 1 requires H ≤ log2(N) (Fig. 4A, dash–dot line), and effect 2 limits H in a way that depends on L (Fig. 4A, dashed line). Specifically, the highest possible entropy for a given L can be computed by assuming that sites are independent:
 |
where M is the number of recording sites, and Li is the likelihood of participation for site i. This formula is based on the fact that the entropy of two independent systems combined is the sum of their individual entropies. Because a single site i is either active (with probability Li) or inactive (with probability 1 − Li), its entropy is −Li log2 Li − (1 − Li) log2 (1 − Li). Thus, adding the entropy of all sites, we obtain the formula above. When L < ½, increasing L increases the upper bound on H. When L > ½, increasing L decreases the upper bound on H. We found that L increased over the range of E/I conditions we studied (Fig. 4C), whereas the number of patterns N did not show a systematic trend.
Figure 4.
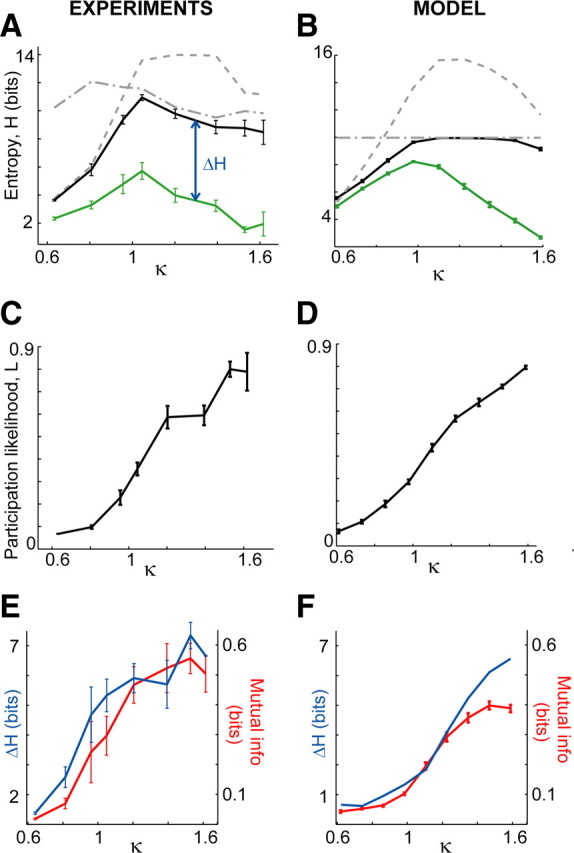
Peak information capacity explained. A detailed analysis of in vitro experimental results (left, Fig. 2D, green) and model results. A, B, Upper bounds on entropy are set by (1) the average likelihood that sites participate in patterns (dashed) and (2) the number of patterns observed (dash-dotted). When the effects of interactions are removed by shuffling (see Materials and Methods), the entropy reaches these bounds (black), but the measured entropy (green) is always lower as a result of interactions. C, D, Rise in participation likelihood L as E/I ratio is increased. This rise accounts for the bounds (dashed) shown in A and B. E, F, Rise in interactions between sites (mutual information, red) is proportional to the loss in information capacity ΔH (blue). All error bars indicate SEM.
We turn now to effect 3. Increased interactions between sites always reduce H because of the increased redundancy of the information at different sites (Schneidman et al., 2003). We found that site-to-site interactions during ongoing activity increased with E/I (Fig. 4E) and quantified this trend in two ways. First, we computed MI between the activity recorded from different pairs of sites (Fig. 4E, red). Note that above we used mutual information in a different way, computed between stimulus and response, MI(R;S), to assess information transmission. Second, we estimated the effect of interactions by computing the drop in entropy resulting from shuffling the data. The shuffling procedure destroyed interactions by randomizing the set of population events in which each site participated, while keeping L and N fixed (see Materials and Methods). The entropy of the shuffled data for the corresponding original κ value is shown in Figure 4A (black) and, as expected, nearly reached the bounds set by the combined effects 1 and 2. The difference in entropy ΔH between the measured and shuffled data is attributable to interactions (Fig. 4E, blue). ΔH has been used previously to quantify redundancy (Dayan and Abbott, 2001).
In summary, at low E/I, effects 2 and 3 compete and effect 2 wins, i.e., activity rates drop sufficiently low to cause low entropy although interactions are also low. At high E/I, effects 2 and 3 cooperate, i.e., both high activity rates and strong interactions cause low entropy. Entropy peaked at an intermediate E/I ratio at which interactions between sites were not too low or too high (specified by MI ≈ 0.2) and activity was not too depressed (L ≈ 0.25).
We remark that, if N were large enough (e.g., for longer recording duration), the upper bound attributable to effect 1 would become irrelevant, in which case, we still expect H to peak near κ = 1 as a result of the combined effects of interactions (ΔH) and L. Nonetheless, the persistence of the peak in H for shorter-duration recordings may be more relevant for cortex operations that occur on shorter timescales. We also tested the extent to which our measurements are impacted by sample size following the methods developed by Magri et al. (2009). The difference between our measured H and “corrected” H was 0.06 ± 0.06 (mean ± SD) bits for 4 × 4 in vitro ongoing activity patterns and 0.22 ± 0.18 bits for the 8 × 8 patterns. Thus, sample size effects are small compared with the variability from one experiment to another (see error bars in Fig. 2). We also point out that N, L, and MI are not the only factors that could potentially influence H. For example, not every site was equally likely to be active. Such spatial structure is expected to decrease entropy compared with a spatially homogeneous system with all other properties held fixed. This was not a major influence in our results.
Experimental results confirmed in a computational network-level model
To gain additional insight on our experiments, we compared our results with a network-level simulation, which has been used previously to model neuronal avalanches (Haldeman and Beggs, 2005; Kinouchi and Copelli, 2006; Shew et al., 2009). The model consisted of 16 binary sites. The state (1, active; 0, inactive) of each site was intended to represent a population of neurons in the vicinity of a recording electrode (see Materials and Methods). The propagation of activity from one site to another was treated probabilistically; a connection matrix p with entries pij specified the probability that site i would become activated as a result of site j having been activated in the previous time step. Increases (decreases) in E/I were modeled by increasing (decreasing) the average pij value through the range 0.006–0.1. For each E/I condition, 1000 population events were simulated, beginning with a single initially active site, and the resulting patterns of activity were recorded. To facilitate comparison with our experimental results, we also parameterized each E/I condition of the model using κ, based on population event size distributions.
In good agreement with our experiments, we found that entropy reached a peak for κ ≈ 1 (Fig. 4B, green). Moreover, the explanation of peak entropy in terms of the competition between activity rates and site-to-site interactions also held for the model. Just as in the experiments, when the model data was shuffled to remove effects attributable to interactions, H (Fig. 4B, black) approached the upper bounds set by the number of events (Fig. 4B, dash-dotted line) and the likelihoods of participation (Fig. 4B, dashed line). The model H results matched the experimental values, because the underlying changes in L versus κ (Fig. 4D) and the changes in site-to-site MI versus κ (Fig. 4F, red) were very similar to those measured experimentally. This agreement is not trivial; the same values of entropy could in principle be reached with different combinations of the underlying L and MI versus κ. For example, a peak in H could result if L remained fixed at 0.5 and interactions were minimized at κ = 1. Site-to-site mutual information in the model reached slightly lower levels for high κ when compared with experiments (Fig. 4F, red), which could be attributable to the lack of significant structure in the model connectivity matrix p.
In vivo entropy matches in vitro prediction
Finally, we analyzed recordings of ongoing activity from superficial cortical layers in two awake monkeys (premotor cortex) not engaged in any particular task and in urethane-anesthetized rats (n = 6, barrel cortex) with no whisker stimulation. In agreement with previous studies (Gireesh and Plenz, 2008; Petermann et al., 2009), we found that the ongoing activity was organized as neuronal avalanches (Fig. 5A). More precisely, we found that κ = 1.02 ± 0.02 for the monkeys and κ = 1.08 ± 0.02 for the rats. Based on our in vitro findings, these κ values suggest that the in vivo networks are operating under E/I conditions that maximize entropy and information transmission. Although we cannot fully test this idea without a full range of κ in vivo, we can test whether the in vivo values of H, L, and MI match with those predicted from the in vitro results. As shown in Figure 5B and summarized in Table 1, we found good agreement with these predictions. We found no statistically significant difference between the in vivo results and the prediction from in vitro experiments with the same range of κ (1.0 < κ < 1.1; p < 0.05). Nonetheless, the fact that entropy values in vivo were slightly higher than the in vitro results may be attributable to the corresponding slightly lower MI values. We note that the in vivo values of MI, which are based on LFP measurements, coexist with low values of pairwise correlation r between spiking activity of units (mean ± SEM; r = 0.03 ± 0.01) (supplemental Fig. S3, available at www.jneurosci.org as supplemental material), in line with recent reports for awake monkeys (Ecker et al., 2010) and anesthetized rats (Renart et al., 2010). The success of our prediction requires matching the number of recording sites (16 here) but is robust to large changes in spatial extent and resolution of recordings (Fig. 5C). The prediction is also robust to changes in the threshold used for generating binary activity patterns from continuous LFP data (supplemental Table S1, available at www.jneurosci.org as supplemental material).
Table 1.
In vivo results match in vitro predictions
| Entropy H (bits) | Participation likelihood L | Site-to-site MI (bits) | |
|---|---|---|---|
| In vitro predictions for 1.0 < κ < 1.1 | 5.7 ± 1.6 | 0.3 ± 0.1 | 0.2 ± 0.2 |
| Awake monkeys, κ = 1.02 ± 0.02 | 7.5 ± 0.5 | 0.3 ± 0.03 | 0.1 ± 0.01 |
| Anesthetized rats, κ = 1.08 ± 0.02 | 7.1 ± 1.2 | 0.4 ± 0.1 | 0.2 ± 0.1 |
Given the range of κ found in the in vivo recordings (1 < κ < 1.1), our in vitro results provide the predictions of H, L, and MI shown in the first row. The corresponding measurements from the awake monkeys (second row) and anesthetized rats (third row) match the in vitro predictions, i.e. they are not significantly different (p < 0.05). Corresponding data are shown in Figure 5B. All numbers are mean ± SD.
Discussion
We used in vitro and in vivo experiments as well as a computational model to study the effects of the E/I ratio on entropy and information transmission in cortical networks. We analyzed multisite measurements of LFP recorded during ongoing as well as stimulus-evoked activity. We found that entropy and information transmission are maximized for the particular E/I ratio specified by κ ≈ 1, which is the same E/I condition under which neuronal avalanches emerge.
We emphasize that the relative changes in H as we altered E/I are the meaningful results of our in vitro study; the absolute entropy values in bits depend on arbitrary aspects of the analysis and measurements, e.g., the number of electrodes in the MEA. Thus, we are not suggesting that there is an absolute cap on the information that a cortical circuit can represent at ∼10 bits, and it is not appropriate to compare our H values with those found in other studies of population entropy measures (Quian Quiroga and Panzeri, 2009). The important feature of our result is the peak in H near κ = 1. We expect that any measure of population entropy would also peak for the same intermediate E/I, specified by κ ≈ 1.
Previous studies have separately addressed the topics of entropy maximization (Laughlin, 1981; Dong and Atick, 1995; Dan et al., 1996; Li, 1996; Rieke et al., 1997; Dayan and Abbott, 2001; Garrigan et al., 2010), neuronal avalanches (Beggs and Plenz, 2003; Haldeman and Beggs, 2005; Stewart and Plenz, 2006; Ramo et al., 2007; Gireesh and Plenz, 2008; Petermann et al., 2009; Shew et al., 2009; Tanaka et al., 2009), and the balance of E/I (van Vreeswijk and Sompolinsky, 1996; Shadlen and Newsome, 1998; Shu et al., 2003; Roudi and Latham, 2007; Okun and Lampl, 2008; Sussillo and Abbott, 2009), but our work is the first to show how these ideas converge in cortical dynamics.
Significant evidence suggests that maximization of entropy is an organizing principle of neural information processing systems. For example, single neurons in the blowfly visual system have been shown to exhibit spike trains with maximized entropy, considering the stimuli the fly encounters naturally (Laughlin, 1981). Applied at the level of neural populations, the principle of maximized entropy has provided successful predictions of receptive field properties in mammalian retina (Garrigan et al., 2010), lateral geniculate nucleus (Dong and Atick, 1995; Dan et al., 1996), and visual cortex (Li, 1996). Our work shows that the potential ability of a neural population in the cortex to achieve maximum entropy and maximum information transmission depends on the E/I ratio. Thus, if such properties are optimal for the organism, then the particular E/I ratio specified by κ ≈ 1 may best facilitate this goal.
We note that our investigation is not directly related to “maximum entropy” models (Schneidman et al., 2006). In those studies, the aim was to use the maximum entropy principle (Jaynes, 1957) to find the simplest model to describe an experimental dataset; entropy served as a modeling constraint. In contrast, here we compare the entropy across different experiments, searching for conditions that result in maximum entropy; entropy measurements are the results.
Several theory and modeling studies (including our own model) offer a deeper explanation of why κ = 1 and neuronal avalanches occurs under E/I conditions that maximize entropy and information transmission (Greenfield and Lecar, 2001; Beggs and Plenz, 2003; Haldeman and Beggs, 2005; Ramo et al., 2007; Tanaka et al., 2009). Recall that neuronal avalanches and κ = 1, by definition, indicate a power-law event size distribution with exponent −3/2. This same property is found in many dynamical systems that operate near “criticality.” Criticality refers to a particular mode of operation balanced at the boundary between order and disorder (Stanley, 1971; Jensen, 1998), akin to the balance of excitation and inhibition that we explore in our experiments. In our model, criticality occurs when the average pij equals 1/M (M is the number of sites). When pc > 1/M, activity propagation is widespread and highly synchronous, like a seizure, whereas pc < 1/M results in weakly interacting, mostly independent neurons (Beggs and Plenz, 2003; Haldeman and Beggs, 2005; Kinouchi and Copelli, 2006). The balanced propagation that occurs at criticality might be attributed to interactions between excitatory and inhibitory neurons in the cortex. Using theory of Boolean networks, Ramo et al. (2007) showed theoretically that entropy of the event size distribution is maximized at criticality. Similarly, simulations of a model similar to our own showed that the number of activation patterns that repeat is maximized at criticality (Haldeman and Beggs, 2005). Tanaka et al. (2009) found that recurrent network models in which information transmission is optimized also exhibit neuronal avalanches and repeating activation patterns. Likewise, it has been shown that mutual information of input and output in feedforward network models is maximized near criticality (Beggs and Plenz, 2003). In line with these theory and model predictions, our results are the first experimental demonstration of peak entropy and information transmission in relation to criticality in the cortex.
Finally, a separate line of research has focused on the E/I ratio in cortical networks. Models emphasize the importance of balanced E/I for explaining the variability observed in spike trains (van Vreeswijk and Sompolinsky, 1996; Shadlen and Newsome, 1998), low correlations between spiking units (Renart et al., 2010), and generating diverse population activity patterns (Sussillo and Abbott, 2009), which may play a role in memory (Roudi and Latham, 2007). Moreover, in vivo experiments have shown that synaptic input received by cortical neurons exhibits a fixed ratio of excitatory to inhibitory current amplitudes (Shu et al., 2003; Okun and Lampl, 2008). Because we measure κ ≈ 1 in vivo, it follows that the “balanced E/I” discussed in these previous studies may also correspond to the optimal E/I that we identify here.
In summary, our results suggest that, by operating at the E/I ratio specified by κ ≈ 1, the cortex maintains a moderate level of network-level activity and interactions that maximizes information capacity and transmission. This finding supports the hypotheses that balanced E/I and criticality optimize information processing in the cortex.
Footnotes
This work was supported by the Intramural Research Program of the National Institute of Mental Health. R.R. acknowledges support from Department of Defense Multidisciplinary University Research Initiative Grant ONR N000140710734 to the University of Maryland. We thank E. D. Gireesh and C. Stewart for help with the anesthetized rat recordings and preparing the in vitro cortex cultures. We thank A. Mitz and R. Saunders for help with monkey surgery. W.L.S. and H.Y. contributed equally to in vitro and anesthetized rat recordings and all data analysis. S.Y. performed monkey recordings. R.R. and D.P. supervised the work. All authors contributed to the interpretation of the data and manuscript preparation.
References
- Beggs JM, Plenz D. Neuronal avalanches in neocortical circuits. J Neurosci. 2003;23:11167–11177. doi: 10.1523/JNEUROSCI.23-35-11167.2003. [DOI] [PMC free article] [PubMed] [Google Scholar]
- Churchland MM, Yu BM, Cunningham JP, Sugrue LP, Cohen MR, Corrado GS, Newsome WT, Clark AM, Hosseini P, Scott BB, Bradley DC, Smith MA, Kohn A, Movshon JA, Armstrong KM, Moore T, Chang SW, Snyder LH, Lisberger SG, Priebe NJ, Finn IM, Ferster D, Ryu SI, Santhanam G, Sahani M, Shenoy KV. Stimulus onset quenches neural variability: a widespread cortical phenomenon. Nat Neurosci. 2010;13:369–378. doi: 10.1038/nn.2501. [DOI] [PMC free article] [PubMed] [Google Scholar]
- Dan Y, Atick JJ, Reid RC. Efficient coding of natural scenes in the lateral geniculate nucleus: experimental test of a computational theory. J Neurosci. 1996;16:3351–3362. doi: 10.1523/JNEUROSCI.16-10-03351.1996. [DOI] [PMC free article] [PubMed] [Google Scholar]
- Dayan P, Abbott LF. Theoretical neuroscience. Cambridge, MA: Massachusetts Institute of Technology; 2001. [Google Scholar]
- Dichter MA, Ayala GF. Cellular mechanisms of epilepsy: a status report. Science. 1987;237:157–164. doi: 10.1126/science.3037700. [DOI] [PubMed] [Google Scholar]
- Dong DW, Atick JJ. Temporal decorrelation: a theory of lagged and nonlagged responses in the lateral geniculate nucleus. Network. 1995;6:159–178. [Google Scholar]
- Ecker AS, Berens P, Keliris GA, Bethge M, Logothetis NK, Tolias AS. Decorrelated neuronal firing in cortical microcircuits. Science. 2010;327:584–587. doi: 10.1126/science.1179867. [DOI] [PubMed] [Google Scholar]
- Fiser J, Chiu C, Weliky M. Small modulation of ongoing cortical dynamics by sensory input during natural vision. Nature. 2004;431:573–578. doi: 10.1038/nature02907. [DOI] [PubMed] [Google Scholar]
- Garrigan P, Ratliff CP, Klein JM, Sterling P, Brainard DH, Balasubramanian V. Design of a trichromatic cone array. PLoS Comput Biol. 2010;6:e1000677. doi: 10.1371/journal.pcbi.1000677. [DOI] [PMC free article] [PubMed] [Google Scholar]
- Gireesh ED, Plenz D. Neuronal avalanches organize as nested theta- and beta/gamma-oscillations during development of cortical layer 2/3. Proc Natl Acad Sci U S A. 2008;105:7576–7581. doi: 10.1073/pnas.0800537105. [DOI] [PMC free article] [PubMed] [Google Scholar]
- Greenfield E, Lecar H. Mutual information in a dilute, asymmetric neural network model. Phys Rev E Stat Nonlin Soft Matter Phys. 2001;63 doi: 10.1103/PhysRevE.63.041905. 041905. [DOI] [PubMed] [Google Scholar]
- Haldeman C, Beggs JM. Critical branching captures activity in living neural networks and maximizes the number of metastable states. Phys Rev Lett. 2005;94 doi: 10.1103/PhysRevLett.94.058101. 058101. [DOI] [PubMed] [Google Scholar]
- Han F, Caporale N, Dan Y. Reverberation of recent visual experience in spontaneous cortical waves. Neuron. 2008;60:321–327. doi: 10.1016/j.neuron.2008.08.026. [DOI] [PMC free article] [PubMed] [Google Scholar]
- Jacobs AL, Fridman G, Douglas RM, Alam NM, Latham PE, Prusky GT, Nirenberg S. Ruling out and ruling in neural codes. Proc Natl Acad Sci U S A. 2009;106:5936–5941. doi: 10.1073/pnas.0900573106. [DOI] [PMC free article] [PubMed] [Google Scholar]
- Jaynes ET. Information theory and statistical mechanics. Phys Rev. 1957;106:62–79. [Google Scholar]
- Jensen HJ. Cambridge, UK: Cambridge UP; 1998. Self-organized criticality: emergent complex behavior in physical and biological systems. [Google Scholar]
- Ji D, Wilson MA. Coordinated memory replay in the visual cortex and hippocampus during sleep. Nat Neurosci. 2007;10:100–107. doi: 10.1038/nn1825. [DOI] [PubMed] [Google Scholar]
- Kenet T, Bibitchkov D, Tsodyks M, Grinvald A, Arieli A. Spontaneously emerging cortical representations of visual attributes. Nature. 2003;425:954–956. doi: 10.1038/nature02078. [DOI] [PubMed] [Google Scholar]
- Kinouchi O, Copelli M. Optimal dynamical range of excitable networks at criticality. Nat Phys. 2006;2:348–351. [Google Scholar]
- Laughlin S. A simple coding procedure enhances a neuron's information capacity. Z Naturforsch. 1981;36:910–912. [PubMed] [Google Scholar]
- Li Z. A theory of the visual motion coding in the primary visual cortex. Neural Comput. 1996;8:705–730. doi: 10.1162/neco.1996.8.4.705. [DOI] [PubMed] [Google Scholar]
- Luczak A, Barthó P, Harris KD. Spontaneous events outline the realm of possible sensory responses in neocortical populations. Neuron. 2009;62:413–425. doi: 10.1016/j.neuron.2009.03.014. [DOI] [PMC free article] [PubMed] [Google Scholar]
- Magri C, Whittingstall K, Singh V, Logothetis NK, Panzeri S. A toolbox for the fast information analysis of multiple-site LFP, EEG and spike train recordings. BMC Neurosci. 2009;10:81. doi: 10.1186/1471-2202-10-81. [DOI] [PMC free article] [PubMed] [Google Scholar]
- Okun M, Lampl I. Instantaneous correlation of excitation and inhibition during ongoing and sensory-evoked activities. Nat Neurosci. 2008;11:535–537. doi: 10.1038/nn.2105. [DOI] [PubMed] [Google Scholar]
- Petermann T, Thiagarajan TC, Lebedev MA, Nicolelis MA, Chialvo DR, Plenz D. Spontaneous cortical activity in awake monkeys composed of neuronal avalanches. Proc Natl Acad Sci U S A. 2009;106:15921–15926. doi: 10.1073/pnas.0904089106. [DOI] [PMC free article] [PubMed] [Google Scholar]
- Pola G, Thiele A, Hoffmann KP, Panzeri S. An exact method to quantify the information transmitted by different mechanisms of correlational coding. Network. 2003;14:35–60. doi: 10.1088/0954-898x/14/1/303. [DOI] [PubMed] [Google Scholar]
- Quian Quiroga R, Panzeri S. Extracting information from neuronal populations: information theory and decoding approaches. Nat Rev Neurosci. 2009;10:173–185. doi: 10.1038/nrn2578. [DOI] [PubMed] [Google Scholar]
- Ramo P, Kauffman S, Kesselia J, Yli-Harja O. Measures for information propagation in Boolean networks. Physica D. 2007;227:100–104. [Google Scholar]
- Renart A, de la Rocha J, Bartho P, Hollender L, Parga N, Reyes A, Harris KD. The asynchronous state in cortical circuits. Science. 2010;327:587–590. doi: 10.1126/science.1179850. [DOI] [PMC free article] [PubMed] [Google Scholar]
- Rieke F, Warland D, de Ruyter van Stevenick R, Bialek W. Spikes. Cambridge, MA: Massachusetts Institute of Technology; 1997. [Google Scholar]
- Roudi Y, Latham PE. A balanced memory network. PLoS Comput Biol. 2007;3:1679–1700. doi: 10.1371/journal.pcbi.0030141. [DOI] [PMC free article] [PubMed] [Google Scholar]
- Schneidman E, Bialek W, Berry MJ., 2nd Synergy, redundancy, and independence in population codes. J Neurosci. 2003;23:11539–11553. doi: 10.1523/JNEUROSCI.23-37-11539.2003. [DOI] [PMC free article] [PubMed] [Google Scholar]
- Schneidman E, Berry MJ, 2nd, Segev R, Bialek W. Weak pairwise correlations imply strongly correlated network states in a neural population. Nature. 2006;440:1007–1012. doi: 10.1038/nature04701. [DOI] [PMC free article] [PubMed] [Google Scholar]
- Shadlen MN, Newsome WT. The variable discharge of cortical neurons: implications for connectivity, computation, and information coding. J Neurosci. 1998;18:3870–3896. doi: 10.1523/JNEUROSCI.18-10-03870.1998. [DOI] [PMC free article] [PubMed] [Google Scholar]
- Shannon CE. A mathematical theory of communication. Bell System Technical J. 1948;27:379–423. [Google Scholar]
- Shew WL, Yang H, Petermann T, Roy R, Plenz D. Neuronal avalanches imply maximum dynamic range in cortical networks at criticality. J Neurosci. 2009;29:15595–15600. doi: 10.1523/JNEUROSCI.3864-09.2009. [DOI] [PMC free article] [PubMed] [Google Scholar]
- Shu Y, Hasenstaub A, McCormick DA. Turning on and off recurrent balanced cortical activity. Nature. 2003;423:288–293. doi: 10.1038/nature01616. [DOI] [PubMed] [Google Scholar]
- Stanley HE. Introduction to phase transitions and critical phenomena. New York: Oxford UP; 1971. [Google Scholar]
- Stewart CV, Plenz D. Inverted-U profile of dopamine–NMDA-mediated spontaneous avalanche recurrence in superficial layers of rat prefrontal cortex. J Neurosci. 2006;26:8148–8159. doi: 10.1523/JNEUROSCI.0723-06.2006. [DOI] [PMC free article] [PubMed] [Google Scholar]
- Sussillo D, Abbott LF. Generating coherent patterns of activity from chaotic neural networks. Neuron. 2009;63:544–557. doi: 10.1016/j.neuron.2009.07.018. [DOI] [PMC free article] [PubMed] [Google Scholar]
- Tanaka T, Kaneko T, Aoyagi T. Recurrent infomax generates cell assemblies, neuronal avalanches, and simple cell-like selectivity. Neural Comput. 2009;21:1038–1067. doi: 10.1162/neco.2008.03-08-727. [DOI] [PubMed] [Google Scholar]
- van Vreeswijk C, Sompolinsky H. Chaos in neuronal networks with balanced excitatory and inhibitory activity. Science. 1996;274:1724–1726. doi: 10.1126/science.274.5293.1724. [DOI] [PubMed] [Google Scholar]