


Abstract
Mechanistic understanding of many key cellular processes often involves identification of RNA binding proteins (RBPs) and RNA binding sites in two separate steps. Here, they are predicted simultaneously by structural alignment to known protein–RNA complex structures followed by binding assessment with a DFIRE-based statistical energy function. This method achieves 98% accuracy and 91% precision for predicting RBPs and 93% accuracy and 78% precision for predicting RNA-binding amino-acid residues for a large benchmark of 212 RNA binding and 6761 non-RNA binding domains (leave-one-out cross-validation). Additional tests revealed that the method makes no false positive prediction from 311 DNA binding domains but correctly detects six domains binding with both DNA and RNA. In addition, it correctly identified 31 of 75 unbound RNA-binding domains with 92% accuracy and 65% precision for predicted binding residues and achieved 86% success rate in its application to SCOP RNA binding domain superfamily (Structural Classification Of Proteins). It further predicts 25 targets as RBPs in 2076 structural genomics targets: 20 of 25 predicted ones (80%) are putatively RNA binding. The superior performance over existing methods indicates the importance of dividing structures into domains, using a Z-score to measure relative structural similarity, and a statistical energy function to measure protein–RNA binding affinity.
INTRODUCTION
RNA binding proteins (RBPs) make specific binding with RNAs and play an important role in translation regulation and post-transcriptional processing of pre-mRNA including RNA splicing, editing and polyadenylation (1). Interactions between proteins and RNA influence the structure of RNA and play an critical role in their biogenesis, stability, function, transport and cellular localization. RNA and proteins are stably bound together as ribonucleoprotein (RNP) complexes throughout the journey from synthesis to degradation in a temporal and spatial manner (2). Proteomic studies in human further showed that RBPs are associated with cell cycle checkpoint defects, genomic instability and cancer (3). Thus, a comprehensive, mechanistic understanding of a wide variety of cellular processes requires the identification of RBPs and RNA binding sites.
Identifying RBPs and binding residues is often treated as two separate problems. Several classifiers dedicated for predicting RBPs are developed by employing support-vector machines (SVM) (4–7). In some studies (4,5), homologous sequences were not excluded from training or testing. Performance for most methods was not measured by standard measure of a receiver-operating characteristic (ROC) curve or the Matthews Correlation Coefficient (MCC). The only reported MCC value for RBP classification is 0.53 for a sequence-based SVM classifier (5-fold cross-validation on 134 RNA binding and 134 non-binding proteins) (8) and 0.72 for a structure- based SVM classifier for a dataset of 76 RNA binding proteins and 246 non-nucleic acid binding proteins (leave-one-out test) (9). The latter, however, is unable to distinguish RNA binding from DNA binding proteins.
Separately, RNA-binding residues are predicted by employing sequence-based (8,10–17) and structure-based (9,18–22) information. Sequence-based predictors have employed a number of machine-learning or statistical techniques such as neural-network (10), SVM (8,11,14–17), and a naive Bayes classifier (12,13). Structure-based predictions, on the other hands, relied on patches built on electrostatics, evolution and geometric information (9,18), accessible surface and contact network topology based on SVM and naive Bayes classifiers (19), linear-regression analysis of structural neighboring information combined with sequence profiles (20), secondary structure, solvent accessibility, sidechain environment, interaction propensity and other features with a random forest method (21), and a simple propensity-based technique (22). The best reported MCC values are between 0.47 and 0.51 (8,20,21) for sequence and structure-based techniques.
One issue facing binding-site prediction is that it will predict RNA binding sites even for the proteins that do not bind RNA. In this work, we will predict RBPs and RNA binding sites within a single method. This method is based on a recently developed approach (23,24) that was successfully employed for identifying DNA binding proteins and binding sites. In this approach, protein structures in known protein–DNA complex structures are employed as templates and structurally aligned to the target protein structure. If structural similarity between the target structure and a template is observed, the predicted protein–DNA binding complex structure is confirmed by the prediction of protein–DNA binding affinity.
Here, we will extend this structure-based approach by developing a distance-dependent knowledge-based energy function for protein–RNA interactions. Only a few knowledge-based energy functions for protein–RNA interactions have been developed so far (25,26). Here, we will build the statistical energy function based on a distance-scaled, finite, ideal gas reference (DFIRE) state, initially developed for proteins (27–29) and subsequently extended to protein–DNA interactions (24,30,31). This new energy function, together with a measure of relative structural similarity by Z-score makes an accurate domain-based prediction of RBPs and binding residues. The Mathews correlation coefficients for RNA binding domains and RNA binding residues are 0.56 and 0.72, respectively, for the largest benchmark developed so far (212 RNA binding and 6761 non-RNA binding domains). The new technique is further validated on 311 DNA binding domains (negatives), 75 unbound APO structures (positives) and SCOP RNA binding domain superfamily (32), and applied to uncover RBPs from structural genomics targets.
METHODS
Datasets
RB250: Template library of RNA-binding domains
A template library was built by querying the PDB (July 2009 release) to retrieve all protein-RNA complex structures determined by X-ray (resolution better than 3.0 Å). The resulting 419 complex structures were split into chains and the chains are further divided into domains by using an automatic domain parser program called DDOMAIN (33) [with the parameter set that mimics SCOP annotation (32)]. These domains were further clustered with a sequence-identity cutoff of 95% with BLASTClust (34). One representative was randomly selected from each cluster. There is a total of 250 representative domain structures with at least 40 amino acids long and at least 5 residues contacting with 5 or more RNA bases. A protein residue and a RNA base are considered in contact if the shortest distance between any pair of heavy atoms from them is within 4.5 Å. These representative structures (RB250) form the template library for predicting RNA-binding proteins and binding sites.
RB212: Non-redundant RNA binding domains
We further obtain a non-redundant RNA binding domains by using BLASTClust (34) at a 25% sequence identity cutoff. There is a total of 212 domains (the RB212 set).
NB6761: Non-RNA binding data set
A non-redundant set of 8770 protein structures was obtained by using PISCES (35) with a 30% global sequence identity cutoff, a resolution better than 3 Å and a chain length cutoff of 40 amino acid residues. We removed those chains whose function is associated with RNA-binding and whose PDB records contain the key words ‘RIBOSOMAL’, ‘UNKNOWN FUNCTION’ and ‘RNA’ by searching in the title. The remaining 6699 chains were divided into domains with DDOMAIN (33) and clustered with a sequence identity cutoff 25% by BLASTClust (34). One representative was randomly selected from each cluster. The final dataset contains 6761 protein domains that do not binding RNA (NB6761). We emphasize that DNA binding proteins are not excluded from this dataset.
APO75/HOLO75 dataset
To examine the effect of binding induced conformational changes on the accuracy of predicting RBPs, we established a dataset with both bound (HOLO) and unbound (APO) structures. We started with the set of bound structures (RB250) and performed BLAST (34) search for the sequences homologous to the sequences in RB250. We selected those homologous sequences whose protein structures do not contain RNA. These unbound APO structures are partitioned into domains by using the DDOMAIN program (33). An all-against-all sequence alignment between the APO domain set and the HOLO domain set from RB250 was performed by employing the ALIGN0 program from the FASTA2 package (36). The alignment yielded 869 pairs with sequence identity above 45% that are further culled by excluding redundant sequences with an identity cutoff of 30% and removing the structure with lower resolution. The final set contains 75 APO domains whose sequence identity ranges from 45% to 100% to their corresponding HOLO domains. The majority (56 out of 75 pairs) are more than 85% sequence identity. The APO and their corresponding HOLO domain sets are labeled as APO75 and HOLO75, respectively.
DB311: DNA-binding protein database
To examine the ability to distinguish RNA and DNA binding proteins, we also obtained a DNA binding protein dataset of 250 DNA binding structures (24). These DNA binding structures were divided into domains by DDOMAIN and clustered by BLASTClust (34) sets. The clustered domains were further reduced with a sequence identity cutoff of 25% to produce the final dataset of 311 DNA binding domains (DB311).
RBD292: RNA binding domain superfamily
The dataset is obtained from SCOP superfamily database. RBD superfamily is divided into five families: canonical, non-canonical, splicing factor U2AF subunits, Smg-4/UPF3 and GUCT, which contain 171 PDB, 4 PDB, 1 PDB and 1 PDB, respectively. These PDBs are split into chains and then divided into 292 domains. The canonical RRM family has 280 domains, the non-canonical family has nine domains, and the remaining three domains are splicing factor U2AF subunits, smg-4/UPF3, and GUCT families, respectively.
SG2076: Structural genomics targets
A set of 2076 domains is obtained from previously collected 2235 structural genomics targets (24) by domain parsing (DDOMAIN) and clustering (BLASTClust) with a sequence identity cutoff of 30%.
Knowledge-based energy function
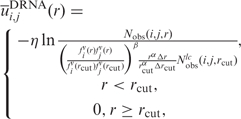
We employed exactly the same volume-fraction corrected DFIRE energy function that generated DDNA3 (24) to produce an DRNA energy function for protein–RNA interaction  .
.
 |
(1) |
where the volume-fraction factor 
 , Nobs(i, j, r) is the number of pairs of atoms i and j within the spherical shell at distance r observed in a given structure database, rcut is the interaction cutoff distance, Δrcut is the bin width at rcut, the value of α (1.61) was determined by the best fit of rα to the actual distance-dependent number of ideal-gas points in finite protein-size spheres (27), the exact value of β for volume correction (0.5) was employed. We employ residue/base-specific atom types with a total 253 atom types (167 for protein and 86 for RNA). We cutoff interactions at 15 Å (rcut) with a bin width of 0.5 Å(Δr) as for the protein–DNA interaction (24). We also set the factor η arbitrarily to 0.01 to control the magnitude of the energy score. The RB250 set was used to train the statistical energy function [i.e. to calculate Nobs (i, j, r)]. To avoid overfitting, we employed the leave-one-out scheme to train multiple statistical energy functions for different targets. For each target, we exclude all template proteins whose sequence identity to the target protein is >30%.
Prediction protocol
The protocol for predicting RBPs and binding sites is as follows. First, the target structure is scanned against those templates with sequence identity <30% in the template library (RB250) by using the structural alignment program TM-align (37). If the structural similarity score is higher than a threshold, the protein–RNA complex structure is predicted by replacing the template structure with the aligned target structure. Two structural similarity scores are employed: one is based on the raw TM-Score and the other one is based on Z-score (see ‘Results’ section). If the lowest binding energy between the target protein and template RNA is lower than a threshold and the structure similarity is higher than a threshold, the target is predicted as a RBP and its RNA binding site can be predicted from the predicted protein–RNA complex structure. If no matching template is found to satisfy these two thresholds, this target is predicted as a non-RNA binding protein.
Performance evaluation
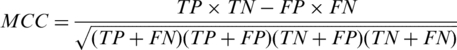
The performance of the proposed method is measured by sensitivity [SN = TP/(TP + FN)], specificity [SP = TN/(TN + FP)], accuracy [AC = (TP + TN)/(TP + FN + TN + FP)] and precision [PR = TP/(TP + FP)]. In addition, we calculate a MCC given by
 |
(2) |
Here TP, TN, FP and FN refer to true positives, true negatives, false positives and false negatives, respectively. This performance measure is applied to both binding-protein prediction and binding-residue prediction.
RESULTS
Using structural similarity measured by TM-Score for discrimination
We first examine the ability of the structural similarity measured by TM-Score from TM-align (37) for discriminating RBPs from non-binding proteins. TM-Score is 1 for 100% structural similarity and around 0.2 between two random protein structures. Figure 1 shows the fraction of the target domains (binding or non-binding proteins) as a function of the highest TM-Score from its alignment to the templates in the RB250 set, generated by the leave-one-out scheme. Forty-eight percent binding targets (from RB212) but only 14% non-binding targets (from NB6761) have a TM-Score of more than 0.5 with at least one binding template. When the threshold of TM-Score is 0.58, 40% binding targets but only 3% non-binding targets have a hit to a binding template. Increasing the TM-Score threshold further reduces the fraction of non-RNA-binding domains relative to that of RNA binding domains. However, the highest MCC value is only 0.29 at the TM-Score threshold of 0.72. Thus, the structural similarity based on TM-Score alone has a weak ability to discriminate RBPs from non-binding proteins.
Figure 1.

Distribution of the top TM-Score-ranked templates on RB212/NB6761.
Using relative structural similarity measured by Z-score for discrimination
The structural similarity measured by TM-Score between two protein domains with significantly different sizes is normalized by the average size. This structural similarity is unrealistically small when the smaller target has a nearly perfect match to only a small portion of the larger template (the binding region). To help remediate this situation, we introduce a relative structural similarity based on Z-score. For a given target whose TM-Score is greater than 0.4 with a binding template, the Z-score of this target is defined as follows:
| (3) |
where TMqT is the structural similarity TM-Score between the query q and a RNA binding template T, TMiT is the structural similarity score between the template T and a reference structure i, n is the number of reference structures, and σT are the standard deviation of TMiT. Here, we use the mixed binding and non-binding proteins (RB250 and NB6761 excluding homologous templates) as the reference structures and choose only 10% top ranked TM-Scores (n = 701) (see ‘Discussion’ section) and exclude the structure pairs whose TM-scores are higher than 0.7 to avoid noises from either irrelevant structures or highly similar structures. TMiT and σT for each binding template can be pre-calculated and stored. We further modified the definition of Z-score to reduce the effect of TM-Score fluctuation.
Figure 2 displays the fraction of target structures as a function of the highest Z-score from its structural alignment to binding templates. Forty-two percent binding targets (from RB212) but only 2.5% non-binding targets (from NB6761) have a Z-score of more than 1 with at least one binding template. When the Z-score threshold is 2, 20% binding targets but only 0.01% (11) non-binding targets have a hit to a binding template. Increasing the Z-score threshold further reduces the fraction of non-RNA binding domains relative to that of RNA binding domains. The highest MCC value is 0.48 at the Z-score threshold of 1.4. Thus, the relative structural similarity based on Z-score alone is substantially better than TM-Score to discriminate RBPs from non-binding proteins.
Figure 2.

Distribution of the top Z-score ranked templates on RB212/NB6761.
Combining with the DRNA binding energy score for discrimination
To further improve the discriminative power, we calculate the DRNA binding energy [Equation (1), see ‘Methods’ section] based on the predicted complex structure generated from structural alignment of the target with the binding template. Using the leave-one-out scheme on RB212/NB6761, we have optimized TM-Score and binding affinity thresholds to achieve the highest MCC value by a simple grid-based search. The grid for TM-Score is 0.01. For the binding affinity threshold, we obtained the lowest energy in all predicted complex structures under different TM-Score thresholds for a given target. These energy values are considered sequentially as the energy threshold. The highest MCC is 0.49 for the TM-Score threshold of 0.60 and the energy threshold of −15.3. The corresponding accuracy, precision and sensitivity are 98%, 77% and 32%, respectively.
Similarly, we can combine Z-score with the DRNA energy score for RNA binding discrimination. With a grid of 0.1 for the Z-score threshold, we found that the highest MCC is 0.57 with the Z-score threshold of 1.2 and the energy threshold of −9.9. The corresponding accuracy, precision, and sensitivity are 98%, 91% and 36%, respectively. It is clear that combining Z-score and binding affinity score substantially improves precision (14%) and sensitivity (4%) without changing the accuracy (98%) over combining TM-Score and binding affinity.
Method comparison
To further benchmark the performance of our approach, the ROC curves given by various methods are shown in Figure 3. PSI-BLAST (34) was performed with four iterations of searching against NCBI non-redundant protein sequence library. A target is identified as a RBP by PSI-BLAST if it has at least one template from RB250 with an E-value higher than a specific threshold (excluding all templates with ≥30% sequence identity to the targets). The highest MCC of PSIBLAST is 0.41 with accuracy 97%, precision 54% and sensitivity 33%. This MCC value is higher than the method based on TM-align but lower than the method based on Z-score alone (0.48). The combination of Z-score with energy is the most effective in detecting RBPs. The combined technique can achieve a reasonable sensitivity at a very low false positive rate.
Figure 3.

Sensitivity verus false positive rate, given by TM-align (cross), PSIBLAST (open triangle), Z-score (open diamond), TM-Score combining with the DRNA energy score (closed circle) and Z-score combining with the DRNA energy score (solid line).
Test on APO75/HOLO75 datasets
The trained method (combined Z-score and binding affinity) is further benchmarked on APO75/HOLO75 datasets. For a given target, any template with sequence identity >30% is excluded from the template library. For a protein solved by NMR with multiple NMR models, it is classified as RNA-binding if anyone of the NMR models satisfies both Z-score and binding affinity thresholds. The number of positive predictions are 31 for the APO set, and 32 for the HOLO set, respectively. These numbers correspond to a sensitivity of 41% for APO75 and 42% for HOLO75, compared with the value of 36% (77/212) observed in RB212. That is, using monomeric unbound structures leads to 1% reduction of sensitivity.
A more detailed analysis on predicted results shows that there is an overlap of 28 predicted positive results between the APO and HOLO sets. These predictions agree mostly because in these cases, RNA binding only leads to minor conformational changes in binding regions. There are 3 correctly predicted HOLO targets but incorrectly predicted APO targets as shown in Table 1. Three APO targets (some even with only small structural changes due to binding) have strong protein–RNA binding (lower than the energy threshold) but with borderline Z-score values (0.98–1.1 versus 1.2, the Z-score threshold). The result suggests the need to further improve structural similarity measure. Furthermore, there are two correctly predicted APO targets but missed by HOLO targets prediction. One target 2bggB2 has Z-score 2.4 much higher than threshold 1.2 but with a borderline energy (−9.8 versus −9.9). Another HOLO target 1ec6A is missed because the best template is excluded as result of its sequence identity between the target and the best template >30%.
Table 1.
Targets are predicted as RNA-binding on HOLO set but not on APO set
| HOLOa | APOb | TMHAc | SeqIDd | TMPe | TMHf | ZHTg | EHh | TMATi | ZATj | EAk |
|---|---|---|---|---|---|---|---|---|---|---|
| 2atwA2 | 1hh2P3 | 0.95 | 47.9 | 2asbA3 | 0.66 | 1.4 | −17.4 | 0.57 | 0.98 | −14.7 |
| 1uvlA | 1hi8B | 0.98 | 96.2 | 2r7xA | 0.43 | 1.2 | −27.9 | 0.42 | 1.1 | −25.9 |
| 2j03S | 1ovyA | 0.56 | 54.3 | 1jj2M | 0.60 | 1.2 | −59.3 | 0.46 | 1.1 | −37.3 |
aTargets from HOLO set.
bTargets from APO set.
cTM-Score between HOLO and APO targets.
dSequence identity between APO and HOLO target calculated by bl2seq in blast2.2.
eTemplate for HOLO target.
fTM-score between template and HOLO target.
gZ-score between HOLO target and template.
hBinding energy of template RNA–HOLO target complex.
iTM-score of APO target and template.
jZ-score of APO target and template.
kBinding energy of template RNA–APO target complex;
Binding site prediction
The predicted binding complexes can be employed to infer the RNA binding residues. We define an amino-acid residue as a RNA binding residue if any heavy atom of that residue is <4.5 Å away from any heavy atom of a RNA base. Predicted binding residues from template-based modeling can be compared to actual binding residues. For 77 predicted RNA-binding proteins from RB212, we achieved 75% in sensitivity, 96% in specificity, 93% in accuracy, 78% in precision, and 0.72 for the MCC value. For predicted HOLO targets, we achieved 56% in sensitivity, 96% in specificity, 92% in accuracy, 65% in precision and 0.56 for the MCC value. For predicted APO targets, we achieved 55% in sensitivity, 97% in specificity, 92% in accuracy, 65% in precision and 0.56 for the MCC value.
Discrimination against DNA-binding proteins
We examine the ability of our method to separate DNA binding from RBPs because they share common structural features (9). We apply our approach to the set of 331 DNA binding domains. Seven out of 331 targets are recognized as RBPs because they are highly homologous (>50%) to the templates in RB250. They are 1r0aA1, 1h38D2, 2o5iC2, 2o5iC1, 2o5iD1, 1zblB and 1qbjB. There are six additional proteins recognized as RBPs as shown in Table 2. Our method correctly identified RNA polymerase II [2nvqB1 and 2nvqB2 (38)], Human RNase H catalytic domain [2qkbA (39)], and DNA/RNA helicase domain [2p6rA1 (40)] as RNA binding proteins. In fact, some of the them were crystallized with RNA and DNA at the same time and involved in the transcription and reverse transcription process, respectively. The comparison between predicted and actual RNA binding residues reveals high accuracy (99% and 89%) with MCC values of 0.66 and 0.64 for 2nvqB1 and 2qkb, respectively. The fifth recognized protein domain is Nuclear factor of activated T-cells (NFAT1, pdb ID# 1p7hN). Although it is not annotated as a RBP, it is a part of the nuclear factors of activated T-cells transcription complex as annotated in the NCBI database. In fact, it binds to specific RNA aptamers (41). The sixth recognized RNA binding domain is poxvirus protein Z-alpha domain [1sfuA (42)]. This poxvirus protein is E3L protein that has a Z-alpha motif similar with ADAR1 (double-stranded RNA adenosine deaminase) which is known to bind with Z-RNA (43,44).
Table 2.
DNA binding proteins predicated as RBPs from the DB311 set
| Target | Template | SeqID (%) | Sens. | Speci. | Acc. | Prec. | MCC |
|---|---|---|---|---|---|---|---|
| 2nvqB1 | 2o5iM | 12.7 | 1.00 | 0.99 | 0.99 | 0.44 | 0.66 |
| 2nvqB2 | 2o5iM | 8.7 | 1.00 | 0.99 | 0.99 | 0.63 | 0.79 |
| 2qkbA | 1zbiB | 15.8 | 0.52 | 0.99 | 0.89 | 0.94 | 0.64 |
| 2p6rA1 | 2db3A | 15.6 | – | – | – | – | – |
| 1p7hN | 1ooaA1 | 22.4 | – | – | – | – | – |
| 1sfuA | 2gxbB | 27.1 | – | – | – | – | – |
As an example, Figure 4 compares the predicted RNA binding site with two separate native RNA and DNA binding sites for the target domain in chain B of DNA-directed RNA polymerase II (pdb #2nvqB1). Despite its low sequence identity to the template 2o5iM (13%), RNA binding region of RNA polymerase II is successfully predicted with close to 100% accuracy and sensitivity.
Figure 4.

The native binding regions of DNA (in orange) and RNA (in red) of the target domain 1 of Chain B (PDB ID#2nvqB1) is compared to the predicted RNA binding region (in green) as well as the corresponding RNA binding region of the template (2o5iM) (in green, all binding region in blue). The native RNA binding region of the target is completely overlapped with the predicted region (red is a part of green). For clarity, residue index of >1000 for 2o5i is not shown.
Application to SCOP RNA binding domain superfamily
RBD (RNA binding domain) is the most abundant RNA binding domain in eukaryotes (45). For this domain, the mode of protein and RNA interaction is variable. This domain can modulate its fold to recognize many RNAs and proteins to achieve multiple biological function (46). The RBD dataset was built to test the performance of our method on annotation of RBPs of RBD superfamily (See ‘Methods’ section). The trained thresholds (Z-score 1.2 and energy −9.9) was used. The majority of canonical family (248/290) are correctly predicted as RNA binding. The other domains such as Splicing factor U2AF subunits, Smg-4/UPF3 and GUCT are also predicted correctly. It, however, does not recognize any of nine non-canonical RBD proteins (four are true positives and five are true negatives). The five true negatives are leucine-rich repeat domains (LRR), which is required in cis to the RNP domains for CTE RNA binding (47,48). Failure to recognize any true positive structures in the non-canonical family (4/9) is due to lack of a corresponding similar template structure in our template database.
Application to structural genomics targets
We further applied this method to 2076 structural genomics domains of unknown function. Based on the same thresholds (Z-score of 1.2 and energy of −9.9) that yielded the highest MCC on the leave-one-out benchmark test of RB212/NB6761, we predict a total of 25 targets as RNA-binding proteins (Table 3). Among them, 20 out of 25 (80%) targets are putative RNA-binding proteins according to NCBI annotations. One target 1x40A has phosphorylation site and the putative function related with protein binding. The function of the remaining four proteins is unknown. Because there are 52 targets annotated as putative RNA binding by the NCBI database, the sensitivity of our method for this application is 38% (20/52), consistent with other test sets.
Table 3.
Structural genomics targets (SG2076) predicated as RBPs
| Target | Template | TM-score | Z-score | Energy | Function |
|---|---|---|---|---|---|
| 1vhyA1 | 2rfkA2 | 0.56 | 1.5 | −14.0 | RBa |
| 1nnhA | 1asyA2 | 0.78 | 2.8 | −13.5 | RB |
| 1nzjA | 1gaxA1 | 0.49 | 1.2 | −16.8 | RB |
| 2oceA5 | 2ix1A4 | 0.65 | 1.4 | −12.2 | UKb |
| 2f96A | 2a1rB | 0.57 | 1.4 | −13.5 | RB |
| 2cphA | 1fxlA2 | 0.70 | 1.3 | −17.9 | RB |
| 3cymA1 | 2a1rB | 0.56 | 1.3 | −11.9 | RB |
| 1tuaA1 | 1ec6A | 0.68 | 1.4 | −11.5 | RB |
| 2q07A2 | 1r3eA2 | 0.67 | 2.1 | −10.9 | RB |
| 1yvcA | 2bh2A1 | 0.72 | 1.8 | −13.5 | RB |
| 1t5yA2 | 1r3eA2 | 0.77 | 2.8 | −15.3 | RB |
| 3go5A2 | 2ix1A4 | 0.68 | 1.5 | −13.7 | RB |
| 2k52A | 2ix1A4 | 0.63 | 1.3 | −12.4 | RB |
| 1zkpA | 2fk6A | 0.78 | 2.3 | −15.9 | RB |
| 1x40A | 2f8kA | 0.62 | 1.3 | −10.8 | UBc |
| 2ogkD | 1jj2D | 0.62 | 1.8 | −25.5 | RB |
| 2cpfA | 1fxlA2 | 0.74 | 1.5 | −12.0 | RB |
| 1yezA | 2bh2A1 | 0.69 | 1.6 | −14.9 | RB |
| 2e5hA | 1fxlA2 | 0.74 | 1.5 | −13.3 | RB |
| 3frnA3 | 1jj2J | 0.51 | 1.2 | −20.4 | UK |
| 2jz2A | 1jj2P | 0.59 | 1.3 | −33.5 | UK |
| 3ir9A | 1rlgB | 0.56 | 1.2 | −11.5 | UK |
| 3hp7A1 | 1h3eA2 | 0.63 | 1.4 | −12.5 | RB |
| 1wi6A | 1fxlA2 | 0.70 | 1.3 | −17.6 | RB |
| 1wdtA4 | 1fjgI | 0.55 | 1.4 | −29.7 | RB |
aTargets are annotated as having putative functions related to RNA binding in the NCBI database.
bFunction unknown.
cNon-RNA binding
DISCUSSION
In this study, we developed a new approach to predict RBPs and binding sites simultaneously. This approach is based on a similar, successful approach employed for predicting protein–DNA binding proteins with structural alignment to known complex structures followed by evaluation of binding affinity (23,24). The main distinction in this paper is the employment of Z-score, rather than TM-Score to measure structural similarity and development of a statistical energy function for protein–RNA interaction based on a volume-fraction-corrected DFIRE reference state (24). The proposed technique is able to identify RBPs with low-sequence homology (<30% sequence identity) but have high-structural similarity in binding regions to known RBPs. More importantly, the majority of HOLO structures (28 in 32) detected for RNA binding continues to be classified as RNA-binding when APO structures are employed. In particular, the method is capable of separating DNA binding proteins from the proteins that bind both DNA and RNA. Furthermore, its successful application to RNA binding domain superfamily (86% success rate) and structural genomics targets (20 out of 25 predictions are annotated as putative RNA binding proteins) confirms the usefulness of the proposed method.
The employment of Z-score, rather than TM-Score, to measure structural similarity is because the TM-Score for aligning two protein structures with significantly different sizes strongly depends on how the TM-Score is normalized. Z-score provides a simple way of removing size dependence through a normalization of standard deviation of TM-Scores against reference structures of mixing RNA binding and non-binding proteins. Z-score alone yields a respectable MCC value of 0.48 and its combination with the DRNA energy function leads to the MCC value of 0.57. By comparison, TM-Score alone only achieves a MCC value of 0.29. We have chosen 10% top-ranked TM-Scores (701 values from RB250+NB6761 excluding homologous templates) and remove the TM-scores larger than 0.7 to calculate average and standard deviation of TM-Score for a given template. This was an optimized value in order to reduce noises from irrelevant random reference structures and highly similar structures. The MCC value reduces to 0.52 if all structures (RB212+NB6761) are employed as reference structures in calculating Z-score.
Another change in RNA-binding protein prediction from DNA binding protein prediction is the use of binding domains as templates. We found that if whole chains are employed as templates and targets (i.e. the datasets of RB176 and NB5667), the highest MCC values are 0.39 for the combined use of TM-Score and DRNA energy score and 0.47 for the combined use of Z-score and DRNA energy score. The latter has an accuracy of 98%, a precision of 87% and a sensitivity of 26%. Compared to the domain-based prediction, the employment of domains leads to 10% improvement in sensitivity and 4% in precision without changing accuracy. This result is consistent with the fact that other methods such as phylogenic analysis and protein modeling work best for single domains (49).
It is difficult to make an exact comparison with existing machine-learning-based techniques because we have used a significantly large database of non RBPs for training and leave-one-out cross-validation. This mimics the realistic situation that RBPs are only a small fraction of all proteins. Existing machine-learning techniques are typically trained on equal or similar number of RNA binding and non-binding proteins. It is possible that these methods would have substantially higher false positive rates when they were applied to a significantly larger set of non-binding proteins most of which are unseen by machine-learning techniques. Nevertheless, we have achieved a comparable MCC value of 0.57 with the largest non-redundant set of 212 RBPs and 6761 non-binding proteins (including DNA binding ones), compared to 0.53 for a sequence-based classifier (5-fold cross-validation on 134 RNA-binding and 134 non-RNA binding proteins) (8) and 0.72 for structure-based classifier for a database of 76 RNA binding proteins and 246 non-nucleic acid binding proteins, leave-one-out test) but the latter is unable to separate RNA from DNA binding proteins (9).
One advantage of the proposed structure-based method is simultaneous prediction of protein–RNA complex structures. The predicted complex structures allow prediction of RNA binding residues. High specificity and accuracy (>90%) are achieved for binding residue prediction even for the APO structures. Our MCC values for binding site prediction range from 0.72 for leave-one-out cross-validation, to 0.56 for HOLO targets and 0.56 for APO targets. These results can be compared to the best reported MCC values between 0.47 and 0.51 for sequence and structure-based binding site prediction (8,20,21).
One potential concern is insufficient statistics due to the small number of complex structures for deriving the DRNA energy function. However, a smaller dataset of 179 protein–DNA complexes was employed for obtaining the DDNA3 energy function for protein–DNA interaction and its robustness is found via various tests (24). Here, we have addressed this question by employing the leave-one-out (for NB212 sets) technique. The consistency between the leave-one-out and APO/HOLO test sets provides the confidence about the energy function obtained.
One possible way to improve our prediction is to introduce an energy threshold that is dependent on structural similarity threshold because one expects that the binding-energy requirement should be stronger for less similar structures but weaker for highly similar structures between template and query. Previously, it was found that introducing a TM-Score dependent energy threshold makes significant and consistent improvement in predicting DNA binding proteins (23,24). Here, we found that introducing TM-Score-dependent energy threshold does lead to an increase of the MCC value from 0.49 to 0.52. However, an Z-score-dependent energy threshold leads to no significant change (0.5690 versus 0.5694). Thus, we employed two independent (Z-score and energy) thresholds only in this work.
The success of our proposed technique is limited by the availability of protein–RNA complexes as templates. It cannot predict RBPs with novel structures or binding modes that are not included in the template library. We have used DB250 based on 90% sequence-identity cutoff as template library for the purpose of maximizing available templates. The low sensitivity (36–42%) in various tests is likely in part due to lack of structurally matching templates. On the other hand, binding induced conformational changes suggest that the rigid-body approximation employed here likely has limited the performance of DRNA to discriminate the binding from non-binding proteins. How to improve our method by incorporating protein flexibility is a challenging problem to be addressed.
Compared to our corresponding method for DNA binding proteins, the present work indicates that RBPs are more difficult to predict. In particular, sensitivity is more than 50% for predicting DNA binding proteins, compared to about 36% for RBPs. This is likely due to highly flexible and diverse RNA structures (50), compared to DNA structures. More diverse RNA structures will lead to more diverse protein structures to bind them. The latter will be more difficult to detect by structural alignment to a limited number of existing RNA binding template structures that is similar to the number of available template structures for protein-DNA interactions.
Finally, the method is available in the SPOT package (Structure-based function-Prediction On-line Tools) at http://sparks.informatics.iupui.edu/spot.
FUNDING
Funding for open access charge: National Institutes of Health (grant R01 GM 085003).
Conflict of interest statement. None declared.
REFERENCES
- 1.Glisovic T, Bachorik JL, Yong J, Dreyfuss G. RNA-binding proteins and post-transcriptional gene regulation. FEBS Lett. 2008;582:1977–1986. doi: 10.1016/j.febslet.2008.03.004. [DOI] [PMC free article] [PubMed] [Google Scholar]
- 2.Moore MJ. From birth to death: the complex lives of eukaryotic mRNAs. Science. 2005;309:1514–1518. doi: 10.1126/science.1111443. [DOI] [PubMed] [Google Scholar]
- 3.Lukong KE, Chang KW, Khandjian EW, Richard S. RNA-binding proteins in human genetic disease. Trends Genet. 2008;24:416–425. doi: 10.1016/j.tig.2008.05.004. [DOI] [PubMed] [Google Scholar]
- 4.Cai YD, Lin SL. Support vector machines for predicting rRNA-, RNA-, and DNA-binding proteins from amino acid sequence. Biochim. Biophis. Acta-Proteins Proteomics. 2003;1648:127–133. doi: 10.1016/s1570-9639(03)00112-2. [DOI] [PubMed] [Google Scholar]
- 5.Han LY, Cai CZ, Lo SL, Chung MCM, Chen YZ. Prediction of RNA-binding proteins from primary sequence by a support vector machine approach. RNA. 2004;10:355–368. doi: 10.1261/rna.5890304. [DOI] [PMC free article] [PubMed] [Google Scholar]
- 6.Yu X, Cao J, Cai Y, Shi T, Li Y. Predicting rRNA-, RNA-, and DNA-binding proteins from primary structure with support vector machines. J. Theor. Biol. 2006;240:175–184. doi: 10.1016/j.jtbi.2005.09.018. [DOI] [PubMed] [Google Scholar]
- 7.Shao X, Tian Y, Wu L, Wang Y, Jing L, Deng N. Predicting DNA- and RNA-binding proteins from sequences with kernel methods. J. Thor. Biol. 2009;258:289–293. doi: 10.1016/j.jtbi.2009.01.024. [DOI] [PubMed] [Google Scholar]
- 8.Spriggs RV, Murakami Y, Nakamura H, Jones S. Protein function annotation from sequence: prediction of residues interacting with RNA. Bioinformatics. 2009;25:1492–1497. doi: 10.1093/bioinformatics/btp257. [DOI] [PubMed] [Google Scholar]
- 9.Shazman S, Mandel-Gutfreund Y. Classifying RNA-binding proteins based on electrostatic properties. PLoS Comput. Biol. 2008;4:e1000146. doi: 10.1371/journal.pcbi.1000146. [DOI] [PMC free article] [PubMed] [Google Scholar]
- 10.Jeong E, Chung I, Miyano S. A neural network method for identification of RNA-interacting residues in protein. Genome Inform. 2004;15:105–116. [PubMed] [Google Scholar]
- 11.Wang L, Brown SJ. BindN: a web-based tool for efficient prediction of DNA and RNA binding sites in amino acid sequences. Nucleic Acids Res. 2006;34:W243–W248. doi: 10.1093/nar/gkl298. [DOI] [PMC free article] [PubMed] [Google Scholar]
- 12.Terribilini M, Lee J-H, Yan C, Jernigan RL, Honavar V, Dobbs D. Prediction of RNA binding sites in proteins from amino acid sequence. RNA. 2006;12:1450–1462. doi: 10.1261/rna.2197306. [DOI] [PMC free article] [PubMed] [Google Scholar]
- 13.Terribilini M, Sander JD, Lee J-H, Zaback P, Jernigan RL, Honavar V, Dobbs D. RNABindR: a server for analyzing and predicting RNA-binding sites in proteins. Nucleic Acids Res. 2007;35:W578–W584. doi: 10.1093/nar/gkm294. [DOI] [PMC free article] [PubMed] [Google Scholar]
- 14.Wang Y, Xue Z, Shen G, Xu J. PRINTR: prediction of RNA binding sites in proteins using SVM and profiles. Amino Acids. 2008;35:295–302. doi: 10.1007/s00726-007-0634-9. [DOI] [PubMed] [Google Scholar]
- 15.Cheng C-W, Su EC-Y, Hwang J-K, Sung T-Y, Hsu W-L. Predicting RNA-binding sites of proteins using support vector machines and evolutionary information. BMC Bioinformatics. 2008;9:S6. doi: 10.1186/1471-2105-9-S12-S6. [DOI] [PMC free article] [PubMed] [Google Scholar]
- 16.Kumar M, Gromiha AM, Raghava GPS. Prediction of RNA binding sites in a protein using SVM and PSSM profile. Proteins. 2008;71:189–194. doi: 10.1002/prot.21677. [DOI] [PubMed] [Google Scholar]
- 17.Tong J, Jiang P, Lu Z-h. RISP: A web-based server for prediction of RNA-binding sites in proteins. Comput. Methods Programs Biomed. 2008;90:148–153. doi: 10.1016/j.cmpb.2007.12.003. [DOI] [PubMed] [Google Scholar]
- 18.Chen YC, Lim C. Predicting RNA-binding sites from the protein structure based on electrostatics, evolution and geometry. Nucleic Acids Res. 2008;36:e29. doi: 10.1093/nar/gkn008. [DOI] [PMC free article] [PubMed] [Google Scholar]
- 19.Maetschke SR, Yuan Z. Exploiting structural and topological information to improve prediction of RNA-protein binding sites. BMC Bioinformatics. 2009;10:341. doi: 10.1186/1471-2105-10-341. [DOI] [PMC free article] [PubMed] [Google Scholar]
- 20.Li Q, Cao Z, Liu H. Improve the prediction of RNA-binding residues using structural neighbours. Protein Peptide Lett. 2010;17:287–296. doi: 10.2174/092986610790780279. [DOI] [PubMed] [Google Scholar]
- 21.Liu Z-P, Wu L-Y, Wang Y, Zhang X-S, Chen L. Prediction of protein-RNA binding sites by a random forest method with combined features. Bioinformatics. 2010;26:1616–1622. doi: 10.1093/bioinformatics/btq253. [DOI] [PubMed] [Google Scholar]
- 22.Perez-Cano L, Fernandez-Recio J. Optimal Protein-RNA area, OPRA: a propensity-based method to identify RNA-binding sites on proteins. Proteins. 2010;78:25–35. doi: 10.1002/prot.22527. [DOI] [PubMed] [Google Scholar]
- 23.Gao M, Skolnick J. DBD-Hunter: a knowledge-based method for the prediction of DNA-protein interactions. Nucleic Acids Res. 2008;36:3978–3992. doi: 10.1093/nar/gkn332. [DOI] [PMC free article] [PubMed] [Google Scholar]
- 24.Zhao H, Yang Y, Zhou Y. Structure-based prediction of DNA-binding proteins by structural alignment and a volume-fraction corrected DFIRE-based energy function. Bioinformatics. 2010;26:1857–1863. doi: 10.1093/bioinformatics/btq295. [DOI] [PMC free article] [PubMed] [Google Scholar]
- 25.Zheng S, Robertson TA, Varani G. A knowledge-based potential function predicts the specificity and relative binding energy of RNA-binding proteins. FEBS J. 2007;274:6378–6391. doi: 10.1111/j.1742-4658.2007.06155.x. [DOI] [PubMed] [Google Scholar]
- 26.Perez-Cano L, Solernou A, Pons C, Fernandez-Recio J. Structural prediction of protein-RNA interaction by computational docking with propensity-based statistical potentials. Pac. Symp. Biocomput. 2010;15:293–301. doi: 10.1142/9789814295291_0031. [DOI] [PubMed] [Google Scholar]
- 27.Zhou H, Zhou Y. Distance-scaled, finite ideal-gas reference state improves structure-derived potentials of mean force for structure selection and stability prediction. Protein Sci. 2002;11:2714–2726. doi: 10.1110/ps.0217002. [DOI] [PMC free article] [PubMed] [Google Scholar]
- 28.Yang Y, Zhou Y. Ab initio folding of terminal segments with secondary structures reveals the fine difference between two closely related all-atom statistical energy functions. Protein Sci. 2008;17:1212–1219. doi: 10.1110/ps.033480.107. [DOI] [PMC free article] [PubMed] [Google Scholar]
- 29.Yang Y, Zhou Y. Specific interactions for ab initio folding of protein terminal regions with secondary structures. Proteins. 2008;72:793–803. doi: 10.1002/prot.21968. [DOI] [PubMed] [Google Scholar]
- 30.Zhang C, Liu S, Zhu Q, Zhou Y. A knowledge-based energy function for protein-ligand, protein-protein, and protein-DNA complexes. J. Med. Chem. 2005;48:2325–2335. doi: 10.1021/jm049314d. [DOI] [PubMed] [Google Scholar]
- 31.Xu B, Yang Y, Liang H, Zhou Y. An all-atom knowledge-based energy function for protein-DNA threading, docking decoy discrimination, and prediction of transcription-factor binding profiles. Proteins. 2009;76:718–730. doi: 10.1002/prot.22384. [DOI] [PMC free article] [PubMed] [Google Scholar]
- 32.Murzin AG, Brenner SE, Hubbard T, Chothia C. SCOP: a structural classification of proteins database for the investigation of sequences and structures. J. Mol. Biol. 1995;247:536–540. doi: 10.1006/jmbi.1995.0159. [DOI] [PubMed] [Google Scholar]
- 33.Zhou H, Xue B, Zhou Y. DDOMAIN: dividing structures into domains using a normalized domain-domain interaction profile. Protein Sci. 2007;16:947–955. doi: 10.1110/ps.062597307. [DOI] [PMC free article] [PubMed] [Google Scholar]
- 34.Altschul SF, Madden TL, Schäffer AA, Zhang J, Zhang Z, Miller W, Lipman DJ. Gapped BLAST and PSI-BLAST: a new generation of protein database search programs. Nucleic Acid Res. 1997;25:3389–3402. doi: 10.1093/nar/25.17.3389. [DOI] [PMC free article] [PubMed] [Google Scholar]
- 35.Wang G, Dunbrack RL. PISCES: a protein sequence culling server. Bioinformatics. 2003;19:1589–1591. doi: 10.1093/bioinformatics/btg224. [DOI] [PubMed] [Google Scholar]
- 36.Myers EW, Miller W. Optimal alignments in linear space. Comput. Appl. Biosci. 1988;4:11–17. doi: 10.1093/bioinformatics/4.1.11. [DOI] [PubMed] [Google Scholar]
- 37.Zhang Y, Skolnick J. TM-align: a protein structure alignment algorithm based on the TM-score. Nucleic Acids Res. 2005;33:2302–2309. doi: 10.1093/nar/gki524. [DOI] [PMC free article] [PubMed] [Google Scholar]
- 38.Wang D, Bushnell DA, Westover KD, Kaplan CD, Kornberg RD. Structural basis of transcription: role of the trigger loop in substrate specificity and catalysis. Cell. 2006;127:941–954. doi: 10.1016/j.cell.2006.11.023. [DOI] [PMC free article] [PubMed] [Google Scholar]
- 39.Nowotny M, Gaidamakov SA, Ghirlando R, Cerritelli SM, Crouch RJ, Yang W. Structure of human RNase h1 complexed with an RNA/DNA hybrid: insight into HIV reverse transcription. Mol. Cell. 2007;28:264–276. doi: 10.1016/j.molcel.2007.08.015. [DOI] [PubMed] [Google Scholar]
- 40.Kim JL, Morgenstern KA, Griffith JP, Dwyer MD, Thomson JA, Murcko MA, Lin C, Caron PR. Hepatitis C virus NS3 RNA helicase domain with a bound oligonucleotide: the crystal structure provides insights into the mode of unwinding. Structure. 1998;6:89–100. doi: 10.1016/s0969-2126(98)00010-0. [DOI] [PubMed] [Google Scholar]
- 41.Cho J, Lee Y, Shin K, Jeong S, Park J, Lee S. In vitro selection of specific RNA aptamers for the NFAT DNA binding domain. Mol. Cells. 2004;18:17–23. [PubMed] [Google Scholar]
- 42.Ha SC, Lokanath NK, Quyen DV, Wu CA, Lowenhaupt K, Rich A, Kim Y-G, Kim KK. A poxvirus protein forms a complex with left-handed Z-DNA: crystal structure of a Yatapoxvirus Zalpha bound to DNA. Proc. Natl Acad. Sci. USA. 2004;101:14367–14372. doi: 10.1073/pnas.0405586101. [DOI] [PMC free article] [PubMed] [Google Scholar]
- 43.Placido D, Brown BA, Lowenhaupt K, Rich A, Athanasiadis A. A left-handed RNA double helix bound by the Z alpha domain of the RNA-editing enzyme ADAR1. Structure. 2007;15:395–404. doi: 10.1016/j.str.2007.03.001. [DOI] [PMC free article] [PubMed] [Google Scholar]
- 44.Herbert A, Alfken J, Kim YG, Mian IS, Nishikura K, Rich A. A Z-DNA binding domain present in the human editing enzyme, double-stranded RNA adenosine deaminase. Proc. Natl Acad. Sci. USA. 1997;94:8421–8426. doi: 10.1073/pnas.94.16.8421. [DOI] [PMC free article] [PubMed] [Google Scholar]
- 45.Clery A, Blatter M, Allain FH-T. RNA recognition motifs: boring? Not quite. Curr. Opin. Struct. Biol. 2008;18:290–298. doi: 10.1016/j.sbi.2008.04.002. [DOI] [PubMed] [Google Scholar]
- 46.Maris C, Dominguez C, Allain FH-T. The RNA recognition motif, a plastic RNA-binding platform to regulate post-transcriptional gene expression. FEBS J. 2005;272:2118–2131. doi: 10.1111/j.1742-4658.2005.04653.x. [DOI] [PubMed] [Google Scholar]
- 47.Liker E, Fernandez E, Izaurralde E, Conti E. The structure of the mRNA export factor TAP reveals a cis arrangement of a non-canonical RNP domain and an LRR domain. EMBO J. 2000;19:5587–5598. doi: 10.1093/emboj/19.21.5587. [DOI] [PMC free article] [PubMed] [Google Scholar]
- 48.Ho DN, Coburn GA, Kang Y, Cullen BR, Georgiadis MM. The crystal structure and mutational analysis of a novel RNA-binding domain found in the human Tap nuclear mRNA export factor. Proc. Natl Acad. Sci. USA. 2002;99:1888–1893. doi: 10.1073/pnas.042698599. [DOI] [PMC free article] [PubMed] [Google Scholar]
- 49.Ponting CP, Russell RR. Natural history of protein domains. Annu. Rev. Biophys. Biomol. Struct. 2002;31:45–71. doi: 10.1146/annurev.biophys.31.082901.134314. [DOI] [PubMed] [Google Scholar]
- 50.Bonin M, Zhu R, Klaue Y, Oberstrass J, Oesterschulze E, Nellen W. Analysis of RNA flexibility by scanning force spectroscopy. Nucleic Acids Res. 2002;30:e81. doi: 10.1093/nar/gnf080. [DOI] [PMC free article] [PubMed] [Google Scholar]