

Abstract
The glycosylphosphatidylinositol transamidase complex (GPIT) consists of five subunits: PIG-U, PIG-T, GPAA1, PIG-S and GPI8, and is important in attaching GPI anchors to target proteins. On the basis of our previous reports incriminating PIG-U as an oncogene in bladder cancer and PIG-T and GPAA1 as oncogenes in breast cancer, we evaluated the expression pattern of the GPIT subunits in 19 different human cancers at both mRNA and protein levels. In general, our results demonstrate a more frequent expression of GPIT subunits in cancers than in normal. Among the 19 anatomic sites compared; breast, ovary and uterus showed consistent evidence of overexpression of specific GPIT subunits. There was also overexpression of PIG-U and GPI8 in lymphoma. In addition, non-small cell lung carcinoma showed significant overexpression of the GPIT subunits as compared to small cell lung carcinoma and normal lung tissue. Also, deregulation of specific GPIT subunits was seen in various other cancers. Forced overexpression of two GPIT subunits; PIG-S and GPI8 alone or in combination induced increased proliferation and invasion of breast cancer cells. Collectively, our study defines a trend involving the deregulated expression and the functional contribution of the GPIT subunits in various cancers with potential implications in diagnosis, prognosis and therapeutic intervention.
Keywords: GPIT complex, gene expression, cancer
It is estimated that 1% of all eukaryotic proteins or ~10–20% of all membrane proteins are post-translationally modified at their C terminus by glycosylphosphatidylinositol (GPI), a complex glycophospholipid that serves to anchor proteins to the cell surface. Although GPI proteins are functionally diverse, most of them are predicted to serve as receptors, differentiation antigens or membranous enzymes.1 Genes encoding GPI-anchored proteins specify two signal sequences in the primary translation product: an N-terminal signal sequence for ER targeting and a C-terminal sequence that directs the attachment of a GPI anchor. The crucial and the ultimate steps of cleaving the signal sequence and attaching the preassembled GPI anchor are catalyzed by GPI transamidase (GPIT), a multisubunit membrane-bound enzyme.1
The GPIT complex consists of five proteins; in mammals and yeast these are PIG-K (or GPI8)/Gpi8p, GPAA1 (or GAA1)/Gaa1p, PIG-S/Gpi17p, PIG-T/Gpi16p and PIG-U/Gab1p.1 Gaa1p and Gpi8p were the first to be identified as proteins essential for GPI anchor attachment onto proteins,2,3 and were subsequently shown to form a complex.4 Other subunits were identified as they co-immunoprecipitated with the GPI8/Gpi8p–GAA1/Gaa1p complex.5,6 Trypanosomatids such as Trypanosoma brucei, share three subunits with mammalian/yeast GPIT (homologues of GPI8, GAA1 and PIG-T termed TbGPI8, TbGAA1 and bGPI16/PIGT, respectively) but have two novel subunits (TTA1 and TTA2) in lieu of PIG-S and PIG-U.7
We recently found that phosphatidylinositol glycan class U (PIG-U), the human Gab1 orthologue, located on chromosomal band 20q11, is amplified and overexpressed in bladder cancer cell lines and primary tumors and causes malignant transformation in vitro and in vivo.8 GPAA1 located on chromosomal region 8q24, and PIG-T located on chromosomal region 20q13.12, fall in the regions of copy number gain in breast cancer. We recently demonstrated that PIG-T, GPAA1 and PIG-U are overexpressed in both human breast cancer cell lines and tumors and show gain of copy number.9 Further, we reported that PIG-T and GPAA1 induce tumorigenesis and contributes to invasion in human breast cancer.9 Other reports also show that GPAA1 was one of the seven overexpressed genes in both hepatitis B and C virus-positive hepatocellular carcinomas,10 and gene amplification of GPAA1 was significantly associated with poor cellular differentiation and poor prognosis of HCC.11 Thus from these reports it can be speculated that components of the GPIT complex may function either independently or as a functional group of oncogenes in cancer. Also these reports suggest that in addition to their normal function of attaching the GPI anchor to proteins, the components of the GPIT complex seem to have other as yet unknown functions in cancer progression. The other two key members of the GPIT complex, ie GPI8 and PIG-S, are localized on chromosomal regions 1p31.1 and 17p13.2, respectively. GPI8 (PIGK) is presumed to be the catalytic center of the enzyme.12
To date, the expression pattern of the subunits of the GPIT complex remains unknown in most human cancers. In the present study, we aimed to evaluate the expression pattern of the GPIT subunits at both mRNA and protein levels and their functional contribution in a number of different human cancers. We compared the expression status of PIG-U, PIG-T, GPAA1, GPI8 and PIG-S at both the mRNA and protein levels in normal vs cancer tissues from 19 different anatomic sites and also overexpressed GPI8 and PIG-S in a breast cancer cell line. Collectively, our study suggests a trend involving deregulated expression of PIG-U/PIG-T/GPAA1/GPI8/PIG-S in various cancers. Forced overexpression of GPI8 and PIG-S alone or in combination induced increased proliferation and invasion of breast cancer cells. Apparently, the GPI-anchoring process is an increasingly common pathway that can lead to tumorigenesis.
Materials and methods
Microarray Blots, siRNAs and Plasmids
cDNA expression status of PIG-U/PIG-T/GPAA1/GPI8/PIG-S in various cancers was investigated using Cancer Profiling Array II having cDNA spots from 19 different organs comprising 154 tumor and corresponding normal tissues from individual patients (Clontech Laboratories, Mountain View, CA, USA). Full-length cDNAs of PIG-U/PIG-T/GPAA1/GPI8/PIG-S were PCR-amplified, gel-purified and radiolabeled using Amersham megaprime DNA labeling system (GE Healthcare, Piscataway, NJ, USA) and [α-32P]dCTP (PerkinElmer, Boston, MA, USA) according to the user manual. Ubiquitin cDNA was used as control. cDNA membranes were prehybridized and then hybridized overnight at 65°C with radiolabeled cDNA probes in a hybridization bottle containing ExpressHyb Hybridization Solution (Clontech Laboratories),100 mg/ml sheared salmon sperm DNA and 1–2×10⁶ d.p.m./ml labeled probe. cDNA membranes were washed three times with 2× standard saline citrate (SSC), 1% SDS for 30 min, once with 0.2× SSC, 0.5% SDS for 30 min, then rinsed in 2× SSC and exposed. Signal intensities were normalized for individual spots by Ubiquitin expression as per manufacturer’s recommendation. We procured all the siRNA from Dharmacon Inc. (Lafayette, CO, USA). The plasmids pMEEB-HA-PIG-S and pMEEB-GST-GPI8 were kindly provided by Dr Taroh Kinoshita (Osaka University, Japan).
Antibody Generation
Polyclonal antibodies against all five subunits of GPIT complex, ie PIG-U/PIG-T/GPAA1/GPI8/PIG-S, were either custom-synthesized or procured if commercially available. Polyclonal PIG-U antibody was custom-synthesized from Alpha Diagnostic (San Antonio, TX, USA) whereas PIG-S was custom-synthesized from Sigma Genosys (The Woodlands, TX, USA). PIG-T antibody was procured from Orbigen (San Diego, CA, USA), GPAA1 from Proteintech Group Inc. (Chicago, IL, USA) and GPI8 from Abgent (San Diego, CA, USA).
Tissue Microarrays and Immunohistochemical Analyses
High-density multiple organ cancer and normal tissue microarrays (TMAs) were purchased from US Biomax Inc. (Rockville, MD, USA). The array had 500 cores from 15 most common cancer types (20–35 cases/type) along with normal controls (5 cases/type). Also bladder, liver and colon cancer TMAs were immunostained for GPI8 expression. The tissue arrays were deparaffinized in xylene, rehydrated in graded alcohol and transferred to PBS. Thereafter, antigen retrieval was carried out using a microwave in 0.01M citrate buffer, pH 6.0. Endogenous peroxidase activity was blocked by incubating sections in hydrogen peroxide (0.3%, v/v) for 15 min. Nonspecific binding was blocked with 1% (w/v) BSA in PBS for 1 h followed by incubation with anti-PIG-U antibody (1:25), anti-PIG-T antibody (1:50), anti-GPAA1 antibody (1:25), anti-GPI8 antibody (1:25) and anti-PIG-S antibody (1:25) for 16 h at 4°C. The primary antibody was detected using biotinylated secondary antibody and peroxidase-labeled streptavidin complex using Dako LSAB plus kit (Dako, Denmark). The color was developed using the chromogen, diaminobenzidine. Finally, the slides were counterstained with Mayer’s hematoxylin and mounted with DPX mountant. Parallel sections in which the primary antibody was replaced by nonimmune rabbit/mouse IgG of the same isotype were examined to ensure specificity and exclude cross-reactivity between the antibodies and conjugates used (negative control).
All the antibodies showed cytoplasmic immunostaining. The intensity of immunostaining was scored as follows: (0), no detectable immunostaining or basal immunostaining in <10% cells; (+1), mild immunostaining in 10–30% cells; (+2), moderate immunostaining in 30–50% cells and (+3), intense immunostaining in >50% of the cells showing cytoplasmic staining. Immunohistochemical evaluation of the paired liver, bladder and colon samples was performed as described earlier.13
PIG-S/GPI8 Constructs and Transfection
In transfections, SKBR3 cells were transfected with pMEEB-HA-PIG-S and pMEEB-GST-GPI8 plasmids in the presence of the FuGene 6 transfection regent. An empty vector (pMEEB) was also used for mock transfection of SKBR3 cells. Presence of the HA-tagged PIG-S and GST-tagged GPI8 fusion proteins in the transfected cells was confirmed by western blot analysis. Cells were analyzed for in vitro proliferation and invasion capabilities 24 and 48 h following transfection.
In transfection with siRNAs, MDA-MB-231 and 2008 cells were transfected with 1 nM of siRNA cocktail specific for four GPI subunits (PIGU, PIGT, GPAA1 and GPI8) in the presence of FuGene 6 transfection regent. Protein expression of all the four GPIT subunits was examined 72 h following transfection by immunohistochemistry using specific antibodies as described above.
MTT Assay
We performed standard MTT assay to assess cellular proliferation following the protocol provided by the manufacturer (ATCC).
Invasion Assay
We performed the invasion assay in 24-well matrigel invasion chambers as per manufacturer’s specification (BD Biosciences). At least 10 fields were randomly selected for counting cells that invaded through the membrane from each group.
Statistical Analysis
Statistical analyses were performed using STATA Statistical software, release 9.0 (2005, Stata Corporation, College Station, TX, USA). Immunohistochemistry data were grouped into two categories: positive (strong, intermediate) and negative (weak, null). They were analyzed with Pearson’s χ2-method. We also performed Student’s t-test for normally distributed variables. All P-values were derived from two-tailed test and were considered to be statistically significant at P<0.05.
Results
GPIT Expression Pattern is Altered in Several Human Cancer Types
We sought to comprehensively evaluate the GPIT complex expression profiles in a large number of normal and neoplastic tissues at both the RNA and protein levels. We used cancer cDNA-profiling blots containing 154 paired normal and tumor cDNAs from 19 organ sites. Hybridization signals were quantified as the ratio of expression in cancer compared to the corresponding normal tissue (C/N ratio). Overexpression was determined when the C/N ratio was ≥1.5. Our cDNA microarray data suggest that the GPIT subunits transcript level is frequently upregulated in several human tumor types, especially in breast, ovary and uterus (Figure 1; Table 1). In a few tissues (eg trachea, rectum, HNSCC) the GPIT expression level is low both in the normal and the matched tumors, suggesting that basal GPIT expression varies among different tissue types. Also the mRNA level varies among normal subjects, suggesting that the GPIT levels are not uniform in different organs or even in same organ of different patients (Figure 1). These results suggest that different individuals possess varied activities of the GPIT complex.
Figure 1.

Expression of GPIT subunits is altered in several human cancer types. The Cancer Profiling Array II was hybridized separately with the radiolabeled probe for PIG-U, PIG-T, GPAA1, GPI8, PIG-S and the housekeeping gene Ubiquitin. Hybridization signals were detected by phosphorimaging. The expression of PIG-U, PIG-T, GPAA1, GPI8, PIG-S was normalized by Ubiquitin expression as per manufacturer’s recommendation. Hybridization signals were quantified as the ratio of expression in cancer compared to the corresponding normal tissue (C/N ratio). Overexpression, when C/N ratio ≥1.5; Underexpression, when C/N ratio ≤0.5. Numbers indicate tissue types in columns. 1, breast; 2, ovary; 3, colon; 4, stomach; 5, lung; 6, kidney; 7, bladder; 8, vulva; 9, prostate; 10, trachea; 11, liver; 12, uterus; 13, cervix; 14, rectum; 15, thyroid gland; 16, testis; 17, skin; 18, small intestine; 19, pancreas; 20, cancer cell lines cDNAs. N, normal; T, tumor.
Table 1.
Summarizing status of PIG-U/PIG-T/GPAA1/GPI8/PIG-S transcripts overexpresseda in various human cancers
| PIG-U | PIG-T | GPAA1 | GPI8 | PIG-S | |
|---|---|---|---|---|---|
| Breast | 2/10 | 3/10 | 2/10 | 5/10 | 3/10 |
| Ovary | 6/10 | 2/10 | 2/10 | 6/10 | 4/10 |
| Colon | 6/10 | 2/10 | — | 4/10 | — |
| Lung | 1/10 | 2/10 | 2/10 | — | 6/10 |
| Kidney | 2/10 | 1/10 | 2/10 | — | — |
| Bladder | — | — | — | 2/5 | 4/5 |
| Liver | — | — | — | 3/3 | — |
| Uterus | 3/10 | 6/10 | 4/10 | — | 5/10 |
| Thyroid | 2/10 | 5/10 | — | — | — |
| Skin | 2/10 | 5/10 | — | — | — |
Hybridization signals were quantified as the ratio of expression in cancer compared to the corresponding normal tissue (C/N ratio). Overexpression (shown in roman), when C/N ratio ≥1.5; underexpression (shown in italics), when C/N ratio ≤0.5. The table shows expression data for 10 of the 19 organs, where at least one of the GPIT subunits showed deregulation.
Overall, PIG-U, PIG-T, GPAA1 and PIG-S transcript levels were commonly overexpressed in tumor vs normal tissues (Table 1). PIG-U mRNA showed overexpression in 60% of colon and ovarian cancer cases whereas PIG-T mRNA was upregulated in 60% of uterine, 50% of thyroid and melanoma and 30% of breast cancer cases. GPAA1 transcript was overexpressed in 40% of uterine cancer patients and PIG-S in 60% of lung, 50% of thyroid and 40% of ovarian and liver cancer cases. These RNA expression data generated from the cDNA blots were corroborated at the protein level by IHC. We generated/procured the antibodies for all five subunits of the GPIT complex and standardized them for IHC for use in TMAs. A similar trend in expression level was observed, ie the GPIT subunits protein expression varied among normal samples of the same tissue type and also varied in tumors when compared with the matched normal tissues (Table 2). As we could evaluate only a limited number of samples from a large variety of organs both in the cDNA and TMAs, no attempt has been made in the present study to correlate the expression level with clinicopathological parameters, eg patient age and tumor stage.
Table 2.
Summarizing expression status of PIG-U/PIG-T/GPAA1/GPI8/PIG-S protein among most common cancer types and corresponding normal tissuesa
| Tissue | PIG-U
|
PIG-T
|
GPAA1
|
GPI-8
|
PIG-S
|
|||||||||||||||
|---|---|---|---|---|---|---|---|---|---|---|---|---|---|---|---|---|---|---|---|---|
| +++ (%) | ++ (%) | + (%) | −ve(%)/P** | +++ (%) | ++ (%) | + (%) | −ve (%)/P | +++ (%) | ++ (%) | + (%) | −ve (%)/P | +++ (%) | ++ (%) | + (%) | −ve (%)/P | +++ (%) | ++ (%) | + (%) | −ve (%)/P | |
| Stomach (T) | 65 | 30 | 5 | — | 6 | 72 | 22 | — | 50 | 40 | — | 10 | — | 26 | 58 | 16 | — | 55 | 15 | 30 |
| Stomach (N) | 25 | 75 | — | — | 100 | — | — | — | — | 100 | — | — | — | 100 | — | — | 25% | 75 | — | — |
| Skin (T) | 31 | 59 | 10 | — | — | 68 | 32 | — | 11 | 57 | 25 | 7 | — | 7 | 61 | 32 | — | 34 | 52 | 14 |
| Skin (N) | — | 100 | — | — | — | 100 | — | — | 40 | 40 | 20 | — | — | — | 100 | — | — | 20 | 80 | — |
| Prostate (T) | 35 | 41 | 24 | — | 6 | 82 | 12 | — | 6 | 35 | 47 | 12 | — | 18 | 53 | 29 | — | 24 | 24 | 52 |
| Prostate (N) | — | 50 | 50 | — | — | 50 | 50 | — | — | — | 50 | 50 | — | — | 50 | 50 | — | 100 | — | — |
| Ovary (T) | 55 | 35 | 10 | — | 7 | 50 | 43 | — | 15 | 45 | 30 | 10 | 10 | 54 | 33 | 3 | — | 69 | 28 | 3 |
| Ovary (N) | — | 40 | 60 | —/P =0.007 | — | 20 | 40 | 40 | — | — | 60 | 40/P =0.011 | — | — | 50 | 50/P =0.015 | — | 80 | 20 | — |
| Breast (T) | 30 | 59 | 7 | 4 | 50 | 43 | 7 | — | 19 | 39 | 26 | 16 | 3 | 38 | 38 | 21 | — | 80 | 20 | — |
| Breast (N) | 11 | 33 | 23 | 33/P =0.005 | — | 89 | 11 | — | 44 | — | 44 | 12 | — | 11 | 33 | 56 | — | 50 | 50 | — |
| Testis (T) | — | 63 | 37 | — | 24 | 70 | 6 | — | — | 32 | 53 | 15 | 5 | 17 | 67 | 11 | — | 22 | 78 | — |
| Testis (N) | — | 50 | 50 | — | — | 100 | — | — | — | — | 100 | — | — | 50 | 50 | — | — | 50 | 50 | — |
| Colon (T) | 50 | 33 | 17 | — | 12 | 76 | 12 | — | 18 | 47 | 35 | — | 11 | 53 | 36 | — | 5 | 90 | 5 | — |
| Colon (N) | 20 | 80 | — | — | — | 20 | 80 | —/ | ||||||||||||
| P =0.003 | — | 100 | — | — | 40 | 60 | — | —/P<0.001 | — | 100 | — | — | ||||||||
| Bladder (T) | 5 | 58 | 37 | — | 18 | 53 | 29 | — | — | 44 | 50 | 6 | — | 5 | 69 | 26 | — | 94 | 6 | — |
| Bladder (N) | — | 67 | 33 | — | — | 75 | — | 25 | — | 25 | 75 | — | — | — | 75 | 25/P<0.001 | — | 75 | 25 | — |
| Uterus (T) | 70 | 30 | — | — | — | 40 | 40 | 20 | 10 | 65 | 25 | — | 11 | 56 | 33 | — | 70 | 20 | 10 | — |
| Uterus (N) | 20 | 80 | — | — | — | — | 100 | — | 20 | 20 | 60 | — | — | — | 100 | —/P =0.015 | 60 | 40 | — | — |
| Thyroid (T) | 45 | 50 | 5 | — | 45 | 55 | — | — | 25 | 40 | 30 | 5 | 40 | 5 | 45 | 10 | 5 | 60 | 35 | — |
| Thyroid (N) | — | 60 | 40 | — | — | 40 | 60 | —/P =0.001 | — | — | 80 | 20/P =0.009 | — | 20 | 80 | — | — | — | 100 | —/P =0.001 |
| Lung (T) | 10 | 40 | 50 | — | 13 | 73 | 10 | 4 | 3 | 37 | 50 | 10 | — | 10 | 87 | 3 | — | 30 | 70 | — |
| Lung (N | — | 75 | 25 | — | — | — | 100 | —/P =0.001 | — | — | 80 | 20 | — | — | 20 | 80 | — | — | 100 | — |
| Lymph node (T) | — | 37 | 53 | 10 | — | 15 | 75 | 10 | — | 10 | 50 | 40 | — | 5 | 60 | 35 | — | 16 | 84 | — |
| Lymph node (N) | — | — | — | 100/ | ||||||||||||||||
| P<0.001 | — | — | 100 | — | — | — | 67 | 33 | — | — | — | 100/P<0.001 | — | 11 | 89 | — | ||||
| Liver (T) | 11 | 84 | 5 | — | 26 | 74 | — | — | — | 74 | 26 | — | 11 | 21 | 68 | — | — | 65 | 35 | — |
| Liver (N) | 20 | 80 | — | — | — | 100 | — | — | — | 100 | — | — | — | 75 | 25 | —/P<0.001 | — | 60 | — | 40 |
| Pancreas (T) | 5 | 90 | 5 | — | 25 | 65 | 10 | — | 5 | 55 | 35 | 5 | — | 5 | 80 | 15 | 10 | 75 | 15 | — |
| Pancreas (N | — | 100 | — | — | 20 | — | 80 | —/P =0.001 | — | 80 | — | 20 | — | 100 | — | — | — | 60 | 20 | 20 |
| Kidney (T) | 16 | 53 | 31 | — | 44 | 37 | 19 | — | 5 | 32 | 47 | 16 | 5 | 5 | 75 | 15 | 10 | 53 | 37 | — |
| Kidney (N) | — | 100 | — | — | 100 | — | — | — | 100 | — | — | — | 100 | — | — | — | 20 | 60 | — | 20 |
The intensity of immunostaining was scored as follows: (−ve), no detectable immunostaining or basal immunostaining in <10% cells; (+), mild immunostaining in 10–30% cells; (++), moderate immunostaining in 30–50% cells and (+++), intense immunostaining in >50% of the cells showing cytoplasmic staining.
P indicates statistical significance of expression when <0.05.
The GPI8 subunit of GPIT showed a peculiar cDNA expression pattern. Although GPI8 showed overexpression in breast and ovary, similar to other members of the GPIT, it also showed a significant downregulation in bladder (40%), liver (100%) and colon (40%) carcinoma cases (Figure 1; Table 1). To corroborate this deregulation at the protein level, IHC was performed on a new set of TMAs specific for bladder, liver and colon cancer and the corresponding normal tissues. GPI8 expression was negative in 16% of bladder tumors, 25% of liver cancers and 3% of colon cancers. On the other hand, 68% of normal bladder, 56% of normal liver and 71% of normal colon showed high (+ + +) GPI8 immunostaining as compared to 0, 15 and 8% of tumors from corresponding cancer sites showing high (+ + +) GPI8 expression (Table 3). This confirms the downregulation of GPI8 in bladder, liver and colon tumors at both the RNA and protein levels.
Table 3.
Corroborating the downregulation of GPI8 protein in bladder cancer, liver cancer and colon cancer vs normala
| Cancer
|
Nonmalignant control
|
|||||||
|---|---|---|---|---|---|---|---|---|
| +++ (%) | ++ (%) | + (%) | −ve (%) | +++ (%) | ++ (%) | + (%) | −ve | |
| Bladder Ca | — | 38 | 46 | 16 | 68 | 29 | 3 | — |
| Liver Ca | 15 | 28 | 32 | 25 | 56 | 36 | 8 | — |
| Colon Ca | 8 | 38 | 51 | 3 | 71 | 23 | 6 | — |
Ca, cancer.
The intensity of immunostaining was scored as follows: (−ve), no detectable immunostaining or basal immunostaining in <10% cells; (+), mild immunostaining in 10–30% cells; (++), moderate immunostaining in 30–50% cells and (+++), intense immunostaining in >50% of the cells showing cytoplasmic staining.
Shaded portion represents staining pattern in non-cancer specimens.
GPIT Complex is Upregulated in Breast, Ovary and Uterus
Comparison of RNA and protein expression levels between tumor and normal tissues from various anatomical sites showed a dramatic and clear overexpression pattern of the GPIT subunits in breast, ovary and uterine cancers (Tables 1 and 2; Figure 2). GPIT subunits were overexpressed in 20–70% in the above-mentioned cancers (Tables 1 and 2).
Figure 2.

GPIT subunits protein accumulation varies in different human cancers tissues as compared to corresponding normal tissues. Representative photomicrographs of sections of breast carcinoma, ovarian carcinoma, uterine carcinoma and their corresponding normal tissue sections immunostained with PIG-U, PIG-T, GPAA1, GPI8 and PIG-S antibodies and visualized by bright-field microscopy under ×100 magnification. All GPIT subunits, ie PIG-U, PIG-T, GPAA1, GPI8 and PIG-S, showed cytoplasmic localization. Overall, PIG-U, PIG-T, GPAA1, GPI8 and PIG-S proteins were uniformly overexpressed in tumor tissues as compared to normal.
To examine the specificity of the polyclonal antibodies against the GPI subunits, we also performed immunohistochemistry on one breast (MDA-MB-231) and ovarian (2008) cancer cell line utilizing antibodies against PIG-T, PIG-U, GPAA1 and GPI8. As a negative control, we knocked down individual GPIT subunits by using a specific siRNA cocktail. As depicted in Figure 3, all the four antibodies show specific cytoplasmic staining in MDA-MB-231 (Figure 3a) and 2008 (Figure 3b) cells, which was significantly diminished following 72 h of siRNA transfection.
Figure 3.

Specificity of the antibodies of the GPIT subunits. (a) Immunohistochemical detection of PIGT, PIGU, GPAA1 and GPI8 expression in breast cancer cell line (MDA-MB-231) without (upper panel) or with siRNA (lower panel) transfection. (b) Immunoexpression of PIGT, PIGU, GPAA1 and GPI8 in ovarian (2008) cancer cell line without (upper panel) or with siRNA (lower panel) transfection. Note the specific cytoplasmic expression of the different proteins in both the cell types that is diminished significantly with specific siRNA knockdown as indicated. Magnification × 200.
GPIT Complex in the Lymph Node
Immunohistochemical staining of TMAs showed that the GPIT subunits were generally expressed at low levels in the lymph node. In normal lymph node tissue, PIG-U staining was absent as compared to 90% of cancers that showed moderate to low PIG-U protein expression (Table 2; Figure 4). Similarly, normal lymph node tissues were negative for GPI8 staining as compared to 65% of lymphoma showing GPI8 expression (Table 2; Figure 4). Lymph node samples were assigned to categories: positive (strong, intermediate, weak) and negative (null), a variation from the grouping mentioned in ‘Materials and methods’ section, as most of lymphomas showed weak immunostaining for the GPIT subunits. PIG-U (χ2-test, P<0.001) and GPI8 (χ2-test, P<0.001) expression showed a significant association with lymphoma.
Figure 4.
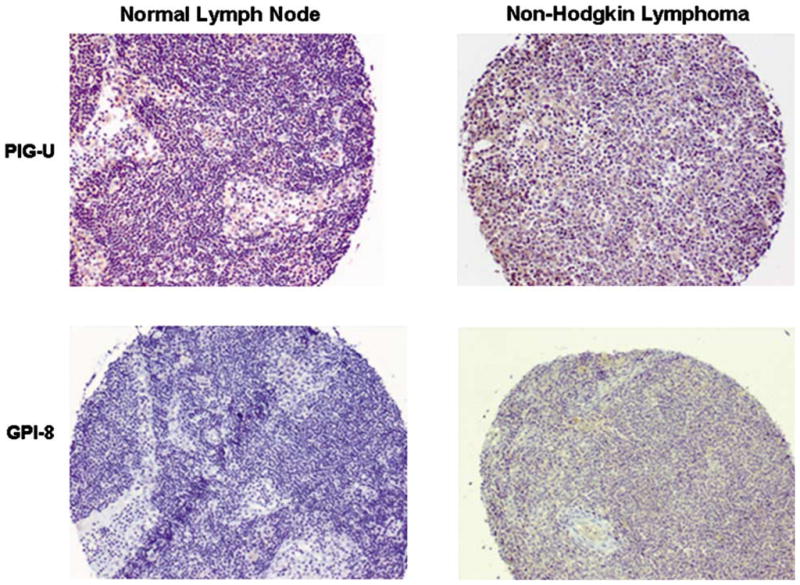
PIG-U and GPI8 expression in lymphoma. Immunohistochemical detection of PIG-U and GPI8 proteins in non-Hodgkin’s lymphoma as compared to absence of these proteins in normal lymph node. Magnification × 100.
GPIT Complex in Lung Cancer
A differential immunostaining pattern was observed among different types of lung cancer tissues (Table 4). Overall, small cell lung carcinoma (SCLC) and normal controls showed weak immunostaining for GPIT subunits. In contrast, various subtypes of non-small cell lung carcinoma (NSCLC), ie squamous cell carcinoma, adenocarcinoma and large cell carcinoma showed a significant overexpression of GPIT subunits (Figure 5). Furthermore, 80% of nonmalignant control tissues were negative for GPI8 protein as compared to 20% of SCLC, whereas most of NSCLC showed weak to moderate GPI8 immunostaining.
Table 4.
Expression of PIG-U/PIG-T/GPAA1/GPI8/PIG-S protein in lung cancer vs normala
| Squamous cell carcinoma
|
Adenocarcinoma
|
Large cell carcinoma
|
Small cell carcinoma
|
Nonmalignant control
|
||||||||||||||||
|---|---|---|---|---|---|---|---|---|---|---|---|---|---|---|---|---|---|---|---|---|
| +++ (%) | ++ (%) | + (%) | −ve | +++ (%) | ++ (%) | + (%) | −ve | +++ (%) | ++ (%) | + (%) | −ve (%) | +++ | ++ (%) | + (%) | −ve (%) | +++ | ++ (%) | + (%) | −ve (%) | |
| PIG-U | — | 10 | 90 | — | — | 80 | 20 | — | 60 | 40 | — | — | — | 20 | 80 | — | — | 75 | 25 | — |
| PIG-T | 20 | 80 | — | — | 20 | 80 | — | — | — | 100 | — | — | — | 20 | 60 | 20 | — | — | 100 | — |
| GPAA1 | — | 40 | 60 | — | 10 | 60 | 30 | — | — | — | 40 | 60 | — | 20 | 80 | — | — | — | 80 | 20 |
| GPI8 | — | — | 100 | — | — | 20 | 80 | — | — | — | 100 | — | — | 20 | 60 | 20 | — | — | 20 | 80 |
| PIG-S | — | 10 | 90 | — | — | 30 | 70 | — | — | 80 | 20 | — | — | 20 | 80 | — | — | — | 100 | — |
The intensity of immunostaining was scored as follows: (−ve), no detectable immunostaining or basal immunostaining in <10% cells; (+), mild immunostaining in 10–30% cells; (++), moderate immunostaining in 30–50% cells and (+++), intense immunostaining in >50% of the cells showing cytoplasmic staining.
Figure 5.
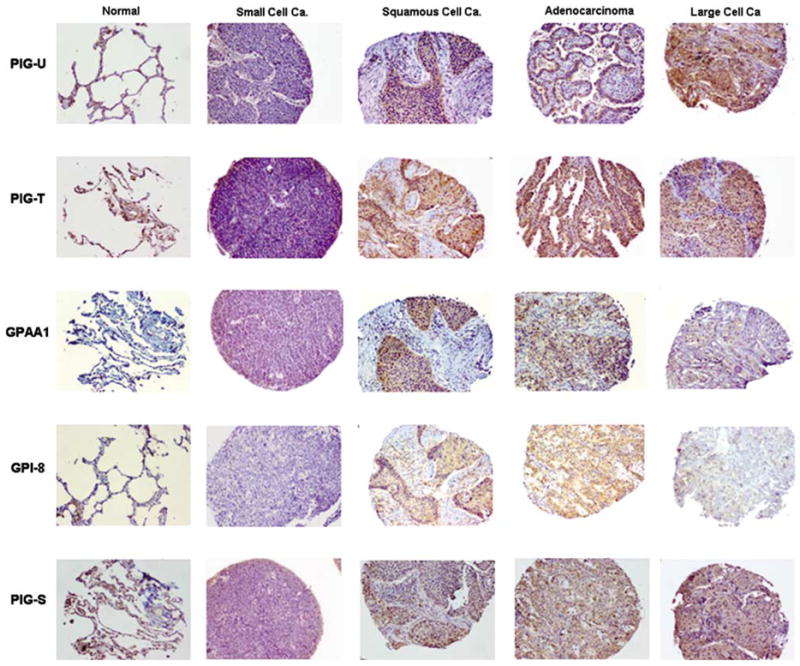
Immunostaining pattern of PIG-U, PIG-T, GPAA1, GPI8 and PIG-S proteins among different types of lung carcinoma vs normal tissues. Absence or weak expression of PIG-U, PIG-T, GPAA1, GPI8 and PIG-S was observed in normal lung tissue and SCLC as compared to moderate to high expression in various forms of NSCLC such as squamous cell carcinoma, adenocarcinoma and large cell carcinoma. Magnification × 100.
Deregulation of Individual GPIT Subunits in Different Tissues
Pearson’s χ2-test was performed on the IHC data (Table 2). This added statistical power and produced a short listing of tissues with a gross deregulation of GPIT subunits. Statistically significant overexpression was observed for PIG-U in the cancers of ovary (P=0.007), breast (P=0.005); for PIG-T in cancers of colon (P=0.003), thyroid (P<0.001), lung (P<0.001), pancreas (P=0.001) and for GPAA1 in ovary (P=0.011) and thyroid (P=0.009). GPI8 overexpression was observed in cancers of ovary (P=0.015) and uterus (P=0.015) and PIG-S overexpression was seen in thyroid cancer (P=0.017). GPI8 downregulation also showed statistical significance in cancers of the bladder (P<0.001), liver (P<0.001) and colon (P<0.001).
Loss of GPI8 Expression During Tumor Progression
Immunohistochemistry was then performed on matched normal and tumor tissues of different histological grades in bladder, colon and liver cancers using the anti-GPI8 antibody. We observed significantly lower expression of GPI8 (P<0.001) in the tumors of different grades compared to the corresponding normal in all the tumor types (Table 5; Figure 6).
Table 5.
Expression of GPI8 protein in bladder, colon and liver cancers
| Cancer type | Grade | Number of matched sample analyzed | Expression of GPI8a |
|
|---|---|---|---|---|
| Normal | Tumor | |||
| Bladder | I | 5 | +++ | + |
| II | 5 | +++ | + | |
| III | 5 | +++ | + | |
| Colon | I | 5 | ++ | + |
| II | 5 | ++ | + | |
| III | 5 | ++ | + | |
| Liver | I | 2 | +++ | + |
| II | 2 | +++ | + | |
Immunohistochemical detection of GPI8 expression in matched normal and tumor samples from bladder, colon and liver cancer at different histological grades. I, well-differentiated carcinoma; II, moderately differentiated carcinoma; III, poorly differentiated carcinoma. Significant loss of GPI8 expression was observed (P<0.001) in the tumor compared to the corresponding normal tissue.
Figure 6.

Expression of GPI8 protein in matched normal and tumor tissues from bladder and liver cancers. Significantly lower expression (P<0.001) was observed in the tumor compared to the matched normal. Magnification × 200.
Increased In Vitro Proliferation and Invasion Following Forced Overexpression of GPI8 and PIG-S in SKBR3 Cells
To better understand the functional roles of GPI8 and PIG-S, we transiently transfected SKBR3 cells and examined both the in vitro proliferation and the invasion capabilities of the transfected cells. The expression of the exogenous GPI8 and PIG-S was confirmed by western blot analysis in the transfected cells (Figure 7a). The endogenous level of wild-type GPI8 and PIG-S was detectable in the SKBR3 cells (data not shown). SKBR3 cells transfected with GPI8 and PIG-S alone or in combination induced a significant increase in proliferation at 24 or 48 h following transfection (Figure 7b). We did not see any considerable differences in proliferation between GPI8 and PIG-S alone or in combination.
Figure 7.
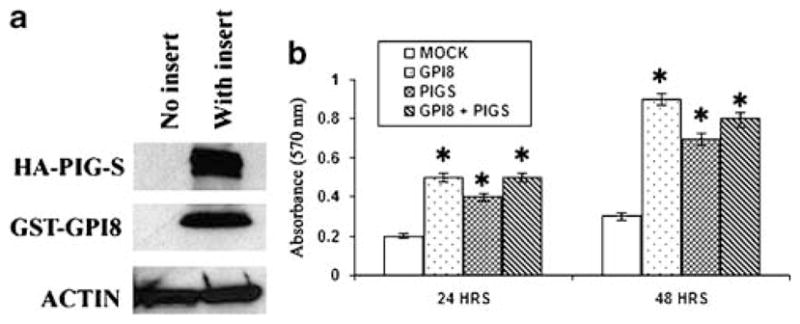
In vitro proliferation of SKBR3 cells following transient transfection with GPI8 and PIG-S alone or in combination as indicated. (a) Expression of the fusion proteins was confirmed by western blot analysis. Actin was used as control. (b) Significant proliferation was observed (P<0.05) in cells transfected with GPI8 and PIG-S alone or in combination at indicated time points compared to empty vector-transfected cells. Most significant proliferation was observed following transfection with GPI8 after 48 h. *P<0.05.
As acquirement of invasive properties is a hall-mark of tumor progression, we next determined the in vitro invasion potential of GPI8- and/or PIG-S-transfected SKBR3 cells using the matrigel invasion chamber assay. We did not observe any notable invasion of the GPI8-transfected group compared to the mock-transfected group (Figure 8). However, the number of invading cells was significantly higher in the PIG-S-transfected group (P<0.001) compared to the mock- (76±14 vs 11±4) and GPI8 (76±14 vs 18±6)-transfected groups (Figure 8a). The number of invading cells was also significantly higher (P<0.0001) in the GPI8 plus PIG-S co-transfected group compared to the mock (89±11 vs 11±4) or GPI8 alone (89±11 vs 18±6) (Figure 8a). Representative photomicrograph of the invaded cells in different groups is shown in Figure 8b.
Figure 8.

Invasion potential of the SKBR3 cells following transient transfection with GPI8 and PIG-S alone or in combination after 48 h. (a) Significant invasion (P<0.05) was observed in cells transfected with PIG-S alone or in combination with GPI8 compared to empty vector-transfected cells. *P<0.05. (b) Representative photomicrograph showing invasive cells in different groups. Magnification × 200.
Discussion
Considering the importance of GPI-anchored proteins in the normal function of the cell, very little information is available on the deregulation of these proteins in human cancers and in other pathological conditions. As GPIT is the key enzyme involved in this anchoring process, variations in the expression level of this enzyme or its various subunits might have a significant physiological impact on the structural and functional diversity of GPI proteins and hence contribute to deregulated cell growth in novel ways. Also it remains to be elucidated whether tissue-specific variation in GPI-anchored proteins are a consequence of altered expression of specific GPIT subunits or whether other common mechanisms are involved in the regulation of this pathway. In the present study, we developed a comprehensive expression profile for all five subunits of GPIT, ie PIG-U/PIG-T/GPAA1/GPI8/PIG-S, in human cancers from different anatomic sites.
Our results demonstrate that the subunits of the GPIT complex are overexpressed at various frequencies in most of the common cancers at both the mRNA and protein levels. As all of the antibodies used were polyclonal and some were custom made, we analyzed their specificity in a breast cancer cell line using specific siRNA as negative control. Clearly, the subunits of GPIT demonstrated cytoplasmic localization as well as specificity of the antibodies analyzed. PIG-U, PIG-T and GPAA1 are localized to chromosomal regions 20q11, 20q13.12 and 8q24 whereas GPI8 and PIG-S are localized to 1p31.1 and 17p31.2, respectively. A number of studies have indicated amplification/gain and increased gene copy number on chromosomes 8q and 20q11–13 in different tumors including breast, ovary, uterine serous, endometrioid carcinomas and carcinomas of the ovary.14–17 Of note, C-myc is localized on 8q24.21 and src is localized on 20q11.23, marking these regions as oncogenic hot-spots. Recent studies have identified multiple regions within 8q24 independently affecting the risk for prostate cancer.18,19 In this study, we observed that GPAA1, at 8q24, is overexpressed in 41% of prostate cancer tissues. It will be interesting to explore whether the SNPs discovered in 8q2418,19 affect regulation or transcription of GPAA1.
Among the 19 different tumor types screened in the present study; breast, ovary and uterus showed a pattern where all the GPIT subunits are overexpressed in these tumors. Wu et al9 have recently reported on the amplification of three of the GPIT subunits in primary breast cancer cases. Of them, 42% showed amplification of PIG-U, 13% showed amplification of PIG-T and only 11.6% showed increased copy number of GPAA1.9 Here, the fourth subunit, GPI8, showed higher accumulation in 64% of ovarian cancer and 67% of uterine cancer cases. The fifth subunit, PIG-S, did not show any significant deregulation in expression levels in breast, ovary or uterine cancers. Of these three cancers, the immunoexpression results in ovarian cancer were the most striking. Because of the lack of representative surface epithelial lining in the normal ovarian samples included in the TMA, we performed parallel immunostaining for all five markers on routine archival sections of three benign ovarian tissues (data not shown). The latter were obtained as part of total hysterectomies and bilateral salpingo-oophorectomy for non-ovarian lesions. The routine sections support our TMA findings in ovarian lesions in that there is a relatively lower expression of PIG-T/GPAA1/GPI8 in the benign ovarian epithelium. This underscores the fact that the GPIT complex is highly deregulated during the ovarian transformation process. The immunoexpression results in thyroid cancer showed a similar trend. It was observed20 that 8q23 loci are amplified in well-differentiated thyroid carcinoma and there is a gain of the 20q region in poorly differentiated thyroid carcinoma. In our study, we also observed higher expression of the GPIT subunits in thyroid cancer cases as compared to nonmalignant control tissues.
GPI8, localized on 1p31.1, showed downregulation at the mRNA level in 50% of bladder carcinoma, 50% of hepatocellular carcinoma and 40% of colon carcinoma cases. Furthermore, we also observed a significant decrease in GPI8 immunostaining in bladder, liver and colon carcinomas in comparison to the corresponding normal. Analysis of GPI8 expression in matched normal and tumor tissues from bladder, colon and liver cancers at different tumor grades also demonstrated a significant loss of GPI8; indicating a causative role of this subunit in tumorigenesis.
Along with GPI8, PIG-S was also overexpressed in breast and other cancers. To examine whether they have any role in cellular transformation, we transiently transfected the SKBR3 breast cancer cells with GPI8 and PIG-S alone or in combination. Our observation clearly indicates the functional role of both of the subunits in cellular transformation.
Another clinically relevant finding from this study was that PIG-U and GPI8 expression was absent in all the nine normal lymph node tissues analyzed. On the other hand, about 90% of malignant lymph node tissues showed moderate to low PIG-U staining and GPI8 accumulation was observed in 65% of lymph node cancers. We further observed a pattern of increased expression of all the GPIT subunits in the various NSCLC subtypes. Squamous cell carcinoma of lung showed 20% increased expression of PIG-T. PIG-T and GPAA1 were overexpressed in 20 and 10% of lung adenocarcinoma cases, respectively whereas 60% of large cell lung carcinoma cases had PIG-U overexpression. The majority of the SCLC and nonmalignant controls showed moderate to low GPIT expression. Previous CGH analysis of NSCLC indicated that among the most frequent chromosomal arm gains were 8q (65%) and 20q (48%).21
A comprehensive analysis of GPIT mRNA and protein expression in tumors of 19 different anatomic origins as well as forced overexpression of GPI8 and PIG-S revealed interesting insights into the frequency of GPIT expression and their functional contribution in cancer. This study sheds light on the clinical significance of these proteins as potential cancer biomarkers as well as therapeutic targets. We conclude that the GPIT subunits are ubiquitously overexpressed in many tumor types and may contribute to tumorigenesis. Our work adds further credence to the notion that the GPI-anchoring process is a new and important pathway playing a pivotal role in tumorigenesis and encourages further in vitro and in vivo functional analysis in different tumors.
Acknowledgments
This study was supported by National Cancer Institute Lung Cancer Specialized program of Research Excellence Grant (CA 58184-01 to DS), High Throughput Genetic Analysis of Bladder Cancer Grant (CA 077664-08 to DS) and by a grant from the Flight Attendant Medical Research Institute (FAMRI) to BT. We dedicate this work to the memory of our colleague Toby Eagle.
Footnotes
Conflict of interest
None to declare.
References
- 1.Orlean P, Menon AK. GPI anchoring of protein in yeast and mammalian cells or: how we learned to stop worrying and love glycophospholipids. J Lipid Res. 2007;48:993–1011. doi: 10.1194/jlr.R700002-JLR200. [DOI] [PubMed] [Google Scholar]
- 2.Hamburger D, Egerton M, Riezman H. Yeast Gaa1p is required for attachment of a completed GPI anchor onto proteins. J Cell Biol. 1995;129:629–639. doi: 10.1083/jcb.129.3.629. [DOI] [PMC free article] [PubMed] [Google Scholar]
- 3.Benghezal M, Benachour A, Rusconi S, et al. Yeast Gpi8p is essential for GPI anchor attachment onto proteins. EMBO J. 1996;15:6575–6583. [PMC free article] [PubMed] [Google Scholar]
- 4.Ohishi K, Inoue N, Maeda Y, et al. Gaa1p and Gpi8p are components of a glycosylphosphatidylinositol (GPI) transamidase that mediates attachment of GPI to proteins. Mol Biol Cell. 2000;11:1523–1533. doi: 10.1091/mbc.11.5.1523. [DOI] [PMC free article] [PubMed] [Google Scholar]
- 5.Ohishi K, Inoue N, Kinoshita T. PIG-S and PIG-T, essential for GPI anchor attachment to proteins, form a complex with GAA1 and GPI8. EMBO J. 2001;20:4088–4098. doi: 10.1093/emboj/20.15.4088. [DOI] [PMC free article] [PubMed] [Google Scholar]
- 6.Hong Y, Ohishi K, Kang JY, et al. Human PIG-U and yeast Cdc91p are the fifth subunit of GPI transamidase that attaches GPI-anchors to proteins. Mol Biol Cell. 2003;14:1780–1789. doi: 10.1091/mbc.E02-12-0794. [DOI] [PMC free article] [PubMed] [Google Scholar]
- 7.Nagamune K, Ohishi K, Ashida H, et al. GPI transamidase of Trypanosoma brucei has two previously uncharacterized (trypanosomatid transamidase 1 and 2) and three common subunits. Proc Natl Acad Sci USA. 2003;100:10682–10687. doi: 10.1073/pnas.1833260100. [DOI] [PMC free article] [PubMed] [Google Scholar]
- 8.Guo Z, Linn JF, Wu G, et al. CDC91L1 (PIG-U) is a newly discovered oncogene in human bladder cancer. Nat Med. 2004;10:374–381. doi: 10.1038/nm1010. [DOI] [PubMed] [Google Scholar]
- 9.Wu G, Guo Z, Chatterjee A, et al. Overexpression of glycosylphosphatidylinositol (GPI) transamidase subunits phosphatidylinositol glycan class T and/or GPI anchor attachment 1 induces tumorigenesis and contributes to invasion in human breast cancer. Cancer Res. 2006;66:9829–9836. doi: 10.1158/0008-5472.CAN-06-0506. [DOI] [PubMed] [Google Scholar]
- 10.Kurokawa Y, Matoba R, Nakamori S, et al. PCR-array gene expression profiling of hepatocellular carcinoma. J Exp Clin Cancer Res. 2004;23:135–141. [PubMed] [Google Scholar]
- 11.Ho JC, Cheung ST, Patil M, et al. Increased expression of glycosyl-phosphatidylinositol anchor attachment protein 1 (GPAA1) is associated with gene amplification in hepatocellular carcinoma. Int J Cancer. 2006;119:1330–1337. doi: 10.1002/ijc.22005. [DOI] [PubMed] [Google Scholar]
- 12.Yu J, Nagarajan S, Knez JJ, et al. The affected gene underlying the class K surface protein defects codes for the GPI-transamidase. Proc Natl Acad Sci USA. 1997;94:12580–12585. doi: 10.1073/pnas.94.23.12580. [DOI] [PMC free article] [PubMed] [Google Scholar]
- 13.Dasgupta S, Bhattacharya-Chatterjee M, O’Malley BW, Jr, et al. Tumor metastasis in an orthotopic murine model of head and neck cancer: possible role of TGF-Beta 1 secreted by the tumor cells. J Cell Biochem. 2006;97:1036–1051. doi: 10.1002/jcb.20647. [DOI] [PubMed] [Google Scholar]
- 14.Hyman E, Kauraniemi P, Hautaniemi S, et al. Impact of DNA amplification on gene expression patterns in breast cancer. Cancer Res. 2002;62:6240–6245. [PubMed] [Google Scholar]
- 15.Osterberg L, Levan K, Partheen K, et al. Cytogenetic analysis of Carboplatin resistance in early-stage epithelial ovarian carcinoma. Cancer Genet Cytogenet. 2005;163:44–150. doi: 10.1016/j.cancergencyto.2005.06.023. [DOI] [PubMed] [Google Scholar]
- 16.Pere H, Tapper J, Wahlström T, et al. Distinct chromosomal imbalances in uterine serous and endometrioid carcinomas. Cancer Res. 1998;58:892–895. [PubMed] [Google Scholar]
- 17.Wilting SM, Snijders PJ, Meijer GA, et al. Increased gene copy numbers at chromosome 20q are frequent in both squamous cell carcinomas and adenocarcinomas of the cervix. J Pathol. 2006;209:220–230. doi: 10.1002/path.1966. [DOI] [PubMed] [Google Scholar]
- 18.Haiman CA, Patterson N, Freedman ML, et al. Multiple regions within 8q24 independently affect risk for prostate cancer. Nat Genet. 2007;39:638–644. doi: 10.1038/ng2015. [DOI] [PMC free article] [PubMed] [Google Scholar]
- 19.Hunter DJ, Kraft P, Jacobs KB, et al. Genome-wide association study of prostate cancer identifies a second risk locus at 8q24. Nat Genet. 2007;39:645–649. doi: 10.1038/ng2022. [DOI] [PubMed] [Google Scholar]
- 20.Wreesmann VB, Ghossein RA, Patel SG, et al. Genomewide appraisal of thyroid cancer progression. Am J Pathol. 2002;161:1549–1556. doi: 10.1016/S0002-9440(10)64433-1. [DOI] [PMC free article] [PubMed] [Google Scholar]
- 21.Luk C, Tsao MS, Bayani J, et al. Molecular cytogenetic analysis of non-small cell lung carcinoma by spectral karyotyping and comparative genomic hybridization. Cancer Genet Cytogenet. 2001;125:87–99. doi: 10.1016/s0165-4608(00)00363-0. [DOI] [PubMed] [Google Scholar]