Abstract
Epigenome information in mammalian brain cells reflects their developmental history, neuronal activity, and environmental exposures. Studying the epigenetic modifications present in neuronal cells is critical to a more complete understanding of the role of the genome in brain functions. We performed comprehensive DNA methylation analysis in neuronal and non-neuronal nuclei obtained from the human prefrontal cortex. Neuronal nuclei manifest qualitatively and quantitatively distinctive DNA methylation patterns, including relative global hypomethylation, differential enrichment of transcription-factor binding sites, and higher methylation of genes expressed in astrocytes. Non-neuronal nuclei showed indistinguishable DNA methylation patterns from bulk cortex and higher methylation of synaptic transmission-related genes compared with neuronal nuclei. We also found higher variation in DNA methylation in neuronal nuclei, suggesting that neuronal cells have more potential ability to change their epigenetic status in response to developmental and environmental conditions compared with non-neuronal cells in the central nervous system.
In mammals, DNA methylation primarily occurs at the fifth position of the cytosine residue in CpG dinucleotides. Aberration of DNA methylation is associated with various diseases, as clearly seen in tumorigenesis (Bird 2002; Feinberg 2007). DNA methylation also plays an important role in the development and cellular function within the brain. For example, changes in DNA methylation are associated with neuronal and glial differentiation from neural stem cells (Takizawa et al. 2001). The neural stem cells of mice lacking Mbd1 have reduced neuronal differentiation (Zhao et al. 2003). Aberrations of DNA methylation are also involved in human neurologic and psychiatric diseases (Iwamoto et al. 2005b; Tsankova et al. 2007; Mill et al. 2008; Keller et al. 2010). Mutations in MECP2 lead to Rett syndrome (Chahrour and Zoghbi 2007), and those in the imprinted genes are also implicated in some mental disorders (Wilkinson et al. 2007).
Accumulating evidence suggests that DNA methylation also has an important role in the function of adult post-mitotic neurons and behavior. DNA methylation status varies globally or locally across different brain regions (Ladd-Acosta et al. 2007; Brown et al. 2008). Blocking DNA methyltransferase activity results in the loss of long-term potentiation (Levenson et al. 2006) and a decrease in the frequency of miniature excitatory synaptic current (Nelson et al. 2008) with demethylation of neuronal genes. In addition, membrane depolarization can induce changes in DNA methylation in the promoter region of the Bdnf (Chen et al. 2003; Martinowich et al. 2003). At the behavioral level, fear conditioning induces changes in DNA methylation (Miller and Sweatt 2007), and increased nurturing behavior of rat mothers alters DNA methylation in the promoter of Nr3c1 in the hippocampus of offspring (Weaver et al. 2004).
Taken together, the epigenome information in mammalian brain cells reflects their developmental history and activity (Borrelli et al. 2008; Jiang et al. 2008). In addition, epigenetic modifications are affected by environmental conditions, including chemical, nutritional, and social factors (Meaney and Szyf 2005; Maze et al. 2010). Unraveling the epigenetic status of neuronal cells would, therefore, be critical to understand the molecular basis of brain functions. However, despite its importance, epigenetic profiling in the brain, especially in the human brain, has been sparsely explored. Many challenges remain, including the heterogeneity of cell types, such as neurons and glia.
Here we performed comprehensive DNA methylation analysis in neuronal and non-neuronal nuclei obtained from the human prefrontal cortex by using a cell sorter-based separation method. Using the extracted DNA from separated fractions, we quantified both global and site-specific DNA methylation and examined genome-wide promoter methylation status.
Results
Separation of neuronal and non-neuronal nuclei from post-mortem brains
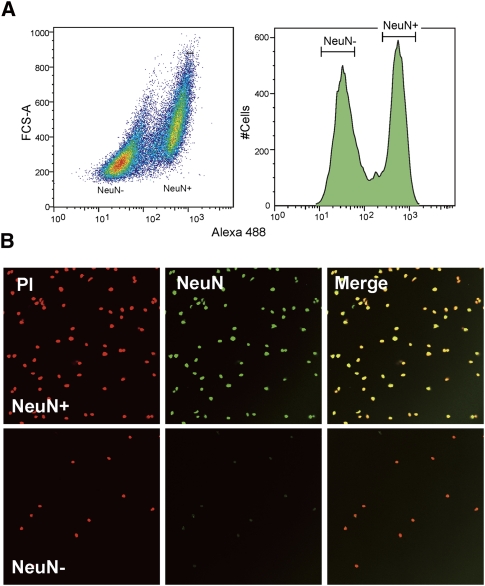
We separated fresh-frozen prefrontal cortex cells into neuronal and non-neuronal nuclei by fluorescence-activated cell sorting (FACS) based on NeuN, which is a well-known nuclear antigen specific for neurons in mammals (Mullen et al. 1992). We considered NeuN-positive (NeuN+) and -negative (NeuN−) fractions as neuronal and non-neuronal nuclei, respectively (Fig. 1A). We typically obtained >1 × 10⁶ nuclei in each fraction from 0.1 g of tissue, from which we yielded >1 μg of genomic DNA. The purity of each fraction was confirmed by resorting analysis by FACS and by microscopic examination of sorted nuclei (Fig. 1B). We estimated >95% and 99.9% purities for NeuN+ and NeuN− fractions, respectively.
Figure 1.
Separation of neuronal and non-neuronal nuclei by FACS. (A) Typical example of the nuclei sorting based on Alexa Fluoro 488-conjugated anti-NeuN antibody. (B) Microscopic examination of isolated neuronal (NeuN+) and non-neuronal (NeuN−) nuclei. Note that the image did not reflect the yield because of the different levels of dilution.
We conducted several lines of methylation experiments using genomic DNA extracted from various sources (Supplemental Table 1). Because of the limitation of the specimen and the aim of each assay, not all assays were performed for all material (Supplemental Table 2).
Global DNA methylation level
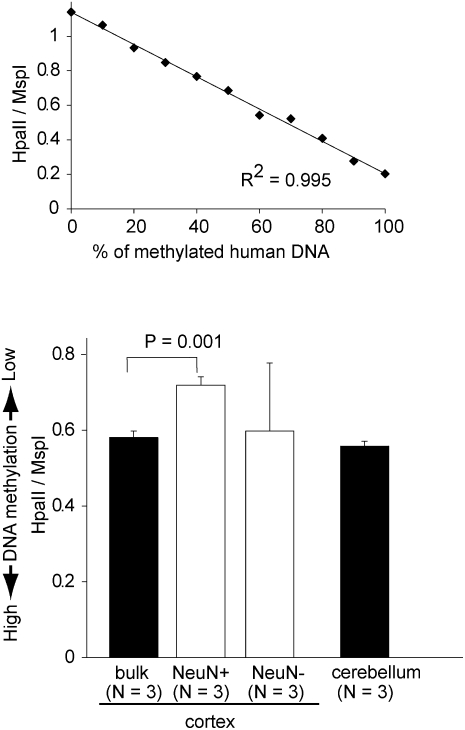
We measured global DNA methylation levels using the luminometric methylation assay (LUMA) method (Fig. 2; Karimi et al. 2006). We found significantly lower DNA methylation levels in NeuN+ samples compared with bulk cortical samples (P = 0.001, Student's t-test).
Figure 2.
Global DNA methylation assay by LUMA. (Top) HpaII/MspI ratio of the standard samples. (Bottom) HpaII/MspI ratio of the bulk and sorted brain samples. Theoretically, when all CCGG sites are not methylated, the ratio of HpaII/MspI is close to 1, whereas the ratio is expected to be close to 0 when all sites are methylated. To test the accuracy of the methods, we used samples containing various amounts of methylated and unmethylated genomic DNA as standard samples. Values are mean ± SD.
Next, we quantified DNA methylation levels of four CpG sites of the long interspersed nuclear element 1 (LINE-1) retrotransposable elements and found that all samples were highly methylated and were not statistically different across samples (Supplemental Fig. 1).
Quantification of site-specific DNA methylation
We then performed DNA methylation analysis using the Illumina GoldenGate assay (Bibikova et al. 2006). To gain insight into the extent of the evolutionary conservation of the epigenetic signature in the human brain, we included genomic DNA derived from the bulk cortex of chimpanzees.
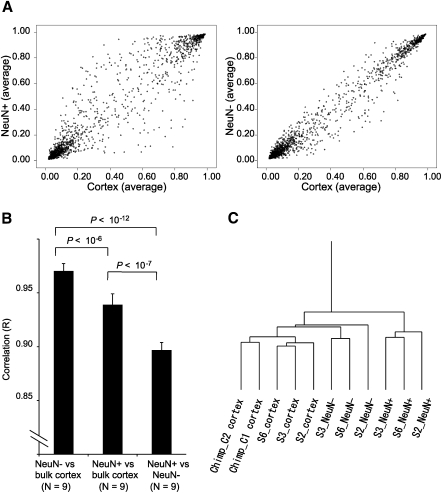
Consistent with a previous report (Ladd-Acosta et al. 2007), unbiased clustering analysis revealed that DNA methylation profiles were markedly different between bulk human cortical and bulk cerebellum samples (Supplemental Fig. 2A). Whereas NeuN− samples were closely clustered together with bulk cortical samples, NeuN+ samples were distinct from bulk cortex samples. Consistent with this result, scatter plotting of the average methylation level of three subjects and statistical analyses illustrated that NeuN− samples have stronger correlation with bulk cortex samples compared with NeuN+ samples (Fig. 3A,B). These findings suggest that DNA methylation patterns observed using bulk cortex largely reflect non-neuronal cells, and neurons show a unique DNA methylation pattern that cannot be assessed using bulk cortex.
Figure 3.
Differential epigenetic signatures between neuronal and non-neuronal nuclei and evolutionary conservation of methylation status. The assay allowed quantification of DNA methylation levels at 1505 individual CpG sites chosen from 807 genes (Bibikova et al. 2006). (A) Scatter-plot of average methylation levels of the 1505 CpG sites. (B) Statistical comparison of correlation. Values are mean ± SD. (C) Hierarchical clustering based on the 833 CpG sites that showed an identical sequence with regard to the probe region between human and chimpanzee.
We also found that the epigenetic signature in the prefrontal cortex appeared to be highly conserved between two species (Fig. 3C), although there were some exceptions (Supplemental Fig. 2B; Supplemental Table 3; Supplemental notes).
DNA methylation analysis using the promoter tiling array
We then examined the DNA methylation status of the promoter regions of about 22,000 human genes using the Affymetrix promoter tiling array, which covers about 8 kb upstream and 2 kb downstream from the first exon of each gene. We used MBD2b-conjugated beads (MBD2-beads) to retrieve methylated DNA fragments, which was similar to the previously reported method (Rauch et al. 2006; Supplemental Fig. 3).
Extracting methylated regions
After the identification of methylated regions (MRs) in each sample (Supplemental Fig. 4; Supplemental notes) using model-based analysis of tiling-arrays (MAT) software (Johnson et al. 2006), we identified MRs that were shared by either all neuronal samples (neuronal MRs), non-neuronal samples (non-neuronal MRs), or both samples (common MRs) in all three subjects (Supplemental Fig. 3). It should be noted that this was a conservative and robust approach to exclude the regions whose methylation levels showed interindividual variation due to sequence variation or stochastic DNA methylation (or both) in the initial analysis. Consequently, we identified a total of 834, 1049, and 660 MRs as neuronal, non-neuronal, and common, respectively (Supplemental Tables 4–6).
Validation of tiling array results
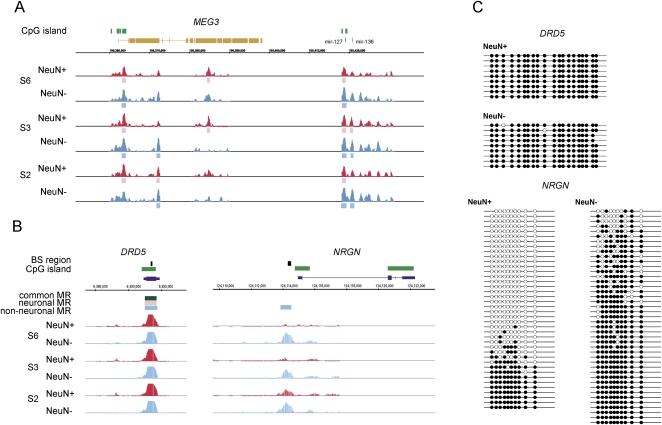
To validate the MRs, we surveyed the DNA methylation status of known imprinted genes. As expected, the regions around some of the imprinted genes showed clear DNA methylation signals (Fig. 4A; Supplemental Fig. 5). Next, we compared the DNA methylation status with gene-expression level using gene-expression profile in a large set of control subjects (Iwamoto et al. 2005a). As expected, the genes with common MRs in the CpG island are silenced (Supplemental Fig. 6; Supplemental note). We then performed DNA methylation analysis using a different tiling-array platform, the NimbleGen promoter tiling array, and confirmed the consistency of the detected MRs (Supplemental notes). Finally, a subset of the common MRs and differential MRs were confirmed by extensive bisulfite sequencing analysis (Fig. 4C; Supplemental Fig. 7).
Figure 4.
Promoter tiling array analysis. (A) Example of results of the methylation status of the imprinted gene, MEG3, and (B) commonly (DRD5, dopamine receptor 5) or differentially (NRGN, neurogranin) methylated genes. Exon structure of the MEG3 is illustrated in a collapsed manner. Individual MRs detected by the MAT analysis are shown in pink (neuronal) or light blue (non-neuronal) bars. Common MRs are shown in dark green. Supplemental Figure 5 shows the methylation status of other imprinted genes. (C) The results of bisulfite sequencing of DRD5 and NRGN. Our bisulfite sequencing analysis excluded the possibility that tiling array signals are derived from DRD5 pseudogenes. In addition, their methylation levels were separately analyzed (data not shown).
Ontology analysis of the genes associated with MRs
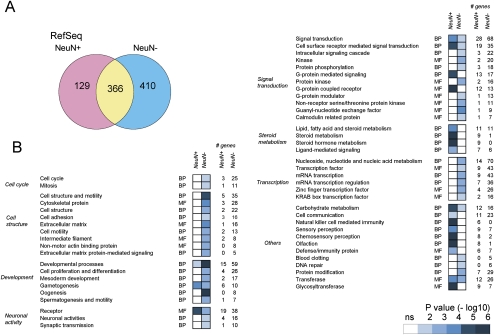
We searched the genes located close to the MRs (within 10 kb upstream and downstream from the MR). We found that 129, 410, and 366 RefSeq genes were associated with neuronal, non-neuronal, and common MRs, respectively (Fig. 5A; Supplemental Tables 7–9). Through the PANTHER (protein analysis through evolutionary relationship) ontology analysis (Thomas et al. 2003), we found the over-representation of neuronal activity-related categories in the genes associated with non-neuronal MRs among the wide-ranging differences (Fig. 5B). They included a number of genes that have an important role in neuronal function, such as NRXN1, DMD, DNAJC5, ITPR1, CARTPT (also known as CART), MADD, CNTNAP1, SRR, GABBR1, CAMKK1, DLGAP1, TIAM2, DLGAP2, INPP5A, and HTR1D. For example, post-synaptic density proteins such as DLGAP1 and DLGAP2 interact with NMDA receptors and potassium channels in neurons (Kim et al. 1997). CAMKK1 encodes a serine/threonine kinase that phosphorylates the calcium/calmodulin kinases that are involved in neuronal gene expression. CNTNAP1 encodes an axonal protein important for cell–cell communication between neurons and glias (Peles et al. 1997). Focusing on the neuronal activity-related genes, we confirmed differential DNA methylation status by bisulfite sequencing analysis (Supplemental Fig. 7). The Supplemental notes contain further discussions about ontology analysis.
Figure 5.
Ontology and expression analysis of the genes associated with DNA methylation. (A) Venn diagrams of the RefSeq genes associated with MRs. Supplemental Tables 7–9 list the genes. (B) PANTHER ontology analysis of the genes associated with neuronal and non-neuronal MRs. The ontology terms are arbitrarily grouped based on their functions. (ns) Not significant; (BP) biologic process; (MF) molecular function.
Transcription factor (TF)–binding sites in the MR
Through the computational search of TF–binding sites (Cartharius et al. 2005), we examined whether they are over-represented in the MRs (Supplemental Fig. 8; Supplemental notes). We found that binding sites in the CREB family were enriched in both neuronal-specific and non-neuronal-specific MRs. In non-neuronal nuclei, binding sites of the HIFF family were over-represented. The HIFF family not only includes hypoxia-inducible factors, but also TFs related to circadian rhythm, such as ARNTL (BMAL1), CLOCK, and NPAS1 (Supplemental note). In neuronal cells, we found the over-representation of PAX3 family binding sites. This family included PAX3 and PAX7, both of which are important for glial gene expression, which is consistent with the silencing of glial genes in neurons. At the RefSeq gene level, a total of 82 and 340 genes contained CREB family binding sites in neuronal and non-neuronal MR-associated genes, respectively. In addition, 49 neuronal MR-associated genes contained PAX3 family binding sites, and 265 non-neuronal MR-associated genes contained HIFF family binding sites.
Module membership analysis of MR-associated genes
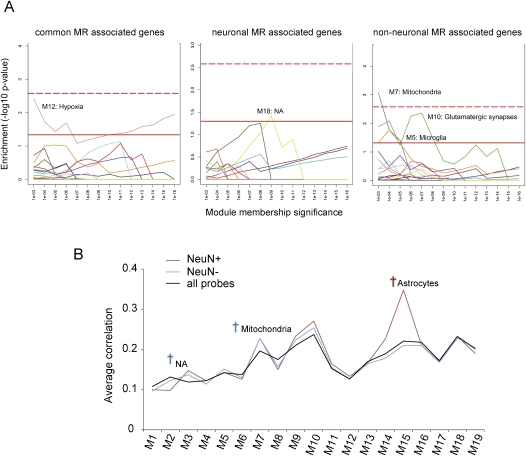
We previously revealed the functional organization of the transcriptome in the human brain (Oldham et al. 2008). By analyzing gene coexpression relationships, we identified modules of coexpressed genes corresponding to basic functional aspects of brain function, such as major cell types (e.g., neurons, oligodendrocytes, and astrocytes), as well as those corresponding to other functional characteristics such as mitochondria and hypoxia. We analyzed whether genes associated with MR are enriched within specific modules. We found that genes associated with common MRs are enriched in a module related to hypoxia (Fig. 6A). Genes associated with non-neuronal MRs showed enrichment in modules related to mitochondria, glutamatergic synapses, and microglia, consistent with silencing of neuronal genes in non-neurons. On the other hand, those associated with neuronal MRs showed enrichment in a module that was not well characterized. Although none passed multiple testing corrections except for the module related to mitochondria in non-neuronal cells, most of module enrichment was repeatedly detected across different levels of module membership significance.
Figure 6.
Module membership analysis of the genes associated with MRs. (A) Enrichment analysis for modules of coexpressed genes. Each color indicates one of 19 coexpression modules that was previously identified in the human cortical transcriptome (Oldham et al. 2008). Each module was examined at various levels of module membership significance, with the P-values on the x-axis corresponding to the maximum significance thresholds for the Pearson correlation between the expression level of a gene and a module's eigengene (i.e., the first principal component obtained by singular value decomposition). The significance of enrichment was calculated for each level of module membership using the Fisher exact test (y-axis). The red line indicates significance at P < 0.05, whereas the red dotted line indicates significant enrichment after applying a Bonferroni correction for multiple comparisons. (B) Average correlation analysis. Average correlation between each module eigengene (Oldham et al. 2008) and the expression levels of genes associated with neuronal MR (NeuN+), non-neuronal MR (NeuN−), and all brain-expressed genes (all probes). Dagger indicates significant difference (P < 0.05, one-way ANOVA, followed by the Dunnet test using all brain-expressed genes [Iwamoto et al. 2005a] as reference). (NA) Functional characteristics were not assigned to that module.
We then assessed the expression similarity of genes associated with neuronal or non-neuronal MRs to the eigengene (principal component of a module) of each module (Fig. 6B). We found that expression of genes associated with neuronal MRs showed significantly increased correlation to the eigengenes of astrocyte-related modules, compared with all brain-expressed probe sets. This also fits with the notion that the expression of astrocyte genes, which is suppressed by methylation, is turned off in neurons. We also found that expression of genes associated with non-neuronal MRs showed significantly higher correlation to the eigengenes of mitochondria-related modules compared with all brain-expressed probe sets.
Neuronal samples showed higher interindividual variation than non-neuronal samples
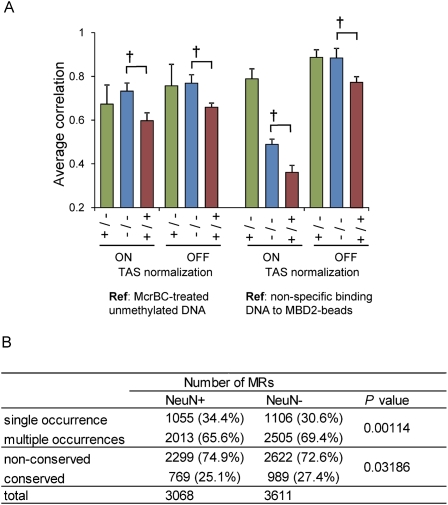
We next assessed the interindividual variation of the promoter DNA methylation pattern. A pairwise comparison of the intensities of all tiling array probes resulted in significantly lower correlation in NeuN+ compared with NeuN−. We confirmed that the data normalization procedure did not affect these results, and we also confirmed that the type of reference samples did not affect the results by using a different reference data set (Fig. 7A). Consistent with this, we found that the ratio of MRs identified in only one subject was significantly higher in neuronal cells, and the ratio of conserved MRs was lower in neuronal cells compared with non-neuronal cells (Fig. 7B).
Figure 7.
Variations in neuronal and non-neuronal methylation. (A) Average correlation of pairwise comparisons of signal intensities of all probes on the tiling array. Green bars indicate the average correlation coefficient between NeuN+ and NeuN− samples from the same subject (n = three pairs). Blue and red bars indicate the average correlation coefficient between NeuN− samples (n = six combinations) and between NeuN+ samples (n = six combinations), respectively. The dagger indicates P < 0.05 by the Student's t-test. Values are mean ± SD. (B) Interindividual variations of the location of neuronal and non-neuronal MRs. Number of MRs detected in various conditions are shown. Single occurrence: MRs found in only one subject. Multiple occurrences: MRs shared by two or all subjects. Nonconserved: MRs in one subject or shared by two subjects. Conserved: MRs shared by all subjects. P-values are determined by the Fisher exact test. Note that the number of shared MRs in three subjects differed from that represented in the text because of the exclusion of common MRs from every individual MR for this analysis (Supplemental Fig. 3).
To confirm these findings, we also performed a similar analysis using an independent sample set containing 24 male brain samples (Supplemental Table 11). We found that the number of neuronal or non-neuronal MRs was not significantly correlated with age, post-mortem interval, or brain pH (data not shown). In this sample set, we confirmed the lower number of MRs in NeuN+ compared with NeuN− (P = 0.031 in paired t-test).
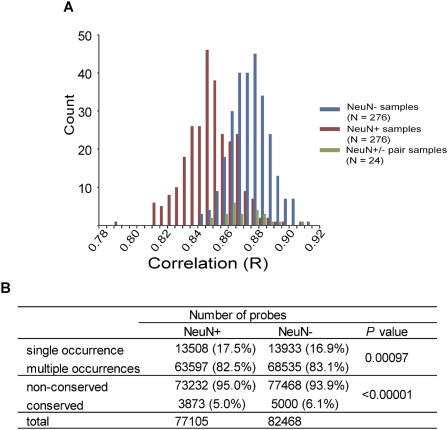
We then calculated a pairwise correlation of the intensities of all tiling array probes (Fig. 8A). We found that correlation was significantly lower in NeuN+ samples (average R = 0.850) compared with NeuN− samples (average R = 0.875, P = 6.4 × 10−71 by the Student's t-test; normalization off). This was not affected by the effect of the data processing procedure (P = 5.7 × 10−70; normalization on). The DNA methylation pattern of NeuN+ nuclei in an individual was more similar to the NeuN− nuclei of the same individual (average R = 0.859) compared with NeuN+ nuclei of other individuals (P = 9.1 × 10⁻¹⁰). This also rules out the possibility of different data quality between neuronal and non-neuronal fractions (Fig. 8A). Similar to the initial sample set, we then examined the ratio of MRs of neuronal cells compared with non-neurons. As expected, we found that the ratio of MRs identified in only one subject was significantly higher, and that of conserved MRs was lower in neuronal cells compared with non-neuronal cells (Fig. 8B).
Figure 8.
Confirmation of higher variations in neurons compared with non-neurons. (A) Histogram of correlation determined in independent samples (n = 24 male control subjects). Pairwise correlation coefficients were plotted. Red, blue, and green bars indicate comparison between NeuN+ samples, between NeuN− samples, and between NeuN+ and NeuN− from the same subject, respectively. (B) Interindividual variations of the location of neuronal and non-neuronal MRs. Single occurrence: methylated probes found in one subject. Multiple occurrences: methylated probes shared by more than two subjects. Nonconserved: methylated probes in one subject or shared by up to 23 subjects. Conserved: MRs methylated probes shared by all subjects. P-values are determined by the Fisher exact test.
We then searched the most variably methylated regions (VMRs) in neuronal nuclei and identified 23 candidate regions (Supplemental Fig. 9A). We performed validation analysis by quantitative polymerase chain reaction (Q-PCR) about three arbitrarily chosen VMRs (Supplemental Fig. 9B). Most of them were located within the gene and contained short repeatlike regions. However, some of the VMRs may be functional. As an example, the DNA methylation level of SMYD3, which encodes a histone methyltransferase expressed in several neural tissues, was significantly correlated with its gene-expression level (Supplemental Fig. 9C).
Discussion
To deal with the complexity of cell types in the brain, we separated the brain cells into neuronal and non-neuronal nuclei. Although both fractions were still expected to be heterogeneous, we expected to extract common DNA methylation characteristics in neuronal and non-neuronal nuclei in the current study. A similar approach was previously successfully applied to the other studies (Rehen et al. 2005; Spalding et al. 2005; Siegmund et al. 2007; Cheung et al. 2010). In the present study, we found that neuronal nuclei show differential and distinctive DNA methylation patterns compared with non-neuronal nuclei in that they show (1) low global DNA methylation; (2) distinctive DNA methylation signatures; (3) distinctive and functional DNA methylation differences in the promoter regions, which were supported by ontology, module membership, and TF–binding site analyses, and (4) high interindividual variations.
We found a lower global DNA methylation in neuronal nuclei compared with bulk cortex. It should be noted that LUMA assesses the methylation level of the CCGG sites, which is known to distribute nonuniformly in the human genome. Despite this limitation, our finding is also supported by the results of tiling-array experiments of the lower number of MRs in neuronal nuclei compared with non-neuronal nuclei. In contrast, we did not find significant differences in the LINE-1 DNA methylation levels. Taken together, we suggest that global hypomethylation in neuronal nuclei occurs at the nonrepetitive genomic sequences in the human genome. Given that hypomethylation of specific LINE-1 sequence in the adult brain compared with other tissues (Coufal et al. 2009), examining the DNA methylation level of a more specific LINE-1 subfamily would be interesting.
It should be noted that our array data may include false-negative results because of several technical factors. First, probe density and design of tiling array directly determine what region we can see. Second, because we used MBD2b to enrich methylated DNA, low methylated regions (in terms of the DNA fragments) cannot be considered. Third, there are inevitable biases during sample amplification for tiling array, such as low coverage of higher GC-rich regions. Fourth, we took a stringent bioinformatic approach to extract MRs. For example, we extracted common MRs only when all samples showed consistent methylation signals to focus on the most rigorous methylation signals. However, our main conclusions are not likely to be affected, because both nuclei fractions are identically influenced by these factors.
We found that the DNA methylation status in the promoter region of neuronal nuclei showed higher interindividual variations compared with non-neuronal nuclei. Although we identified the VMRs, which may have functional significance in the brain, our analysis suggests that these variations are accounted for by the accumulation of subtle methylation changes in a promoter-wide manner (Figs. 7, 8). Our finding is consistent with previous cellular and animal studies, in which researchers reported altered DNA methylation in neurons with neuroplastic changes (Levenson et al. 2006; Nelson et al. 2008; Feng et al. 2010). This finding is also consistent with the reported DNA methylation changes of neurons throughout life (Siegmund et al. 2007). In addition to these environment- or development-induced epigenetic changes, several possibilities may contribute to the higher variations of DNA methylation within neurons. First, our NeuN+ fraction included several classes of neuronal cell types. If each cell type has a distinctive DNA methylation pattern, interindividual variation of the fraction of neuronal cell types may affect the observed variation. Second, recently discovered hydroxymethyl cytosine (hmc) (Kriaucionis and Heintz 2009; Tahiliani et al. 2009), which exists abundantly in the brain, may also generate the cell type–specific differences. Because MBD2b does not bind to hmc (Jin et al. 2010), variation of hmc content may affect the results. Third, genomic variations within neurons (Muotri and Gage 2006), including retrotransposition of LINE-1 element in neuronal cells and neuronal aneuploidy, may also generate epigenetic variations. Further epigenome and genomic analyses of neurons will be needed to clarify the role of each factor. In addition, it would be valuable to study the neuronal DNA methylation status of a larger number of subjects of various ages and of diseased subjects using high-throughput sequencing technologies.
Methods
Human and chimpanzee post-mortem brains
Post-mortem prefrontal cortex and cerebellum samples were obtained from the same three Japanese male subjects. They did not suffer from neurologic or psychiatric diseases (Supplemental Table 1). To confirm interindividual variations in neuronal and non-neuronal samples we used 24 healthy, unrelated male subjects (Broadmann area 10), provided by the Stanley Medical Research Institute. Supplemental Table 11 presents the demographic variables. Post-mortem prefrontal cortex samples from two chimpanzees were obtained through the Great Ape Information Network (GAIN) project in Japan. The apes died of natural causes at Japanese zoos. This study was approved by the ethics committees of RIKEN.
NeuN labeling and nuclei sorting
After nuclei preparation from post-mortem brains (Supplemental Methods), 1 μg of anti-NeuN antibodies (#MAB377, Chemicon) was directly conjugated with Alexa Fluor 488 using a Zenon Alexa Fluor 488 mouse IgG labeling kit (Molecular Probes) according to the manufacturer's instructions. Isolated nuclei were blocked with a STKM buffer containing 2.5% bovine serum albumin (BSA) for 2 h at 4°C. They were stained with Alexa Fluor 488-conjugated NeuN antibodies in a STKM buffer containing 2.5% BSA at 4°C, with gentle shaking overnight. After nuclei samples were diluted to five times the volume of STKM buffer, NeuN+ and NeuN− nuclei were sorted by either FACS Vantage or FACS Aria (BD). Before fractionation, debris was removed based on scatter plotting of forward scatter area/side scatter area (FSC-A/SSC-A), and doublets were removed based on scatter plotting of FSC-H (height)/FSC-W (width), followed by SSC-H/SSC-W, respectively.
LUMA and LINE-1 assay
To quantify the global DNA methylation level, LUMA (Karimi et al. 2006) was used. In brief, a total of 200 ng of genomic DNA was digested with EcoRI and either HpaII or MspI. After enzyme digestion, primer extension luciferase assay using PSQ96MA system (Biotage) was performed.
To quantify the LINE-1 DNA methylation, we amplified the CpG sites in the LINE-1 sequences using bisulfite-modified genomic DNA as a template, according to the manufacturer's protocol (PyroMark LINE-1, Biotage) (Yang et al. 2004).
To test the accuracy of the pyrosequencing methods, we used samples containing various amounts of methylated and unmethylated human genome DNA. Unmethylated human genomic DNA was prepared by whole-genome amplification using a GenomiPhiv2 kit (GE Healthcare). Aliquots of purified unmethylated genomic DNA were treated with the CpG methyltransferase, SssI, for 4 h at 37°C. The reaction mixture was purified with MinElute Reaction column, yielding methylated genomic DNA.
The Supplemental Methods provide details for the Illumina GoldenGate assay and pyrosequencing.
Bisulfite modification and cloning–PCR analysis
Typically, 1 μg of genomic DNA was used for bisulfite modification. Reaction and subsequent purification were performed using an EpiTect Bisulfite kit (Qiagen) according to the manufacturer's protocol. PCR primers were designed using MethPrimer (Li and Dahiya 2002) as listed in Supplemental Table 10. PCR was performed based on the previously determined condition (Tochigi et al. 2008). Details of the PCR condition in each gene are available on request. After the separation by Agarose gel electrophoresis, PCR products were excised and purified using an MinElute Gel extraction kit (Qiagen). Products were then TA cloned using a TOPO TA cloning kit (Invitrogen) and DH5α bacterial strain. Single bacterial colonies were subject to sequencing analysis. Results are illustrated using QUMA software (Kumaki et al. 2008).
Enrichment of methylated fraction
Enrichment of methylated DNA was performed using MethylCollector (Active Motif) according to the manufacturer's protocol (see Supplemental Methods). For reference, we prepared two types of DNA samples. First, we prepared McrBC-digested unmethylated DNA, which was extracted from each sorting fraction of the relevant subjects. We also prepared DNA fragments that were not specifically bound to the beads. These were also prepared from the relevant subjects. In each subject, we performed triplicate experiments (three independent MBD2-bead treatments) in both target and reference samples.
Tiling arrays
We used an Affymetrix human promoter 1.0R tiling array and a NimbleGen HG18 CpG promoter array. Probe preparation and labeling were performed according to the Affymetrix chromatin immunoprecipitation assay protocol (Affymetrix), with minor modification (see Supplemental Methods). Tiling array data are available under the accession GSE15014.
Data analysis
We used triplicate samples and triplicate references in each subject for MAT analysis (Johnson et al. 2006) to extract methylated peaks. Parameters used in the MAT analysis were as follows: bandwidth, 300; max gap, 300; minimum number of probes, 10. We considered P < 10−4 to be significant. The Supplemental Methods describe and provide details on data analysis and other bioinformatic analyses.
Analysis of independent brain samples
To estimate interindividual variation of NeuN+ and NeuN− samples, we used 24 well-defined male post-mortem brain samples provided by the Stanley Medical Research Institute (Supplemental Table 11). In each fresh-frozen sample, tiling array analysis was similarly performed as described above with some modifications. Instead of using restriction enzymes, fragmentation was performed with an acoustic solubilizer (Covaris). Methylated DNA was enriched using a MethylCollector Ultra kit (Active Motif). All analyses were performed in duplicate. Parameters used in the MAT and TAS analyses were the same as described above, but we considered P < 10−3 to be significant in MAT analysis.
Acknowledgments
This study was supported by a Grant-in-Aid from the Japanese Ministry of Health, Welfare, and Labor, and RIKEN Director's Funds. Post-mortem brains were donated by the Stanley Microarray Collection, courtesy of Drs. Michael B. Knable, E. Fuller Torrey, Maree J. Webster, and Robert H. Yolken. We thank the Kyoto City Zoo and Beppu Jigokudani for providing post-mortem chimpanzee brains. These samples were provided through the Great Ape Information Network (GAIN). We thank Dr. Jerold Chun (Scripps Research Institute) for valuable advice on cell sorting. We are indebted to the Research Resource Center at the RIKEN Brain Science Institute for the cell sorting and tiling array analysis. We also thank Taeko Miyauchi, Atsuko Komori-Kokubo, Yoko Nakano at our Institute, and Yumiko Ishii at the FACS Core Laboratory, University of Tokyo, for support of cell sorting.
Footnotes
[Supplemental material is available for this article. The microarray data from this study have been submitted to the NCBI Gene Expression Omnibus (GEO) (http://www.ncbi.nlm.nih.gov/geo) under accession no. GSE15014.]
Article published online before print. Article, supplemental material, and publication date are at http://www.genome.org/cgi/doi/10.1101/gr.112755.110.
References
- Bibikova M, Lin Z, Zhou L, Chudin E, Garcia EW, Wu B, Doucet D, Thomas NJ, Wang Y, Vollmer E, et al. 2006. High-throughput DNA methylation profiling using universal bead arrays. Genome Res 16: 383–393 [DOI] [PMC free article] [PubMed] [Google Scholar]
- Bird A 2002. DNA methylation patterns and epigenetic memory. Genes Dev 16: 6–21 [DOI] [PubMed] [Google Scholar]
- Borrelli E, Nestler EJ, Allis CD, Sassone-Corsi P 2008. Decoding the epigenetic language of neuronal plasticity. Neuron 60: 961–974 [DOI] [PMC free article] [PubMed] [Google Scholar]
- Brown SE, Weaver IC, Meaney MJ, Szyf M 2008. Regional-specific global cytosine methylation and DNA methyltransferase expression in the adult rat hippocampus. Neurosci Lett 440: 49–53 [DOI] [PubMed] [Google Scholar]
- Cartharius K, Frech K, Grote K, Klocke B, Haltmeier M, Klingenhoff A, Frisch M, Bayerlein M, Werner T 2005. MatInspector and beyond: promoter analysis based on transcription factor binding sites. Bioinformatics 21: 2933–2942 [DOI] [PubMed] [Google Scholar]
- Chahrour M, Zoghbi HY 2007. The story of Rett syndrome: from clinic to neurobiology. Neuron 56: 422–437 [DOI] [PubMed] [Google Scholar]
- Chen WG, Chang Q, Lin Y, Meissner A, West AE, Griffith EC, Jaenisch R, Greenberg ME 2003. Derepression of BDNF transcription involves calcium-dependent phosphorylation of MeCP2. Science 302: 885–889 [DOI] [PubMed] [Google Scholar]
- Cheung I, Shulha HP, Jiang Y, Matevossian A, Wang J, Weng Z, Akbarian S 2010. Developmental regulation and individual differences of neuronal H3K4me3 epigenomes in the prefrontal cortex. Proc Natl Acad Sci 107: 8824–8829 [DOI] [PMC free article] [PubMed] [Google Scholar]
- Coufal NG, Garcia-Perez JL, Peng GE, Yeo GW, Mu Y, Lovci MT, Morell M, O'Shea KS, Moran JV, Gage FH 2009. L1 retrotransposition in human neural progenitor cells. Nature 460: 1127–1131 [DOI] [PMC free article] [PubMed] [Google Scholar]
- Feinberg AP 2007. Phenotypic plasticity and the epigenetics of human disease. Nature 447: 433–440 [DOI] [PubMed] [Google Scholar]
- Feng J, Zhou Y, Campbell SL, Le T, Li E, Sweatt JS, Silva AJ, Fan G 2010. Dnmt1 and Dnmt3a maintain DNA methylation and regulate synaptic function in adult forebrain neurons. Nat Neurosci 13: 423–430 [DOI] [PMC free article] [PubMed] [Google Scholar]
- Iwamoto K, Bundo M, Kato T 2005a. Altered expression of mitochondria-related genes in postmortem brains of patients with bipolar disorder or schizophrenia, as revealed by large-scale DNA microarray analysis. Hum Mol Genet 14: 241–253 [DOI] [PubMed] [Google Scholar]
- Iwamoto K, Bundo M, Yamada K, Takao H, Iwayama-Shigeno Y, Yoshikawa T, Kato T 2005b. DNA methylation status of SOX10 correlates with its downregulation and oligodendrocyte dysfunction in schizophrenia. J Neurosci 25: 5376–5381 [DOI] [PMC free article] [PubMed] [Google Scholar]
- Jiang Y, Langley B, Lubin FD, Renthal W, Wood MA, Yasui DH, Kumar A, Nestler EJ, Akbarian S, Beckel-Mitchener AC 2008. Epigenetics in the nervous system. J Neurosci 28: 11753–11759 [DOI] [PMC free article] [PubMed] [Google Scholar]
- Jin SG, Kadam S, Pfeifer GP 2010. Examination of the specificity of DNA methylation profiling techniques towards 5-methylcytosine and 5-hydroxymethylcytosine. Nucleic Acids Res 38: e125 doi: 10.1093/nar/gkq223 [DOI] [PMC free article] [PubMed] [Google Scholar]
- Johnson WE, Li W, Meyer CA, Gottardo R, Carroll JS, Brown M, Liu XS 2006. Model-based analysis of tiling-arrays for ChIP-chip. Proc Natl Acad Sci 103: 12457–12462 [DOI] [PMC free article] [PubMed] [Google Scholar]
- Karimi M, Johansson S, Ekstrom TJ 2006. Using LUMA: a Luminometric-based assay for global DNA-methylation. Epigenetics 1: 45–48 [DOI] [PubMed] [Google Scholar]
- Keller S, Sarchiapone M, Zarrilli F, Videtic A, Ferraro A, Carli V, Sacchetti S, Lembo F, Angiolillo A, Jovanovic N, et al. 2010. Increased BDNF promoter methylation in the Wernicke area of suicide subjects. Arch Gen Psychiatry 67: 258–267 [DOI] [PubMed] [Google Scholar]
- Kim E, Naisbitt S, Hsueh YP, Rao A, Rothschild A, Craig AM, Sheng M 1997. GKAP, a novel synaptic protein that interacts with the guanylate kinase-like domain of the PSD-95/SAP90 family of channel clustering molecules. J Cell Biol 136: 669–678 [DOI] [PMC free article] [PubMed] [Google Scholar]
- Kriaucionis S, Heintz N 2009. The nuclear DNA base 5-hydroxymethylcytosine is present in Purkinje neurons and the brain. Science 324: 929–930 [DOI] [PMC free article] [PubMed] [Google Scholar]
- Kumaki Y, Oda M, Okano M 2008. QUMA: quantification tool for methylation analysis. Nucleic Acids Res 36: W170–W175 [DOI] [PMC free article] [PubMed] [Google Scholar]
- Ladd-Acosta C, Pevsner J, Sabunciyan S, Yolken RH, Webster MJ, Dinkins T, Callinan PA, Fan JB, Potash JB, Feinberg AP 2007. DNA methylation signatures within the human brain. Am J Hum Genet 81: 1304–1315 [DOI] [PMC free article] [PubMed] [Google Scholar]
- Levenson JM, Roth TL, Lubin FD, Miller CA, Huang IC, Desai P, Malone LM, Sweatt JD 2006. Evidence that DNA (cytosine-5) methyltransferase regulates synaptic plasticity in the hippocampus. J Biol Chem 281: 15763–15773 [DOI] [PubMed] [Google Scholar]
- Li LC, Dahiya R 2002. MethPrimer: designing primers for methylation PCRs. Bioinformatics 18: 1427–1431 [DOI] [PubMed] [Google Scholar]
- Martinowich K, Hattori D, Wu H, Fouse S, He F, Hu Y, Fan G, Sun YE 2003. DNA methylation-related chromatin remodeling in activity-dependent BDNF gene regulation. Science 302: 890–893 [DOI] [PubMed] [Google Scholar]
- Maze I, Covington HE 3rd, Dietz DM, LaPlant Q, Renthal W, Russo SJ, Mechanic M, Mouzon E, Neve RL, Haggarty SJ, et al. 2010. Essential role of the histone methyltransferase G9a in cocaine-induced plasticity. Science 327: 213–216 [DOI] [PMC free article] [PubMed] [Google Scholar]
- Meaney MJ, Szyf M 2005. Maternal care as a model for experience-dependent chromatin plasticity?. Trends Neurosci 28: 456–463 [DOI] [PubMed] [Google Scholar]
- Mill J, Tang T, Kaminsky Z, Khare T, Yazdanpanah S, Bouchard L, Jia P, Assadzadeh A, Flanagan J, Schumacher A, et al. 2008. Epigenomic profiling reveals DNA-methylation changes associated with major psychosis. Am J Hum Genet 82: 696–711 [DOI] [PMC free article] [PubMed] [Google Scholar]
- Miller CA, Sweatt JD 2007. Covalent modification of DNA regulates memory formation. Neuron 53: 857–869 [DOI] [PubMed] [Google Scholar]
- Mullen RJ, Buck CR, Smith AM 1992. NeuN, a neuronal specific nuclear protein in vertebrates. Development 116: 201–211 [DOI] [PubMed] [Google Scholar]
- Muotri AR, Gage FH 2006. Generation of neuronal variability and complexity. Nature 441: 1087–1093 [DOI] [PubMed] [Google Scholar]
- Nelson ED, Kavalali ET, Monteggia LM 2008. Activity-dependent suppression of miniature neurotransmission through the regulation of DNA methylation. J Neurosci 28: 395–406 [DOI] [PMC free article] [PubMed] [Google Scholar]
- Oldham MC, Konopka G, Iwamoto K, Langfelder P, Kato T, Horvath S, Geschwind DH 2008. Functional organization of the transcriptome in human brain. Nat Neurosci 11: 1271–1282 [DOI] [PMC free article] [PubMed] [Google Scholar]
- Peles E, Nativ M, Lustig M, Grumet M, Schilling J, Martinez R, Plowman GD, Schlessinger J 1997. Identification of a novel contactin-associated transmembrane receptor with multiple domains implicated in protein-protein interactions. EMBO J 16: 978–988 [DOI] [PMC free article] [PubMed] [Google Scholar]
- Rauch T, Li H, Wu X, Pfeifer GP 2006. MIRA-assisted microarray analysis, a new technology for the determination of DNA methylation patterns, identifies frequent methylation of homeodomain-containing genes in lung cancer cells. Cancer Res 66: 7939–7947 [DOI] [PubMed] [Google Scholar]
- Rehen SK, Yung YC, McCreight MP, Kaushal D, Yang AH, Almeida BS, Kingsbury MA, Cabral KM, McConnell MJ, Anliker B, et al. 2005. Constitutional aneuploidy in the normal human brain. J Neurosci 25: 2176–2180 [DOI] [PMC free article] [PubMed] [Google Scholar]
- Siegmund KD, Connor CM, Campan M, Long TI, Weisenberger DJ, Biniszkiewicz D, Jaenisch R, Laird PW, Akbarian S 2007. DNA methylation in the human cerebral cortex is dynamically regulated throughout the life span and involves differentiated neurons. PLoS ONE 2: e895 doi- 10.1371/journal.pone.0000895 [DOI] [PMC free article] [PubMed] [Google Scholar]
- Spalding KL, Bhardwaj RD, Buchholz BA, Druid H, Frisen J 2005. Retrospective birth dating of cells in humans. Cell 122: 133–143 [DOI] [PubMed] [Google Scholar]
- Tahiliani M, Koh KP, Shen Y, Pastor WA, Bandukwala H, Brudno Y, Agarwal S, Iyer LM, Liu DR, Aravind L, et al. 2009. Conversion of 5-methylcytosine to 5-hydroxymethylcytosine in mammalian DNA by MLL partner TET1. Science 324: 930–935 [DOI] [PMC free article] [PubMed] [Google Scholar]
- Takizawa T, Nakashima K, Namihira M, Ochiai W, Uemura A, Yanagisawa M, Fujita N, Nakao M, Taga T 2001. DNA methylation is a critical cell-intrinsic determinant of astrocyte differentiation in the fetal brain. Dev Cell 1: 749–758 [DOI] [PubMed] [Google Scholar]
- Thomas PD, Campbell MJ, Kejariwal A, Mi H, Karlak B, Daverman R, Diemer K, Muruganujan A, Narechania A 2003. PANTHER: A library of protein families and subfamilies indexed by function. Genome Res 13: 2129–2141 [DOI] [PMC free article] [PubMed] [Google Scholar]
- Tochigi M, Iwamoto K, Bundo M, Komori A, Sasaki T, Kato N, Kato T 2008. Methylation status of the reelin promoter region in the brain of schizophrenic patients. Biol Psychiatry 63: 530–533 [DOI] [PubMed] [Google Scholar]
- Tsankova N, Renthal W, Kumar A, Nestler EJ 2007. Epigenetic regulation in psychiatric disorders. Nat Rev Neurosci 8: 355–367 [DOI] [PubMed] [Google Scholar]
- Weaver IC, Cervoni N, Champagne FA, D'Alessio AC, Sharma S, Seckl JR, Dymov S, Szyf M, Meaney MJ 2004. Epigenetic programming by maternal behavior. Nat Neurosci 7: 847–854 [DOI] [PubMed] [Google Scholar]
- Wilkinson LS, Davies W, Isles AR 2007. Genomic imprinting effects on brain development and function. Nat Rev Neurosci 8: 832–843 [DOI] [PubMed] [Google Scholar]
- Yang AS, Estecio MR, Doshi K, Kondo Y, Tajara EH, Issa JP 2004. A simple method for estimating global DNA methylation using bisulfite PCR of repetitive DNA elements. Nucleic Acids Res 32: e38 doi: 10.1093/nar/gnh032 [DOI] [PMC free article] [PubMed] [Google Scholar]
- Zhao X, Ueba T, Christie BR, Barkho B, McConnell MJ, Nakashima K, Lein ES, Eadie BD, Willhoite AR, Muotri AR, et al. 2003. Mice lacking methyl-CpG binding protein 1 have deficits in adult neurogenesis and hippocampal function. Proc Natl Acad Sci 100: 6777–6782 [DOI] [PMC free article] [PubMed] [Google Scholar]


