Abstract
We performed a genome-wide analysis of transcriptional start sites (TSSs) in human genes by multifaceted use of a massively parallel sequencer. By analyzing 800 million sequences that were obtained from various types of transcriptome analyses, we characterized 140 million TSS tags in 12 human cell types. Despite the large number of TSS clusters (TSCs), the number of TSCs was observed to decrease sharply with increasing expression levels. Highly expressed TSCs exhibited several characteristic features: Nucleosome-seq analysis revealed highly ordered nucleosome structures, ChIP-seq analysis detected clear RNA polymerase II binding signals in their surrounding regions, evaluations of previously sequenced and newly shotgun-sequenced complete cDNA sequences showed that they encode preferable transcripts for protein translation, and RNA-seq analysis of polysome-incorporated RNAs yielded direct evidence that those transcripts are actually translated into proteins. We also demonstrate that integrative interpretation of transcriptome data is essential for the selection of putative alternative promoter TSCs, two of which also have protein consequences. Furthermore, discriminative chromatin features that separate TSCs at different expression levels were found for both genic TSCs and intergenic TSCs. The collected integrative information should provide a useful basis for future biological characterization of TSCs.
Recent studies have revealed that transcription is initiated from an unexpectedly large number of human genomic regions and that alternative promoters (APs) may regulate the majority of human genes (Landry et al. 2003; The ENCODE Project Consortium 2007; Davuluri et al. 2008). Although several potential regulatory roles have been discussed in the literature (Carninci et al. 2005; Kimura et al. 2006; The ENCODE Project Consortium 2007), the biological rationale for this phenomenon remains unclear. Several investigations have reported functional diversification of a single gene through the use of multiple APs; however, such cases are limited to only a few hundred genes (Matys et al. 2006; Schmid et al. 2006).
The current repertoires of transcriptional start sites (TSSs) have mostly been identified without any functional inference from random cDNA sequencing projects, such as the MGC (Gerhard et al. 2004), FLJ (Ota et al. 2004), and FANTOM (Okazaki et al. 2002) projects. Further extensive analyses using the 5′SAGE (Hashimoto et al. 2004) and CAGE methods (Carninci et al. 2005) have focused on the 5′-ends of cDNAs and revealed that TSSs are widespread throughout the human genome (Carninci et al. 2005; Kimura et al. 2006; The ENCODE Project Consortium 2007). Some studies have proposed that a large number of these TSSs are likely used for transcription of nonprotein coding RNAs (ncRNAs) (Khaitovich et al. 2006; Ravasi et al. 2006; Nakaya et al. 2007). Other studies have raised the concern that these TSSs may, to a large extent, represent intrinsic transcriptional noise of human cells, and thus have no biological relevance (Mattick and Makunin 2006; Willingham and Gingeras 2006; Berretta and Morillon 2009). More recent studies have reported new classes of RNA species, such as “promoter associated RNAs” (Kapranov et al. 2007b; Tsuritani et al. 2007; Preker et al. 2008; Seila et al. 2008; Affymetrix/Cold Spring Harbor Laboratory ENCODE Transcriptome Project 2009; Neil et al. 2009; Taft et al. 2009) and “recapped RNAs” (Schoenberg and Maquat 2009). Considering the various possibilities, it has become increasingly difficult to clarify which transcripts are produced from which types of TSSs and whether they are actually used for protein synthesis or have other biological functions.
In our opinion, the current controversy is largely due to a lack of general biological information regarding TSSs. Although information for millions of cDNA sequences is now available, it is insufficient to provide a comprehensive overview of TSSs in the complex human transcriptome system, wherein a very large number of transcript variations are allowed. Moreover, current cDNA information is a collective patchwork that has been obtained from different cell types. Even worse, the available cDNA libraries have been constructed using several different methods, some of which include normalization or subtraction procedures that deliberately distort expression information. Therefore, with very rare exceptions (e.g., the study recently reported by the RIKEN group, wherein deepCAGE technology was used to characterize human THP-1 cells) (Suzuki et al. 2009), the cDNA information currently available does not represent the actual transcriptional landscape in any given cell type. To understand the biological nature of the human transcriptome, further in-depth characterization of TSSs in individual cell types must be performed in a more quantitative manner.
We recently developed a method that combines our full-length cDNA technology, oligo-capping (Suzuki and Sugano 2003), with massively parallel sequencing technology (Bentley et al. 2008). In this method, which we have named TSS seq (Wakaguri et al. 2008), the sequence adaptor that is necessary for Illumina GA sequencing is directly introduced to the cap site of the mRNA. By TSS-seq analysis, precise information on TSSs and their expression levels can be obtained in a high-throughput manner (Tsuchihara et al. 2009) (see Methods for a detailed protocol; also note that TSS-seq is independent of the CAGE method) (Carninci et al. 2005). In addition, massively parallel sequencing technology has enabled genome-wide analysis of every step of transcriptional regulation, i.e., analyses of nucleosome structures in regions surrounding TSSs (nucleosome-seq) (Albert et al. 2007; Schones et al. 2008; Jiang and Pugh 2009), the binding status of transcription factors, RNA polymerase II (pol II) and histone modifications (ChIP-seq) (Albert et al. 2007; Barski et al. 2007; Johnson et al. 2007; Mardis 2007), the positions and expression levels of TSSs (TSS-seq) (Suzuki et al. 2009; Tsuchihara et al. 2009), and the identification of RNAs in particular cellular fractions (RNA-seq) (Marioni et al. 2008; Affymetrix/Cold Spring Harbor Laboratory ENCODE Transcriptome Project. 2009; Ingolia et al. 2009; Wang et al. 2009).
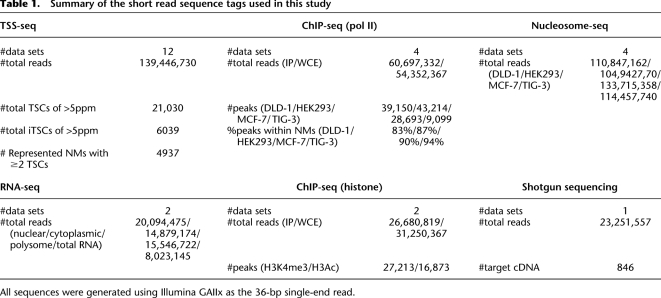
In this report, we describe an integrative transcriptome analysis using a multifaceted application of massively parallel sequencing methods to identify and characterize TSS clusters (TSCs) in the human genome. We collected information for 140 million TSSs using TSS-seq, and used nucleosome-seq, ChIP-seq, and RNA-seq in the nuclear, cytoplasmic, and polysome subcellular fractions in addition to complete cDNA sequencing, to characterize the identified TSSs. We found that although TSSs are prevalent throughout the human genome, not all TSSs have the same properties. Here, we report our first genome-wide integrative analysis of TSSs in human genes using a total of 800 million short read sequence tags (Table 1) (for detailed statistics, see Supplemental Fig. S1). The sequence data have been registered in DDBJ under the accession numbers shown in the Methods and Supplemental Fig. S10.
Table 1.
Summary of the short read sequence tags used in this study
All sequences were generated using Illumina GAIIx as the 36-bp single-end read.
Results and Discussion
Identification of TSS clusters by TSS-seq analysis
Using TSS-seq, we generated 139,446,730 36-bp TSS tags that uniquely mapped to the human genome sequence (hg18) without any mismatches from six cell lines (DLD-1, HEK293, MCF-7, TIG-3, Ramos, and BEAS2B; see the Methods for details on the origins of the cells) and six normal tissues (brain, heart, kidney, fetal brain, fetal heart, and fetal kidney). Generally, 80% of the TSS tags mapped to the sense regions of the RefSeq genes. Of these, 90% were mapped to the first exons or their proximal regions. The rest were mapped outside of those regions, and thus seemed to correspond mostly to previously unannotated transcripts (see below). Further details regarding the statistics of the TSS-seq data are presented in Supplemental Figure S1. Validation of the TSS-seq method can be found elsewhere (Tsuchihara et al. 2009).
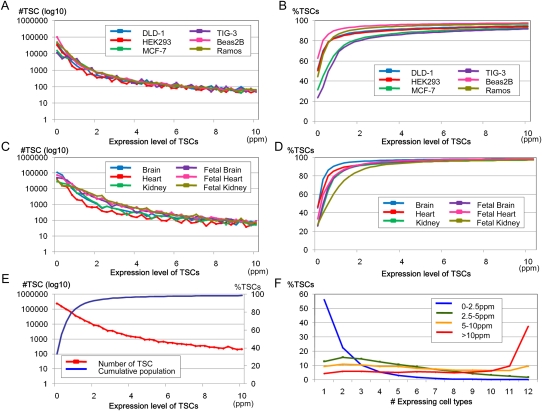
We first clustered the TSS tags into 500-bp bins and defined the clustered TSSs as TSCs to analyze putative promoter units (results of clustering using different bin sizes are depicted in Supplemental Fig. S1F). We conservatively removed TSCs located within internal exons of the RefSeq transcripts, because such TSCs might have been derived from erroneously oligo-capped truncated mRNAs. Nevertheless, a large number of the human genes contained multiple TSCs when the TSCs for the various cell types investigated were combined (see also Carninci et al. 2005; The ENCODE Project Consortium 2007 for similar results). Despite the large number of TSCs, we found that the numbers of TSCs sharply decreased in proportion to increasing expression levels in every cell type (Figs. 1A,C). As described in previous studies, the rates of decrease were observed to follow a “power law” with a log declination rate of −2 (Ueda et al. 2004). As a result, in all cell types <10% of the TSCs exhibited expression levels more than five parts per million TSS tags (ppm, roughly corresponding to five mRNA copies per cell, assuming that each cell contains one million mRNA copies) (Fig. 1B,D). Extensive characterization of the TSCs is shown in Supplemental Figure S1.
Figure 1.
Expression pattern distributions of the TSCs with the indicated expression levels (x-axis) in the cell lines (A) and tissues (C). The cell and tissue origins of the TSCs are shown in the inset. The cumulative populations of the TSCs with expression levels in excess of the values shown on the x-axis are shown in B (cell lines) and D (tissues). (E) Distribution of the TSCs with maximum expression levels in each of the 12 cell types (red line) and the cumulative population of the TSCs (blue line). (F) Cell type distribution of the TSCs. The number of cell types (x-axis) in which the TSCs with the indicated maximum expression levels (inset) were observed is shown.
We also observed that many TSCs expressed at low levels are only represented by a few TSS tags, which were identified from a few cell types. As the maximum expression levels of the TSCs in the 12 investigated cell types increased, the frequency with which they were identified in multiple cell types increased (Fig. 1F). Some promoters function at very low levels in a highly cell type-specific manner (Landry et al. 2003; Davuluri et al. 2008). Nevertheless, we were concerned that many of the minor TSCs might be derived from experimental errors or cryptic transcripts, which are thought to be inherent to the basic transcriptional machinery in humans (Berretta and Morillon 2009; Jacquier 2009; Neil et al. 2009). Thus, it was essential to further characterize the TSCs with additional analyses.
Characterization of TSCs by integrative massive sequencing analyses
To further characterize the TSCs at various expression levels, we first examined the binding status of pol II in the surrounding regions. For this, we used ChIP-seq analysis of DLD-1, HEK293, MCF-7, and TIG-3 cells. We collected ∼20 million 36-bp single-end-read sequence tags for each cell type and searched them for pol II binding sites (Johnson et al. 2007). For example, we identified 39,150 putative pol II binding sites in DLD-1 cells, 32,374 (83%) of which were located in RefSeq regions (see Methods; Supplemental Fig. S2). The statistics for pol II binding sites identified in the other cell types or via the use of different parameters are summarized in Supplemental Figure S2.
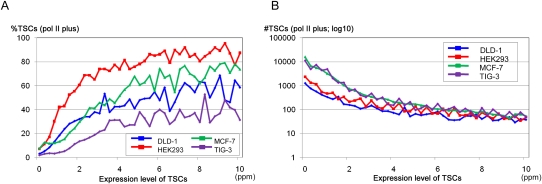
We examined the correlation between the frequency with which the TSCs overlapped the pol II binding sites and their expression levels. As shown in Figure 2A, the frequency with which the TSCs overlapped the pol II binding sites increased as their expression levels increased and appeared to reach a plateau at ∼2.5–5 ppm. Although there were some differences, depending on the cell type, approximately half of the TSCs with expression levels >5 ppm overlapped the pol II binding sites. As shown in Figure 2B, when we counted only the TSCs that overlapped the pol II binding sites in the respective cell types, the rate at which the number of TSCs declined as a function of their increasing expression levels appeared far gentler than that depicted in Figure 1A.
Figure 2.
Expression patterns of the TSCs overlapping the pol II binding sites. (A) Frequencies of the TSCs that overlapped the pol II binding sites in cell lines at the indicated expression levels (x-axis). Cell origins are as indicated in the inset. (B) Frequencies and cumulative populations of the TSCs that overlap pol II binding sites in the respective cell lines are shown.
We further examined the nucleosome structure in the regions surrounding the TSCs by nucleosome-seq analysis, again using DLD-1, HEK293, MCF-7, and TIG-3 cells (for details, see Supplemental Fig. S3). We generated ∼100 million 36-bp single-end-read sequence tags from micrococcal nuclease-digested genomic DNA for each cell type and calculated nucleosome occupancy according to a previously reported method (see Methods). Using this analysis, we expected to directly analyze the correlation between TSCs, pol II binding, and nucleosome structure for specialized cellular environments in humans (see Shivaswamy et al. 2008; Xu et al. 2009).
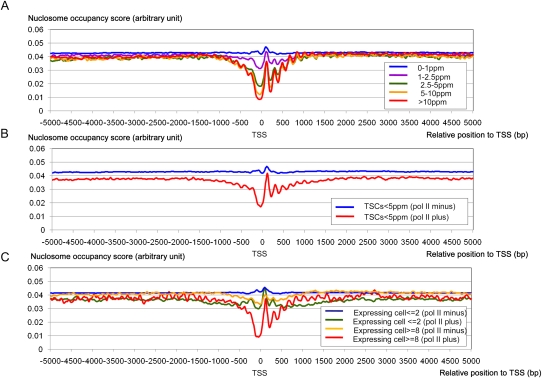
We examined differences in the nucleosome structure in genomic regions surrounding the TSCs as a function of the TSC expression levels. As shown in Figure 3A, we observed well-ordered nucleosome arrays following the nucleosome-free region flanking the TSCs with expression levels >5 ppm. This nucleosome structural feature became less significant as the TSC expression levels decreased (see also Supplemental Fig. S3 for statistical evaluation). Similar results were also obtained from the other cells types: HEK293, MCF-7, and TIG-3 cells (Supplemental Fig. S3).
Figure 3.
Nucleosome structure around the TSCs with different expression patterns. (A) The nucleosome occupancy scores (y-axis) around the TSCs (x-axis) of different expression levels in DLD-1 cells. Expression levels of the TSCs are as indicated in the inset. The results of a similar analysis of different cell types are shown in Supplemental Figure S3. (B) Nucleosome structures in the regions that surround TSCs with expression levels <5 ppm. The scores for TSCs that did and did not overlap the pol II binding sites in DLD-1 cells are indicated by red and blue lines, respectively. (C) Nucleosome structures in the regions that surround the TSCs that were expressed in two or fewer cell types (blue and green lines) or in at least eight cell types (red and yellow lines). TSCs that did and did not overlap the pol II binding sites in any of the four cell lines (DLD-1, HEK293, MCF-7, or TIG-3) are indicated by blue and green lines, respectively.
Together, these results demonstrate that depending on their expression levels, human TSCs have different features regarding the binding status of pol II and nucleosome structures in regions surrounding TSCs. It was difficult to set a clear cut-off that separated TSCs into particular classes due to the somewhat continuous shifting of their features; however, TSCs with expression levels >5 ppm could be categorized in general as those having ordered nucleosome structures and clearly overlapping pol II binding sites. TSCs with expression levels from 2.5 to 5.0 ppm were somewhat marginal, whereas no ordered nucleosome structures or clear pol II binding signals were detected for TSCs with expression levels <2.5 ppm. This observation may indicate that TSCs with ideal genomic contexts for transcription should be most enriched in the population of >5 ppm TSCs, and TSCs for sporadic transcripts, uncharacterized classes of RNAs, or experimental errors might be enriched in the population of TSCs with expression levels <2.5 ppm.
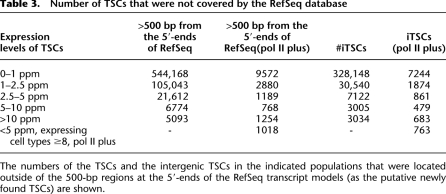
Nearly one million TSCs were identified in this study from all investigated cell types, but there were 21,030 TSCs with maximum expression levels of >5 ppm. We observed that thousands of these TSCs have not been annotated in RefSeq (Table 3, below) or other databases (Supplemental Fig. S4). In particular, we found that 4937 genes contain multiple TSCs >5 ppm (Table 1), possibly corresponding to alternative promoters (APs). The overlap of these TSCs with previously identified APs present in the representative databases is also shown in Supplemental Figure S4.
Table 3.
Number of TSCs that were not covered by the RefSeq database
The numbers of the TSCs and the intergenic TSCs in the indicated populations that were located outside of the 500-bp regions at the 5′-ends of the RefSeq transcript models (as the putative newly found TSCs) are shown.
We further scrutinized the TSCs with low expression levels and found that they occasionally formed ordered nucleosome structures and overlapped pol II binding sites, although the frequency was low. We found that the TSCs whose expression levels were <5 ppm but overlapped the pol II binding sites formed marginal, but distinguishable nucleosome structures (Fig. 3B). The transition of the nucleosome occupancy score at the TSS was approximately half that of the TSCs >5 ppm (Fig. 3, cf. the yellow line in A and the red line in B). When the set of the TSCs with low expression levels was further selected to include only those that had been identified from at least eight cell types, and with overlap of the pol II binding sites in at least one cell type, the degree of ordered nucleosome structure became comparable to that of the TSCs of >5 ppm (Fig. 3C; Fig. 3, cf. the yellow line in A and the red line in C). These TSCs may also be subjected to future functional assays, despite their low expression levels. The integration of the various massively parallel sequencing analyses is even more essential for the prioritization of TSCs in this population.
Sequence analyses of TSCs
We further analyzed the sequence features of the TSCs. As shown in Table 2, we found that the TSCs with low expression levels were more likely to: (1) be located in AT-rich regions (second and third columns) and rarely associated with a consensus initiator sequence (see Supplemental Fig. S1E), (2) be evolutionarily poorly conserved (fourth column) and often associated with repetitive sequences (fifth column), and (3) contain drastic amino acid sequence changes that are located in the middle or C-terminal part of the protein-coding regions (sixth and seventh columns). These results might reflect the fact that so-called “weak” promoters are enriched, especially in the TSCs at <2.5 ppm (statistical significances for the differences between the indicated populations are shown in the margin in Table 2), which were thought to appear occasionally in AT-rich genomic sequences during evolution and produce nondeterministic transcripts that are swiftly erased because no selective pressure is exerted (for review, see Sakakibara et al. 2007; Tsuritani et al. 2007). It is also possible that these “weak” promoters are utilized to transcribe uncharacterized classes of regulatory RNAs. We further observed that the TSCs that overlapped the pol II binding sites in at least one cell type and were expressed in at least eight cell types exhibit features that were nearly comparable to those of the TSCs with expression levels of >5 ppm, although their maximum expression levels in the 12 cell types were <5 ppm.
Table 2.
Sequence features characteristic of the TSCs of each category
The numbers and frequencies of TSCs that fell within the indicated criteria are shown. The definitions for CpG islands and the evolutionary conservation scores are the same as those described in hg18. The frequencies of TSCs located in the 5′-UTR and relative positions within the ORFs, where the N terminus is defined as 0% and the C terminus is 100%, are shown in the sixth and seventh columns, respectively. The definitions of the ORFs are also the same as described in hg18. For details of the computational procedures, see the Methods section. Statistical significances of the differences between populations indicated by asterisks were evaluated by the Wilcoxon signed rank test (*1–6) or the proportion test (*a–i), and are shown in the margin.
*1p < 1×10−200, *2p < 1×10−200, *3p < 1×10−200, *4p < 1×10−200, *5p < 1×10−200, *6p < 1×10−200.
*ap = 1×10−170, *bp = 1×10−193, *cp < 1×10−200, *dp < 1×10−200, *ep < 1×10−200, *fp < 1×10−200, *gp < 1×10−200, *hp = 1×10⁻¹⁰, *ip = 1×10⁻²⁴.
We next analyzed the complete transcript sequences of the TSCs. We first selected 16,080 nonredundant cDNAs from the MGC and FLJ collections whose 5′-ends overlapped the TSCs (Supplemental Figs. S5A,B). Of these, 7206 overlapped the TSCs >5 ppm, and the remaining 8874 overlapped the TSCs <5 ppm. We determined whether the longest open reading frame (ORF) of each of these cDNAs was <100 amino acids, whether their 5′ untranslated region (5′UTR) was >750 bp, and whether they could be a potential target for nonsense-mediated decay (NMD) (Alonso 2005). As shown in the ninth column of Table 2, while >70% of the cDNAs overlapping the TSCs >5 ppm showed none of the aforementioned traits (indicated as “translation caveat”), approximately half of the cDNAs at <2.5 ppm TSCs did, suggesting that transcripts that may not be used for effective translation are enriched in the latter population. We also noted that some transcripts that did not pass this filter may encode proteins that are <100 amino acids in length or may have mechanisms to bypass the otherwise inhibitory effect of long 5′ UTRs or NMD.
To analyze further transcripts for the TSCs that were not covered by MGC and FLJ, we newly determined 846 complete sequences from our single-pass sequenced cDNA collection (Ota et al. 2004), which represented 398 and 448 cDNAs for the TSCs with expression levels of >5 ppm and <5 ppm, respectively. To expedite the complete sequencing, we employed shotgun sequencing of the cDNAs using Illumina GA and the reference genome-assisted assembly of the 378,010,692 generated short reads (see Methods). Among the 846 successfully assembled cDNA sequences, 237 cDNAs (60%) of the 398 in the >5 ppm TSC class and 181 cDNAs (51%) of the 352 in the <5 ppm TSC class exhibited none of the aforementioned potential translation caveats (see Supplemental Fig. S5C,D). Additionally, we noted that at least a large proportion of the TSCs have transcriptional consequences, supported by cDNA evidences, even at low expression levels.
Translation consequence of the TSCs
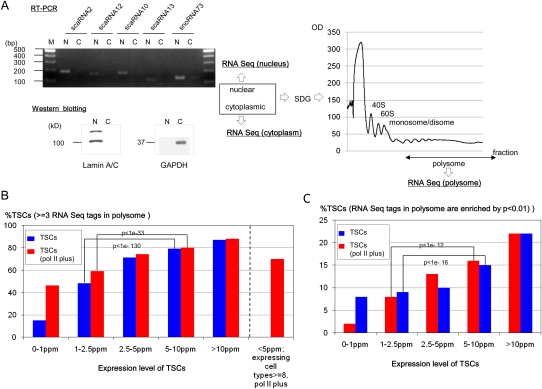
To examine directly whether transcripts of particular TSCs are translated into proteins in a particular cell type, we performed RNA-seq analysis in DLD-1 cells and used RNAs that were extracted from nuclear, cytoplasmic, and polysomal (translating ribosome) fractions (Fig. 4A). In total, we generated 20,094,475 36-bp single-end-read sequence tags from nuclear RNA; 14,879,174 from cytoplasmic RNA; and 15,546,722 from polysomal RNA. Only the RNA-seq tags that exclusively overlapped the corresponding TSCs were counted to associate the RNA-seq tags with the TSCs. Among the TSCs with expression levels >5 ppm in DLD-1 cells, ∼80% of the TSCs overlapped with at least three RNA-seq tags from the polysomal fraction, suggesting that these transcripts are actually used for translation (Fig. 4B). The frequency of the TSCs with polysome tags decreased at lower expression levels. In particular, the polysome tags were more enriched against the averages of the nuclear and cytoplasmic RNA-seq tag concentrations for the TSCs >5 ppm in comparison to the TSCs <2.5 ppm (Fig. 4C). Again, these results suggest that TSCs with clear translational consequences are enriched in the population of TSCs with expression levels >5 ppm.
Figure 4.
Translational consequences of the TSCs. (A) Subcellular fractionation of the nuclear, cytoplasmic, and polysomal components of DLD-1 cells. (Left) RT–PCR results of the indicated nuclear RNAs. (N) Nuclear fraction, (C) cytoplasmic fraction. (Right) Sucrose density gradient (SDG) purification of polysomes. Separation of the cytoplasmic fraction from the nuclear fraction was confirmed by real time RT–PCR using nuclear scaRNAs and snoRNAs (also see Supplemental Fig. S7A) and by Western blot analysis using nuclear lamin A/C proteins and cytoplasmic glyceraldehyde-3-phosphate dehydrogenase (GAPDH) protein (bottom left). The cytoplasmic fraction was further separated to isolate the polysomal fraction by SDG centrifugation. The fraction from which the RNAs were extracted is indicated by the arrow (right). (B) Number of TSCs supported by three or more RNA-seq tags in the polysomal fraction of DLD-1 cells. The statistical significances of differences in the distribution of the numbers of the supporting RNA-seq tags are also shown for the indicated populations. TSCs that did and did not overlap pol II binding sites in DLD-1 cells are indicated by red and blue boxes, respectively. (C) Number of TSCs that exhibited statistical enrichment (P < 0.01) of the RNA-seq tags in the polysomal fraction in comparison to the nuclear and cytoplasmic fractions. The statistical significances of differences in the distribution of the P-values are also shown for the indicated populations. Details of the RNA tag counts in each population of TSCs are shown in Supplemental Figure S6. The computational procedures used for these analyses are presented in the Methods.
Characterization of APs in DLD-1 cells
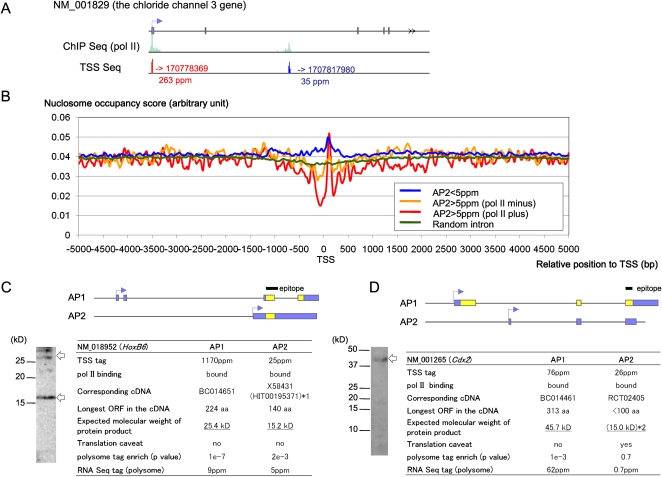
We attempted to demonstrate the characterization of multiple TSCs in a single gene (APs) in cases where two APs are actually used for protein translation in DLD-1 cells. We selected genes for which multiple TSCs were simultaneously active in DLD-1 cells with expression levels >5 ppm, thus directly suggesting the presence of APs in this cell type. The results of the nucleosome-seq analysis indicate that characteristic nucleosome structures form around even the second largest or subsequent TSCs (indicated as “AP2”). The nucleosome structures were more significant for TSCs that overlapped pol II binding sites, but the nucleosome features were less clear around second or subsequent TSCs with lower expression levels (Fig. 5B).
Figure 5.
Characterization of the APs in DLD-1 cells via transcriptome data integration. (A) An example of APs for which both the TSS-seq and the ChIP-seq of pol II analyses supported simultaneous expression in a single gene in DLD-1 cells. (B) Nucleosome structures in the regions that surround the TSCs for second or later APs (indicated as “AP2”), which were expressed at <5 ppm (blue line), overlapped pol II binding sites (red line), or did not overlap pol II binding sites (yellow line). The nucleosome structures at the randomly selected intronic regions according to RefSeq information are also shown (green line). (C,D) Integration of transcriptome data and Western blotting for the HOXB6 (NM_018952; C) and CDX2 (NM_001265; D) genes. Bands of the expected molecular weights are indicated by arrows. Blue and yellow boxes represent predicted untranslated regions and CDSs, respectively. The peptides that were used to raise the antibodies are shown in the margin. (*1) The presence of multiple proteins was also suggested by UniProt (P17509 and P17509-2). (*2) The amino acid sequence had to be deduced from the cDNA sequence that overlapped with AP1, although this sequence lacked the canonical ATG initiator codon.
HOXB6 is a gene wherein both APs overlap pol II binding sites and are simultaneously expressed at >5 ppm. As shown in Figure 5C, we successfully identified simultaneous expression of the two expected protein isoforms from the HOXB6 gene in DLD-1 cells by Western blot analysis. For a similar candidate, the caudal-type homeobox 2 (CDX2) gene, the TSS tag, and pol II information clearly suggest the presence of transcripts, whereas the cDNA sequence and the RNA-seq data do not indicate protein translation. Consistently, Western blot analysis failed to detect one of the putative protein isoforms (“AP2”) in this gene (Fig. 5D), indicating the importance of transcriptome data integration.
Interestingly, the TSS tag count of “AP1” (the most abundant AP) for HOXB6 is about 50-fold larger than that of “AP2”, although the Western blot analyses suggested that protein expression levels are similar, which is consistent with the RNA-seq information obtained from the polysomal fraction, and these results may reflect post-transcriptional expression control of this gene (Keene 2007). Further systematic analysis of the TSS-seq and RNA-seq data should also be useful for examining post-transcriptional expression regulation, about which relatively little knowledge has been accumulated.
Possible functions of putative alternative promoters
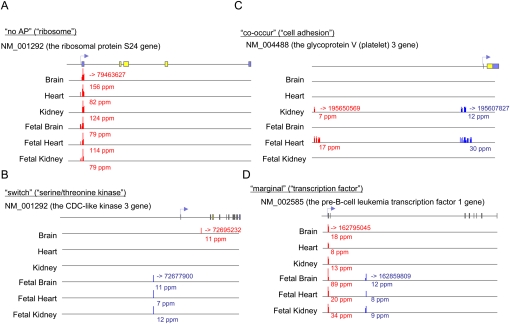
We attempted to infer possible functional diversification of the multiple TSCs (APs) in a single gene. Tentatively focusing on APs that consisted of TSCs with expression levels >5 ppm, we performed a Gene Ontology (GO) term analysis (Gene Ontology Consortium 2006). We found that different gene groups used different modes of alternative TSC use. First, “ribosome” (GO:0005840) genes were enriched among the single-TSC genes (P < 6×10⁻¹¹) (Fig. 6A). As for multiple-TSC genes, “serine/threonine kinase” (GO:0004674) genes were enriched (P < 2×10⁻⁴) in a group of genes for which different TSCs were mutually exclusively “switched” depending on the cell type (Fig. 6B). “Transcription factor” (GO:0003700) genes and “cell adhesion” (GO:0007155) genes were enriched in another gene group in which multiple TSCs are simultaneously used in particular cell types (P < 2×10⁻⁴ and P < 2×10⁻¹³, respectively) (Fig. 6C,D). For “transcription factor” and “cell adhesion” gene groups, we further compared the Pearson correlations of the tag counts for their different TSCs, wherein we found that “cell adhesion” genes tended to have nearly perfect correlations (i.e., the two TSCs almost always “co-occurred”), whereas “transcription factor” genes were evenly distributed between the “switch” and “co-occur” types (for quantitative data, see Supplemental Fig. S7). The different modes of APs are likely to be used for fine-tuning of gene functions for the different gene groups.
Figure 6.
Differential usage of the APs. Examples of the APs in genes that belong to the GO categories of “ribosome” (A), “serine/threonine kinase” (B), “cell adhesion” (C), and “transcription factor” (D). Each number above the horizontal line shows the genomic coordinate. The red and blue arrows represent AP1 and AP2, respectively. For the RefSeq genes, coding and noncoding regions are represented by yellow and blue boxes, respectively.
Identification and characterization of intergenic TSCs
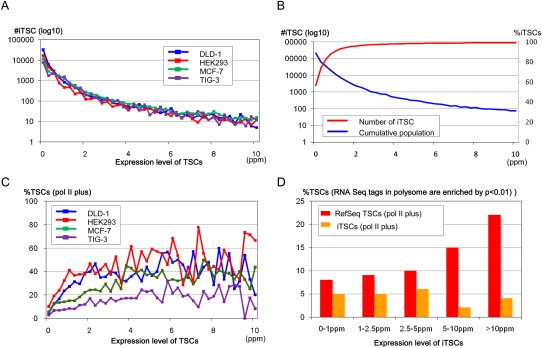
We characterized the TSCs that are mapped outside of the RefSeq regions, which constitute ∼14% of the total number of TSS tags (see Supplemental Fig. S1 for statistics). We also clustered these TSS tags and analyzed the TSCs (intergenic TSCs; iTSCs) in the same way that the RefSeq TSCs were analyzed. On average, there were 50,000 iTSCs in a particular cell type. As was the case for the TSCs in the RefSeq regions, when all different investigated cell types are examined together, there were 371,849 iTSCs; however, only 6039 iTSCs exhibited maximum expression levels >5 ppm (Table 1). The number of the iTSCs that were not covered by RefSeq or other databases is shown in Table 3 and Supplemental Figure S4.
The number of the iTSCs decreased as a function of an increasing number of TSS tags more sharply than the RefSeq TSCs (Fig. 7A, cf. lines with those depicted in Fig. 1). Similar to the RefSeq TSCs, we also found that the frequency of the iTSCs that overlapped the pol II binding sites increased as their expression level increased. Approximately 20%–40% of the iTSCs with expression levels >5 ppm overlapped the pol II binding sites (Fig. 7C). Interestingly, although there were some differences between cell types, the frequencies of the pol II overlapping were generally smaller for the iTSCs than for the RefSeq TSCs. There might be different modes of pol II recruitment to RefSeq TSCs versus iTSCs.
Figure 7.
Characterization of intergenic TSCs. (A) The numbers of iTSCs at the indicated expression level (x-axis) are shown. (B) Numbers and cumulative populations of the iTSCs with maximum expression levels, as indicated on the x-axis, in 12 cell types. (C) Frequencies of the iTSCs that overlapped the pol II binding sites. Origins of the cell lines are as indicated in the inset. (D) The frequencies of the iTSCs for which the RNA-seq tags in the polysomal fractions of DLD-1 cells were enriched (P < 0.01) in comparison to the nuclear and cytoplasmic fractions.
We also characterized the iTSCs with expression levels >5 ppm from various transcriptome viewpoints. We found that transcripts from these iTSCs have little protein-coding potential based on an analysis of 2012 previously determined complete cDNA sequences and 464 newly shotgun-sequenced cDNAs (Supplemental Fig. S8). RNA-seq analysis of the polysomal fraction from DLD-1 cells consistently revealed that the iTSCs are less frequently incorporated into polysomes than the RefSeq TSCs (Fig. 7D). In addition, we compared the sequences that surrounded the iTSCs with expression levels >5 ppm to those that surrounded the iTSCs with expression levels <5 ppm and found discriminating features between them. The iTSCs with expression levels <5 ppm are (1) located in AT-rich regions that are rarely associated with CpG islands, and (2) are evolutionarily poorly conserved and often associated with repetitive sequences (Supplemental Fig. S8).
Taking these results together, we found that the iTSCs, which should mostly consist of TSCs of ncRNAs, generally share expression level and the pol II binding status features with the RefSeq TSCs. In addition, the features that separate the iTSCs with high expression levels from those with low expression levels resembled the features that separated RefSeq TSCs with high expression levels from those with low expression levels. The genomic regions that are vulnerable to “weak” transcription might have common characteristic features in both the RefSeq and the intergenic regions.
Histone modifications in the regions surrounding TSCs
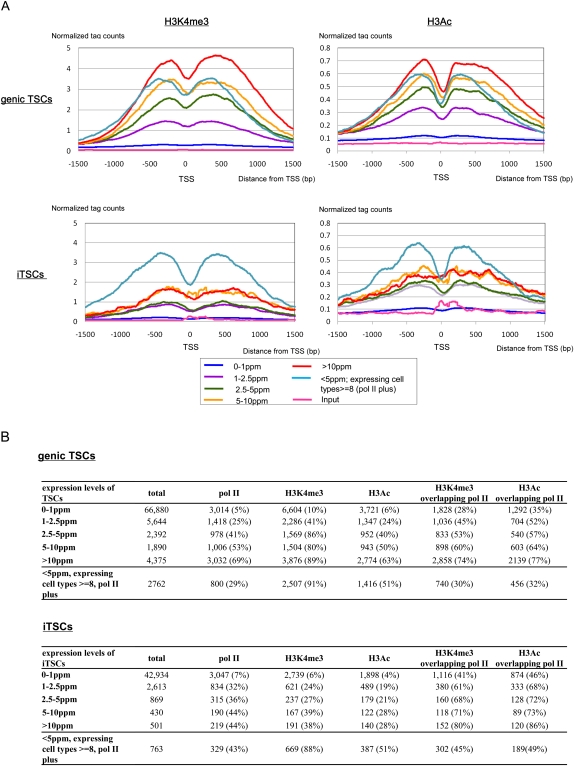
We further examined histone modifications in the regions surrounding the genic and intergenic TSCs for DLD-1 cells. We analyzed H3K4 trimethylation (H3K4me3) and H3 acetylation (H3Ac), which are often associated with open chromatin structure (Barski et al. 2007), using a total of 57,931,186 36-bp single-end sequence ChIP-seq tags. As shown in Figure 8, we found that the frequencies of the genic TSCs that were associated with H3K4me3 and H3Ac increased in proportion to their increasing expression levels. Also, frequencies of histone modifications overlapping the binding signals of pol II increased accordingly (Fig. 8A). For the genic TSCs of >10 ppm, H3K4me3 and H3Ac were associated with 89% and 63% of the TSCs, and these modifications overlapped the pol II binding signals in 74% and 77% of the cases, respectively (Fig. 8B). These observations that increasing expression levels of the TSCs are associated with open chromatin structure and pol II binding are consistent with the results obtained from the nucleosome-seq analysis (Fig. 3; also see Supplemental Fig. S9). Interestingly, when we analyzed the TSCs at <5 ppm that overlapped the pol II binding sites in at least in one cell type and were expressed in at least eight cell types, we found that the frequencies of the respective histone modifications were 91% and 51%, which were at the same levels as the TCSs at >5 ppm, despite their low expression levels. However, in these cases, frequencies of the respective histone modifications that overlapped the pol II binding signals were only 30% and 32%, which resulted in an overall frequency for the TSCs overlapping the pol II binding signals of 29% in DLD-1 cells. Similar results were also observed for the iTCSs. These results suggested that an open chromatin structure occasionally forms without fully recruiting pol II. Such a chromatin status might correspond to the prepared state of chromatin, to which pol II would first be recruited for activation of transcription when the cell receives particular environmental signals. Such a prepared status of cells via epigenetic regulation has been discussed in previous reports (Heintzman et al. 2007; Kim et al. 2008); however, this is the first study to provide direct evidence supporting this possibility with genome-wide TSS data.
Figure 8.
Histone modifications in regions surrounding the TSCs. (A) Average tag concentrations (y-axis) obtained in ChIP-seq analyses of H3K4me3 (left) and H3Ac (right) in the surrounding regions of genic TSCs (top) and iTSCs (bottom) for DLD-1 cells. Expression levels of the TSCs are indicated in the insets. (B) Number of TSCs overlapping the indicated signals. For the extensive analysis using the nucleosome-seq data, see Supplemental Figure S9.
Conclusions
In this study we describe the characterization of TSSs in human genes using various types of transcriptome analyses. To our knowledge, this is the largest TSS data set and the first study to characterize TSSs by various types of transcriptome data. Although some features of the TSSs described here, such as their expression patterns, have also been reported in previous studies using CAGE analysis (Suzuki et al. 2009), we consolidated the previous data with a larger data set. It is also significant that we demonstrated that our TSS-seq method, which selects the cap structure of the mRNA enzymatically (Tsuchihara et al. 2009), can be used instead of the CAGE method, which is a chemical method requiring more delicate optimization of experimental conditions.
This study has several limitations. First, we were able to use only a limited selection of cell types, and therefore the present study does not include all TSCs that human cells might use. Second, we used conservative computational filters for the sequencing results. Third, we primarily compared TSCs with expression levels >5 ppm to those with expression levels <2.5 ppm and were unable to closely analyze TSCs with marginal expression levels. Also, even among the TSCs at <2.5 ppm, there were a number of TSCs whose existence is supported by our integrative transcriptome data despite their low expression levels. Furthermore, we did not analyze TSCs that mapped inside internal exons to minimize the population of erroneously “oligo-capped” cDNA fragments (see Supplemental Fig. 2F for their initial characterization). In addition, due to limitations in the TSS-seq process, we may have missed or under-represented transcripts of poly(A−) RNAs (Kapranov et al. 2007a) and TSCs located in perfectly matching repetitive genomic sequences, which are estimated to contain 6%–30% of the capped RNAs in humans (Faulkner et al. 2009). Future in-depth characterization of TSCs that have not been characterized in this study will be necessary to better understand regions of the human genome that have been the least studied.
Nevertheless, even in this first approximation, we were able to identify thousands of TSCs that are worth analyzing in future functional studies, although they are not fully represented in pre-existing databases. In addition, we found that not all TSCs have the same properties based on our integrative transcriptome data, ranging from TSS-seq, ChIP-seq, nucleosome-seq, and RNA-seq. For example, there were several clearly distinctive features in highly expressed TSCs compared with those with low expression levels, and these features should collectively allow deterministic transcription. Among the TSCs with low expression levels, the population with such features is small, raising the possibility that many of their transcripts might not possess biological relevance on their own. It is rather possible that these TSCs realize their functions by controlling the accessibility of transcription factors or other DNA-binding proteins by being transcribed or by other unknown mechanisms. Indeed, this is the case for “enhancer RNAs” (Kim et al. 2010), “cryptic unstable transcripts (CUTs)” (Berretta and Morillon 2009; Jacquier 2009; Neil et al. 2009), “stable un-annotated transcripts (SUTs)” (Xu et al. 2009), and other emerging classes of RNAs (Preker et al. 2008; Seila et al. 2008; Affymetrix/ Cold Spring Harbor Laboratory ENCODE Transcriptome Project 2009; Taft et al. 2009). Different experimental designs may be considered for biological characterization of TSCs with low expression levels. Otherwise, the large number of TSCs in this category may pose severe problems for efficient functional assays. In addition to the drastic improvements in throughput and cost, the greatest advantage of using massively parallel sequencing is that various types of analyses can be simultaneously enabled using this common platform. Various types of transcriptome data collected from specific cell types and integrative interpretation of the data should provide useful information that can then be used to create quick and detailed functional assays to attain a more comprehensive understanding of transcription in the human genome.
Methods
Sequence data
The short-read sequence archive data that appear in this paper are registered in GenBank/DDBJ under the accession nos. SRA003625, SRP000403, SRS001832–001843, SRX002436–002437, SRX002512–002521, SRR011201–011202, SRR013349–013353, SRR013356–013358, SRR013360–013370, SRR013389–013396, SRR013454–013457, SRR013460–013467, SRR013481–013482, SRR013493–013501, SRR013527–013533, SRA008162, SRP000604, SRS002117, SRX002756, SRR013718–013730, SRA008164, SRP000609, SRS002119, SRX002783, SRR013809–013819, DRX000003–000008, DRR000003–000013, DRA000003–000008, DRP000003–000008, DRS000004–000008, and DRR000014–000018. See Supplemental Figure 10 for further details of the datasets.
Cell culture and tissues
The human DLD-1 cell line (ATCC number CCL-221) was maintained in Dulbecco's modified Eagle's medium (DMEM, Invitrogen) supplemented with 10% fetal calf serum, 4.5 g/L glucose, and antibiotics. HEK293 (ATCC number CRL-1573), MCF-7 (ATCC number HTB-22, Japan Cell Resource Bank number JCRB0506), TIG-3 (ATCC number CRL-9609), BEAS2B (ATCC number CRL-1596), and Ramos cells were cultured under standard conditions. For each cell line, ∼6 × 10⁶ cells were cultured and harvested for RNA extraction using RNeasy kit (Qiagen). Human tissue RNAs were purchased from Clontech (catalog nos. 636526, 636529, 636530, 636532, 636583, and 636584).
Construction of the TSS-seq libraries and analysis of TSS tags
Two hundred micrograms of the total RNA obtained was subjected to oligo-capping, with some modifications from the original protocol. Briefly, after successive treatment of the RNA with 2.5 U of BAP (TaKaRa) at 37°C for 1 h and 40 U of TAP (Ambion) at 37°C for 1 h, the BAP–TAP-treated RNAs were ligated to 1.2 μg of the RNA oligonucleotide 5′-AAUGAUACGGCGACCACCGAGAUCUACACUCUUUCCCUACACGACGCUCUUCCGAUCUGG-3′ using 250 U ofT4 RNA ligase (TaKaRa) at 20°C for 3 h. After DNase I treatment (TaKaRa), poly(A)-containing RNA was selected using oligo-dT powder (Collaborative). The first strand cDNA was synthesized with 10 pmol of random hexamer primer (5′-CAAGCAGAAGACGGCATACGANNNNNNC-3′) using SuperScript II (Invitrogen), with incubation at 12°C for 1 h and 42°C overnight. The template RNA was degraded by alkaline treatment. For PCR, 20% of the first strand cDNA was used as the PCR template. Gene Amp PCR kits (PerkinElmer) were used with the PCR primers 5′-AATGATACGGCGACCACCGAG-3′ and 5′-CAAGCAGAAGACGGCATACGA-3′ under the following reaction conditions: 15 cycles at 94°C for 1 min, 56°C for 1 min, and 72°C for 2 min. The PCR fragments were size-fractionated by 12% polyacrylamide gel electrophoresis, and the fraction that contained the 150–250-bp fragments was recovered. The quality and quantity of the obtained single-stranded first-strand cDNAs were assessed using a BioAnalyzer (Agilent). One nanogram of the size-fractionated cDNA was used for sequencing reactions with the Illumina GA. The sequencing reactions were performed according to the manufacturer's instructions.
Construction of the nucleosome-seq library and analysis of nucleosome tags
DLD-1, HEK293, MCF-7, and TIG-3 cells (1 × 10⁸) were cultured to 80% confluence and treated with micrococcal nuclease using a ChIP-IT Express Enzymatic Kit (Active motif) to generate mononucleosomes. The cells were formaldehyde cross-linked before nucleosomes were isolated. Cross-linking was achieved by treatment with a fixation solution (DMEM, 0.01% formaldehyde) for 10 min at room temperature. The cells were then washed with PBS, and cross-linking was stopped with a glycine stop-fix solution (PBS, glycine buffer) for 5 min at room temperature. After cells were washed with PBS, an ice-cold cell scraping solution was added to the dish, and the cells were harvested. The cells were resuspended in ice-cold lysis buffer, incubated on ice for 30 min, and homogenized by 15–20 strokes with a pestle (Dounce homogenizer). The nuclei were suspended in a digestion buffer and prewarmed for 5 min at 37°C. Micrococcal nuclease (200 U/mL) was added to the sample, and the digestion reaction was incubated at 37°C for 15 min. After the reaction was stopped with EDTA, the nuclei were pelleted by centrifugation and the supernatants were collected. The formaldehyde cross-linking was reversed by addition of 5 M NaCl and RNase and incubation at 65°C for >4 h. Proteinase K was then added, and the mixture incubated at 42°C for 1.5 h. The DNA was purified via phenol/chloroform extraction and ethanol precipitation. Using the extracted DNA, the samples were prepared for Illumina GA sequencing according to the manufacturer's instructions.
Construction of the ChIP-seq library and analysis of the ChIP-seq tags
DLD-1, HEK293, MCF-7, and TIG-3 cells (1 × 10⁸) were cross-linked with 1% formaldehyde at room temperature for 10 min, and the cross-linking was stopped with a glycine stop-fix solution (PBS, glycine buffer) for 5 min at room temperature. The cells were washed twice with cold PBS and harvested. The cells were lysed in 5 mL of lysis buffer 1 (50 mM Hepes-KOH at pH 7.5, 140 mM NaCl, 1 mM EDTA, 10% glycerol, 0.5% NP-40, and 0.25% Triton X-100). The lysate was incubated at 4°C for 10 min and centrifuged at 1500 rpm for 5 min at 4°C. The pellet was then resuspended in 5 mL of lysis buffer 2 (10 mM Tris-HCl at pH 8.0, 200 mM NaCl, 1 mM EDTA, and 0.5 mM EGTA). The cell lysate was incubated at room temperature for 10 min and centrifuged at 1500 rpm for 5 min at 4°C. The pellet was resuspended in 1 mL of lysis buffer 3 (10 mM Tris-HCl at pH 8.0, 100 mM NaCl, 1 mM EDTA, 0.5 mM EGTA, 0.1% Na-deoxycholate, and 0.5% N-lauroylsarcosine). Next, the lysate was sonicated on ice for 16 30-sec cycles using a sonicator (TOMY SEIKO). A 100-μL aliquot of 10% Triton-X 100 was added, and the cell lysate was centrifuged at 14,000 rpm for 10 min. A 50-μL portion of the supernatant was saved as whole-cell extract (WCE) DNA. The supernatant was then mixed with washed magnetic beads bound to 10 μg of RNA Polymerase CTD repeat monoclonal antibody (Abcam: ab817), monoclonal anti-H3K4me3 antibody (Abcam: ab1012), or polyclonal anti-H3Ac antibody (Millipore, 06-599). The samples were rotated at 4°C overnight and washed eight times with 1-mL aliquots of wash buffer (50 mM Hepes-KOH at pH 7.5, 500 mM LiCl, 1 mM EDTA, 1% NP-40, and 0.7% Na-deoxycholate) and once with TE buffer containing 50 mM NaCl. Elution buffer (200 μL) was added, and the sample was eluted at 65°C for 15 min. The supernatant was transferred to a new tube and incubated at 65°C overnight. Elution buffer (150 μL) was added to the WCE–DNA, and the reaction was incubated at 65°C overnight. Approximately 200 μL of TE was added to the IP and WCE–DNA samples. An 8-μL aliquot of 10 mg/mL RNase A (Funakoshi) was added, and the reactions were incubated at 37°C for 2 h. A 4 μL-portion of 20 mg/mL proteinase K (Takara) was added, and the reactions were incubated at 55°C for 2 h. The DNA was recovered by a phenol chloroform extraction and ethanol precipitation. Using the recovered DNA, the samples were prepared for the Illumina GA according to the manufacturer's instructions.
Shotgun sequencing of the cDNAs
Colony PCR was performed for the cDNA clones using the common PCR primers: 5′-TCAGTGGATGTTGCCTTTAC-3′ and 5′-TGTGGGAGGTTTTTTCTCTA-3′. The obtained PCR products were nebulized so that the average fragment size was between 200 and 500 bp. Samples were prepared for the Illumina GA according to the manufacturer's instructions. Using the generated 36-bp sequence tags, the cDNA sequences were assembled based on their mapping to the human genome sequence. Details of the computational procedure for assembly and quality assessment are described elsewhere (Kuroshu et al. 2010). Because the quality of the base calls varied, only the exon boundary information was extracted, and the actual nucleotide sequences were replaced with those of the reference human genome.
RNA-seq analysis of subcellular-fractionationated RNAs
DLD-1 cells (1 × 10⁸) were incubated in medium supplemented with 0.1 mg/mL cycloheximide for 5 min at 37°C and then washed with PBS containing 0.1 mg/mL cycloheximide. The cell pellets were resuspended in lysis buffer (20 mM Tris-HCl at pH 7.5, 150 mM NaCl, 15 mM MgCl2, 1% Triton X-100, 0.1 mg/mL cycloheximide, 0.1 mM dithiothreitol, RNase inhibitor, and Complete Protease Inhibitor Cocktail [Roche]), and lysed on ice for 10 min. The lysate was separated into a cytoplasmic fraction (supernatant) and a nuclear fraction (pellet) by centrifugation. The nuclear pellet was resuspended in lysis buffer, homogenized, and lysed on ice for 10 min. A portion of the cytoplasmic fraction was layered on top of a 10-mL, 15%–50% (w/v) sucrose gradient and centrifuged at 36,000 rpm in a Beckman SW41Ti rotor for 2 h and 15 min at 4°C. The polysomal fraction was isolated from each gradient using a density gradient fractionator (Towa Labo), while the absorbance was monitored at 260 nm. The polysomal, cytoplasmic, and nuclear fractions were treated with 200 μg/mL proteinase K, and the RNA was extracted using TRIzol LS (Invitrogen). The concentration of the RNA obtained was analyzed using a Bioanalyzer (2100, Agilent Technologies).
Using 1 μg of RNA extracted from each fraction (nuclear, cytoplasm, and polysome fractions), the RNA-seq library was constructed using the mRNA-seq Sample Preparation Kit according to the manufacturer's instructions (Illumina). Briefly, RNA was subjected to poly(A) selection using Sera-Mag Magnetic Oligo-dT Beads. Poly(A+) RNA was partially degraded by incubating in Fragmentation Buffer at 94°C for 5 min. First-strand cDNA was synthesized using random primer and SuperScript II (Invitrogen), and second strand cDNA was synthesized using RNaseH and DNA pol I (Illumina). Double-stranded cDNA was size fractionated by 6% PAGE and cDNAs of 250–300 bp were recovered. Illumina GA sequencing adaptors were ligated to cDNA ends. cDNAs were amplified by 15 cycles of PCR reactions using Phusion DNA Polymerase (Finnzymes). Thirty-six-base-pair single-end-read RNA-seq tags were generated using an Illumina GA sequencer according to the standard protocol. RNA-seq tags that were mapped to the human reference genome sequences (hg18) without any mismatches were used. RNA-seq tags were corresponded to RefSeq transcripts or TSCs when their genomic coordinates overlapped.
SDS-PAGE and Western blotting
The protein concentration was determined using a BCA protein assay kit (Pierce). The proteins were fractionated on 10% (GAPDH) and 7.5% (Lamin) SDS–polyacrylamide gels. The separated proteins were transferred to PVDF membranes, which were blocked in blocking buffer (1×TBS, 0.1% Tween-20, and 5% dry milk). The membranes were incubated with primary antibodies anti-GAPDH rabbit pAB (catalog#: sc-25778) and anti-Lamin A/C goat pAb (catalog#: sc-6215, Santa Cruz Biotechnology) diluted 1:1000 for 1 h at room temperature. After being washed with TBS containing 0.1% Tween-20, the membranes were incubated for 1 h at room temperature using a 1:20,000 dilution of horseradish peroxidase-conjugated anti-rabbit (Cell Signaling Technology) or anti-goat (Santa Cruz Biotechnology) IgG antibody. Bands were detected using the ECL Plus Western Blotting Detection System (GE Healthcare).
Western blotting analyses of the HOXB6 and CDX2 genes were similarly performed using antibodies purchased from Santa Cruz Biotechnology (catalog nos. sc-17171 and sc-19478, respectively). The whole-cell lysates were fractionated on a 15% SDS–polyacrylamide gel.
Computational procedures
The 36-bp read TSS tags were mapped onto the human genome sequence (hg18, UCSC Genome Browser) using ELAND. Uniquely and completely mapped TSS tags (without any mismatches) were used for the analysis. After the mapped TSS tags were clustered into 500-bp bins, the TSS clusters located within a region from −50 kb of the 5′-end to the 3′-end boundary of the RefSeq gene were selected. TSS clusters were removed when all TSS tags belonging to them were located at the internal exonic region of the corresponding RefSeq genes. The TSS within a particular TSC that gave the largest number of TSS tags was defined as the representative TSS of that TSC and used for analysis. The expression level of the TSC was defined as the sum of the TSS tag concentrations that belonged to the TSC. The expression levels of the TSCs were independently evaluated in each cell type and merged with other cell types when indicated. TSCs in different cell types were correlated when they were located within 500 bp of each another.
RefSeq information, such as genomic coordinates and positions of the protein-coding regions, was obtained from hg18. Gene Ontology terms were correlated with RefSeq via loc2go, as presented in NCBI. The statistical significance of the differences in the sequence features around the TSCs was evaluated by the indicated methods. The enrichments of the APs in particular gene groups were evaluated by calculating their hypergeometric distributions. Pearson correlations between the APs were calculated using the TSS tag count information from the 12 cell types.
The 36-bp read ChIP-seq tags, which were generated from DLD-1, HEK293, MCF-7, and TIG-3 cells, were mapped in the same manner as the TSS tags. The putative binding sites of pol II, which are based on the short-read tag information, were identified as follows in each cell type: (1) The covered region of the mapped tag sequence was extended to 120 bp, which reflects the insert sites of the sample DNA fragments; (2) for each genomic position, the number of overlapping extended tags was counted; (3) based on the calculated tag information, we evaluated whether the sum of the covered tags in the 120 bp was greater than a fivefold difference between the IP and WCE samples; and (4) genomic regions were selected for which positive enrichment of the tags continued for >120 bp. The statistical significance of this selection procedure against the background rate was evaluated according to the reference using the following equation:
 |
where p(x,λ) is the probability of enrichment, λ is the expected tag number in the 120-bp window calculated by the WCE sample, and x is the observed tag number in the 120-bp window. The identification of pol II binding sites with different parameters is also shown in Supplemental Figure S2C. Pol II binding sites identified with alternate parameters were correlated with TSCs when they overlapped the representative TSSs of the TSCs.
The 36-bp read nucleosome-seq tags, which were generated from DLD-1, HEK293, MCF-7, and TIG-3 cells, were mapped in the same manner as the TSS tags. The nucleosome occupancy scores were calculated according to a published procedure (Albert et al. 2007). We defined the positions of the nucleosome center i by adding 75 bp to the 5′ end of each mapped nucleosome tag. The counts of the nucleosome centers c(i) were converted to the nucleosome signals s(pj) throughout the entire genome using the logarithm of a weighted average, as follows:
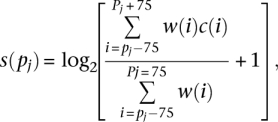 |
where pj = 5 + 10j (j=0, 1, 2, …), and w(i) is a Gaussian distribution with a mean of pj and a standard deviation of 20. The calculated nucleosome occupancy score at each genomic coordinate was plotted according to its position relative to the TSSs. When indicated, the nucleosome scores were averaged at each genomic coordinate for the given population of TSCs. Statistical significance of the difference between the nucleosome patterns is discussed in the legend of Supplemental Figure 3.
The 36-bp read RNA-seq tags, which were generated from RNA-seq analysis in polysomal, nuclear, and cytoplasmic fractions for DLD-1 cells, were mapped in the same manner in which TSS tags were mapped. Only the RNA-seq tags that exclusively overlapped with corresponding TSCs were counted. Enrichment of the RNA-seq tags in the respective subcellular fractions was evaluated using a Poisson distribution:
 |
where p(x,λ) is the probability of enrichment, λ is the expected tag number in the polysomal fraction for each gene based on the tag number in the cytoplasmic fraction, and x is the observed tag number in the polysomal fraction for each gene. The statistical significance of P-value distributions in each TSC group (as appearing in Fig. 4B,C) was evaluated by the Wilcoxon signed rank test.
Acknowledgments
This work was supported by a Grant-in-Aid for Scientific Research on Innovative Areas “Genome Science” from the Ministry of Education, Culture, Sports, Science and Technology (MEXT); the Japan Society for the Promotion of Science (JSPS) through its “Funding Program for World-Leading Innovative R&D on Science and Technology (FIRST Program).”
Footnotes
[Supplemental material is available for this article. The sequence data from this study have been submitted to the DNA Data Bank of Japan (http://www.ddbj.nig.ac.jp/index-e.html) under accession numbers listed in the Methods section.]
Article published online before print. Article, supplemental material, and publication date are at http://www.genome.org/cgi/doi/10.1101/gr.110254.110.
References
- Affymetrix/Cold Spring Harbor Laboratory ENCODE Transcriptome Project 2009. Post-transcriptional processing generates a diversity of 5′-modified long and short RNAs. Nature 457: 1028–1032 [DOI] [PMC free article] [PubMed] [Google Scholar]
- Albert I, Mavrich TN, Tomsho LP, Qi J, Zanton SJ, Schuster SC, Pugh BF 2007. Translational and rotational settings of H2A.Z nucleosomes across the Saccharomyces cerevisiae genome. Nature 446: 572–576 [DOI] [PubMed] [Google Scholar]
- Alonso CR 2005. Nonsense-mediated RNA decay: A molecular system micromanaging individual gene activities and suppressing genomic noise. Bioessays 27: 463–466 [DOI] [PubMed] [Google Scholar]
- Barski A, Cuddapah S, Cui K, Roh TY, Schones DE, Wang Z, Wei G, Chepelev I, Zhao K 2007. High-resolution profiling of histone methylations in the human genome. Cell 129: 823–837 [DOI] [PubMed] [Google Scholar]
- Bentley DR, Balasubramanian S, Swerdlow HP, Smith GP, Milton J, Brown CG, Hall KP, Evers DJ, Barnes CL, Bignell HR, et al. 2008. Accurate whole human genome sequencing using reversible terminator chemistry. Nature 456: 53–59 [DOI] [PMC free article] [PubMed] [Google Scholar]
- Berretta J, Morillon A 2009. Pervasive transcription constitutes a new level of eukaryotic genome regulation. EMBO Rep 10: 973–982 [DOI] [PMC free article] [PubMed] [Google Scholar]
- Carninci P, Kasukawa T, Katayama S, Gough J, Frith MC, Maeda N, Oyama R, Ravasi T, Lenhard B, Wells C, et al. 2005. The transcriptional landscape of the mammalian genome. Science 309: 1559–1563 [DOI] [PubMed] [Google Scholar]
- Davuluri RV, Suzuki Y, Sugano S, Plass C, Huang TH 2008. The functional consequences of alternative promoter use in mammalian genomes. Trends Genet. 24: 167–177 [DOI] [PubMed] [Google Scholar]
- The ENCODE Project Consortium 2007. Identification and analysis of functional elements in 1% of the human genome by the ENCODE pilot project. Nature 447: 799–816 [DOI] [PMC free article] [PubMed] [Google Scholar]
- Faulkner GJ, Kimura Y, Daub CO, Wani S, Plessy C, Irvine KM, Schroder K, Cloonan N, Steptoe AL, Lassmann T, et al. 2009. The regulated retrotransposon transcriptome of mammalian cells. Nat Genet 41: 563–571 [DOI] [PubMed] [Google Scholar]
- Gene Ontology Consortium 2006. The Gene Ontology (GO) project in 2006. Nucleic Acids Res 34: D322–D326 [DOI] [PMC free article] [PubMed] [Google Scholar]
- Gerhard DS, Wagner L, Feingold EA, Shenmen CM, Grouse LH, Schuler G, Klein SL, Old S, Rasooly R, Good P, et al. 2004. The status, quality, and expansion of the NIH full-length cDNA project: The Mammalian Gene Collection (MGC). Genome Res 14: 2121–2127 [DOI] [PMC free article] [PubMed] [Google Scholar]
- Hashimoto S, Suzuki Y, Kasai Y, Morohoshi K, Yamada T, Sese J, Morishita S, Sugano S, Matsushima K 2004. 5′-end SAGE for the analysis of transcriptional start sites. Nat Biotechnol 22: 1146–1149 [DOI] [PubMed] [Google Scholar]
- Heintzman ND, Stuart RK, Hon G, Fu Y, Ching CW, Hawkins RD, Barrera LO, Van Calcar S, Qu C, Ching KA, et al. 2007. Distinct and predictive chromatin signatures of transcriptional promoters and enhancers in the human genome. Nat Genet 39: 311–318 [DOI] [PubMed] [Google Scholar]
- Ingolia NT, Ghaemmaghami S, Newman JR, Weissman JS 2009. Genome-wide analysis in vivo of translation with nucleotide resolution using ribosome profiling. Science 324: 218–223 [DOI] [PMC free article] [PubMed] [Google Scholar]
- Jacquier A 2009. The complex eukaryotic transcriptome: Unexpected pervasive transcription and novel small RNAs. Nat Rev Genet 10: 833–844 [DOI] [PubMed] [Google Scholar]
- Jiang C, Pugh BF 2009. Nucleosome positioning and gene regulation: Advances through genomics. Nat Rev Genet 10: 161–172 [DOI] [PMC free article] [PubMed] [Google Scholar]
- Johnson DS, Mortazavi A, Myers RM, Wold B 2007. Genome-wide mapping of in vivo protein-DNA interactions. Science 316: 1497–1502 [DOI] [PubMed] [Google Scholar]
- Kapranov P, Cheng J, Dike S, Nix DA, Duttagupta R, Willingham AT, Stadler PF, Hertel J, Hackermuller J, Hofacker IL, et al. 2007a. RNA maps reveal new RNA classes and a possible function for pervasive transcription. Science 316: 1484–1488 [DOI] [PubMed] [Google Scholar]
- Kapranov P, Willingham AT, Gingeras TR 2007b. Genome-wide transcription and the implications for genomic organization. Nat Rev Genet 8: 413–423 [DOI] [PubMed] [Google Scholar]
- Keene JD 2007. RNA regulons: coordination of post-transcriptional events. Nat Rev Genet 8: 533–543 [DOI] [PubMed] [Google Scholar]
- Khaitovich P, Enard W, Lachmann M, Paabo S 2006. Evolution of primate gene expression. Nat Rev Genet 7: 693–702 [DOI] [PubMed] [Google Scholar]
- Kim J, Chu J, Shen X, Wang J, Orkin SH 2008. An extended transcriptional network for pluripotency of embryonic stem cells. Cell 132: 1049–1061 [DOI] [PMC free article] [PubMed] [Google Scholar]
- Kim TK, Hemberg M, Gray JM, Costa AM, Bear DM, Wu J, Harmin DA, Laptewicz M, Barbara-Haley K, Kuersten S, et al. 2010. Widespread transcription at neuronal activity-regulated enhancers. Nature 465: 182–187 [DOI] [PMC free article] [PubMed] [Google Scholar]
- Kimura K, Wakamatsu A, Suzuki Y, Ota T, Nishikawa T, Yamashita R, Yamamoto J, Sekine M, Tsuritani K, Wakaguri H, et al. 2006. Diversification of transcriptional modulation: Large-scale identification and characterization of putative alternative promoters of human genes. Genome Res 16: 55–65 [DOI] [PMC free article] [PubMed] [Google Scholar]
- Kuroshu RM, Watanabe J, Sugano S, Morishita S, Suzuki Y, Kasahara M 2010. Cost-effective sequencing of full-length cDNA clones powered by a de novo-reference hybrid assembly. PLoS One 5: e10517. doi: 10.1371/journal.pone.0010517 [DOI] [PMC free article] [PubMed] [Google Scholar]
- Landry JR, Mager DL, Wilhelm BT 2003. Complex controls: The role of alternative promoters in mammalian genomes. Trends Genet 19: 640–648 [DOI] [PubMed] [Google Scholar]
- Mardis ER 2007. ChIP-seq: Welcome to the new frontier. Nat Methods 4: 613–614 [DOI] [PubMed] [Google Scholar]
- Marioni JC, Mason CE, Mane SM, Stephens M, Gilad Y 2008. RNA-seq: An assessment of technical reproducibility and comparison with gene expression arrays. Genome Res 18: 1509–1517 [DOI] [PMC free article] [PubMed] [Google Scholar]
- Mattick JS, Makunin IV 2006. Non-coding RNA. Hum Mol Genet 15: R17–R29 [DOI] [PubMed] [Google Scholar]
- Matys V, Kel-Margoulis OV, Fricke E, Liebich I, Land S, Barre-Dirrie A, Reuter I, Chekmenev D, Krull M, Hornischer K, et al. 2006. TRANSFAC and its module TRANSCompel: Transcriptional gene regulation in eukaryotes. Nucleic Acids Res 34: D108–D110 [DOI] [PMC free article] [PubMed] [Google Scholar]
- Nakaya HI, Amaral PP, Louro R, Lopes A, Fachel AA, Moreira YB, El-Jundi TA, da Silva AM, Reis EM, Verjovski-Almeida S 2007. Genome mapping and expression analyses of human intronic noncoding RNAs reveal tissue-specific patterns and enrichment in genes related to regulation of transcription. Genome Biol 8: R43. doi: 10.1186/gb-2007-8-3-r43 [DOI] [PMC free article] [PubMed] [Google Scholar]
- Neil H, Malabat C, d'Aubenton-Carafa Y, Xu Z, Steinmetz LM, Jacquier A 2009. Widespread bidirectional promoters are the major source of cryptic transcripts in yeast. Nature 457: 1038–1042 [DOI] [PubMed] [Google Scholar]
- Okazaki Y, Furuno M, Kasukawa T, Adachi J, Bono H, Kondo S, Nikaido I, Osato N, Saito R, Suzuki H, et al. 2002. Analysis of the mouse transcriptome based on functional annotation of 60,770 full-length cDNAs. Nature 420: 563–573 [DOI] [PubMed] [Google Scholar]
- Ota T, Suzuki Y, Nishikawa T, Otsuki T, Sugiyama T, Irie R, Wakamatsu A, Hayashi K, Sato H, Nagai K, et al. 2004. Complete sequencing and characterization of 21,243 full-length human cDNAs. Nat Genet 36: 40–45 [DOI] [PubMed] [Google Scholar]
- Preker P, Nielsen J, Kammler S, Lykke-Andersen S, Christensen MS, Mapendano CK, Schierup MH, Jensen TH 2008. RNA exosome depletion reveals transcription upstream of active human promoters. Science 322: 1851–1854 [DOI] [PubMed] [Google Scholar]
- Ravasi T, Suzuki H, Pang KC, Katayama S, Furuno M, Okunishi R, Fukuda S, Ru K, Frith MC, Gongora MM, et al. 2006. Experimental validation of the regulated expression of large numbers of non-coding RNAs from the mouse genome. Genome Res 16: 11–19 [DOI] [PMC free article] [PubMed] [Google Scholar]
- Sakakibara Y, Irie T, Suzuki Y, Yamashita R, Wakaguri H, Kanai A, Chiba J, Takagi T, Mizushima-Sugano J, Hashimoto S, et al. 2007. Intrinsic promoter activities of primary DNA sequences in the human genome. DNA Res 14: 71–77 [DOI] [PMC free article] [PubMed] [Google Scholar]
- Schmid CD, Perier R, Praz V, Bucher P 2006. EPD in its twentieth year: Towards complete promoter coverage of selected model organisms. Nucleic Acids Res 34: D82–D85 [DOI] [PMC free article] [PubMed] [Google Scholar]
- Schoenberg DR, Maquat LE 2009. Re-capping the message. Trends Biochem Sci 34: 435–442 [DOI] [PMC free article] [PubMed] [Google Scholar]
- Schones DE, Cui K, Cuddapah S, Roh TY, Barski A, Wang Z, Wei G, Zhao K 2008. Dynamic regulation of nucleosome positioning in the human genome. Cell 132: 887–898 [DOI] [PMC free article] [PubMed] [Google Scholar]
- Seila AC, Calabrese JM, Levine SS, Yeo GW, Rahl PB, Flynn RA, Young RA, Sharp PA 2008. Divergent transcription from active promoters. Science 322: 1849–1851 [DOI] [PMC free article] [PubMed] [Google Scholar]
- Shivaswamy S, Bhinge A, Zhao Y, Jones S, Hirst M, Iyer VR 2008. Dynamic remodeling of individual nucleosomes across a eukaryotic genome in response to transcriptional perturbation. PLoS Biol 6: e65 doi: 10.1371/journal.pbio.0060065 [DOI] [PMC free article] [PubMed] [Google Scholar]
- Suzuki Y, Sugano S 2003. Construction of a full-length enriched and a 5′-end enriched cDNA library using the oligo-capping method. Methods Mol Biol 221: 73–91 [DOI] [PubMed] [Google Scholar]
- Suzuki H, Forrest AR, van Nimwegen E, Daub CO, Balwierz PJ, Irvine KM, Lassmann T, Ravasi T, Hasegawa Y, de Hoon MJ, et al. 2009. The transcriptional network that controls growth arrest and differentiation in a human myeloid leukemia cell line. Nat Genet 41: 553–562 [DOI] [PMC free article] [PubMed] [Google Scholar]
- Taft RJ, Glazov EA, Cloonan N, Simons C, Stephen S, Faulkner GJ, Lassmann T, Forrest AR, Grimmond SM, Schroder K, et al. 2009. Tiny RNAs associated with transcription start sites in animals. Nat Genet 41: 572–578 [DOI] [PubMed] [Google Scholar]
- Tsuchihara K, Suzuki Y, Wakaguri H, Irie T, Tanimoto K, Hashimoto S, Matsushima K, Mizushima-Sugano J, Yamashita R, Nakai K, et al. 2009. Massive transcriptional start site analysis of human genes in hypoxia cells. Nucleic Acids Res 37: 2249–2263 [DOI] [PMC free article] [PubMed] [Google Scholar]
- Tsuritani K, Irie T, Yamashita R, Sakakibara Y, Wakaguri H, Kanai A, Mizushima-Sugano J, Sugano S, Nakai K, Suzuki Y 2007. Distinct class of putative “non-conserved” promoters in humans: Comparative studies of alternative promoters of human and mouse genes. Genome Res 17: 1005–1014 [DOI] [PMC free article] [PubMed] [Google Scholar]
- Ueda HR, Hayashi S, Matsuyama S, Yomo T, Hashimoto S, Kay SA, Hogenesch JB, Iino M 2004. Universality and flexibility in gene expression from bacteria to human. Proc Natl Acad Sci 101: 3765–3769 [DOI] [PMC free article] [PubMed] [Google Scholar]
- Wakaguri H, Yamashita R, Suzuki Y, Sugano S, Nakai K 2008. DBTSS: Database of transcription start sites, progress report 2008. Nucleic Acids Res 36: D97–D101 [DOI] [PMC free article] [PubMed] [Google Scholar]
- Wang Z, Gerstein M, Snyder M 2009. RNA-Seq: A revolutionary tool for transcriptomics. Nat Rev Genet 10: 57–63 [DOI] [PMC free article] [PubMed] [Google Scholar]
- Willingham AT, Gingeras TR 2006. TUF love for “junk” DNA. Cell 125: 1215–1220 [DOI] [PubMed] [Google Scholar]
- Xu Z, Wei W, Gagneur J, Perocchi F, Clauder-Munster S, Camblong J, Guffanti E, Stutz F, Huber W, Steinmetz LM 2009. Bidirectional promoters generate pervasive transcription in yeast. Nature 457: 1033–1037 [DOI] [PMC free article] [PubMed] [Google Scholar]


