Abstract
Lipid rafts reportedly have a role in coalescing key signaling molecules into the immunological synapse during T cell activation, thereby modulating T cell receptor (TCR) signaling activity. Recent findings suggest that a correlation may exist between increased levels of glycosphingolipids (GSLs) in the lipid rafts of T cells and a heightened response of those T cells toward activation. Here, we show that lowering the levels of GSLs in CD4+ T cells using a potent inhibitor of glucosylceramide synthase (Genz-122346) led to a moderation of the T cell response toward activation. TCR proximal signaling events, such as phosphorylation of Lck, Zap70 and LAT, as well as early Ca2+ mobilization, were attenuated by treatment with Genz-122346. Concomitant with these events were significant reductions in IL-2 production and T cell proliferation. Similar findings were obtained with CD4+ T cells isolated from transgenic mice genetically deficient in GM3 synthase activity. Interestingly, lowering the GSL levels in CD4+ T cells by either pharmacological inhibition or disruption of the gene for GM3 synthase also specifically inhibited the differentiation of T cells to the Th17 lineage but not to other Th subsets in vitro. Taken together with the recently reported effects of Raftlin deficiency on Th17 differentiation, these results strongly suggest that altering the GSL composition of lipid rafts modulates TCR signaling activity and affects Th17 differentiation.
Keywords: Cytokine, Ganglioside, Glycolipids, Immunology, T Cell Receptor, Glycosphingolipids, T Cell Differentiation, TCR Signaling
Introduction
Lipid rafts are specialized membrane microdomains enriched in cholesterol, sphingomyelin, and glycosphingolipids (GSLs).2 They are often viewed as microplatforms within which discrete protein signal transductions can occur (1, 2). The involvement of lipid rafts in T cell activation has been studied largely in the context of T cell receptor (TCR) proximal signaling following its engagement with cognate peptide-MHC complexes. Their role has also been probed using surrogate methods of T cell activation that seek to cluster the TCR complex, such as with an anti-CD3 antibody (3–13). For example, it has been reported that although the TCR-CD3 complex is only weakly associated with lipid rafts in resting T cells, this association is significantly increased upon their activation (14). It is likely that this increase in association of TCR-CD3 with the lipid rafts helps to bring the complex into the proximity of raft-resident protein-tyrosine kinases of the Src family, such as Lck (15–17). This immediacy facilitates the phosphorylation of key TCR proximal signaling molecules, such as Zap70 and LAT (adaptor protein linker for activation of T cells). Phosphorylated LAT then serves as a scaffold to facilitate the formation of a multisubunit signaling complex containing various signaling molecules, such as phospholipase Cγ1, GADS/SLP-76, Grb2, and PI3K, as well as other entities. It is these highly orchestrated actions of downstream signaling cascades that elicit the process of T cell activation. The act of clustering signaling molecules in the lipid rafts may also serve to segregate them from inhibitory phosphatases, such as CD45, during T cell activation (7, 18).
The role of lipid rafts in T cell activation has also been studied using biochemical approaches (19–21). The most compelling data demonstrating an involvement of lipid rafts in TCR signaling come from studies that manipulated the key TCR proximal signaling molecule, Lck. Lck is normally acylated at the N terminus through myristoylation and S-palmitoylation, which mediate its localization to lipid rafts. Lck-deficient T cells or cells harboring acylation-defective Lck mutants that retain enzymatic activity but are incapable of translocating into lipid rafts are unable to reproduce the early signaling events triggered by engagement of the TCR (15, 17, 22). In addition, an Lck chimeric protein with a non-lipid raft-localizing transmembrane domain also fails to reconstitute early TCR signaling events unless it is brought into proximity of the TCR-CD3 complex by antibody-mediated cross-linking (7). These data strongly argue that the clustering of TCR-CD3 complex with the lipid raft-localized Lck is critical for initiating TCR signaling.
Several recent reports also suggest a correlation between high levels of GSLs, in particular GM1 in T lymphocytes from patients with systemic lupus erythematosus, and a heightened response toward activation. These observations infer that the composition and dynamics of lipid rafts might contribute to the abnormal T cell behavior in systemic lupus erythematosus (23, 24). A subsequent study showing that treatment with atorvastatin can restore Lck expression and lipid raft-associated signaling in T cells from patients with systemic lupus erythematosus, presumably by lowering lipid levels, further supports this notion (25). The role of GSLs in TCR signaling and T cell activation has also been studied using inhibitors of GSL biosynthesis. Treatment of T cells with d-threo-1-phenyl-2-decanoylamino-3-morpholino-1-propanol, an inhibitor of glucosylceramide synthase, attenuates TCR signaling and T cell activation as indicated by a reduction in the expression of markers of T cell activation and secretion of IFN-γ (26). However, this effect is not observed with myriocin, an inhibitor of serine palmitoyltransferase that acts at an earlier step of sphingolipid synthesis, suggesting that inhibition of GSL synthesis at different nodes in the biosynthetic pathway can lead to distinctive outcomes. Here, we used a more potent and specific inhibitor of glucosylceramide synthase to decrease GSL synthesis in T cells and assessed its impact on TCR signaling and T cell activation. We observed that lowering the GSL levels impaired TCR signaling and T cell activation. Similar results were obtained with T cells isolated from a transgenic mouse that had been rendered deficient in GM3 synthase activity. More intriguingly, we also observed that a deficiency in GSLs specifically inhibited Th17 differentiation in vitro without affecting the other Th subsets examined. Taken together, these results indicate that altering the lipid composition of lipid rafts has profound effects on T cell activation and differentiation.
EXPERIMENTAL PROCEDURES
Materials
Anti-human LAT and anti-human Lck antibodies were purchased from Santa Cruz Biotechnology Inc. Anti-human Zap70 antibody (clone 2F3.2), anti-phosphorylated LAT (Tyr191) antibody, and anti-phosphorylated Src antibody (clone 2N8), that also recognizes phospho-Lck, were obtained from Upstate Biotechnology Inc. Anti-phosphorylated Zap70 (Tyr292) antibody was from Sigma. Anti-GAPDH and anti-flotillin-1 antibodies were purchased from Abcam and BD Biosciences, respectively. Goat anti-rabbit IgG and anti-mouse IgG coupled with HRP were acquired from Pierce. Dynabeads coupled with anti-human CD3/CD28 or anti-mouse CD3/CD28 antibody were obtained from Invitrogen. Soluble anti-mouse CD3ϵ (clone 145.2C11), anti-mouse CD28 (clone 37.51), anti-human CD3ϵ (clone OKT3), anti-CD28 (clone CD28.6), anti-CD25 (clone PC.61), and anti-mouse RORγt antibodies were purchased from eBioscience. All cytokines were obtained either from R&D Systems or PeproTech.
Treatment of Jurkat T Cells with Genz-123346
Freshly propagated Jurkat cells were maintained in RPMI 1640 medium containing 25 mm HEPES, 1 mm sodium pyruvate, 10% FBS, 1× penicillin/streptomycin, and 50 μm β-mercaptoethanol at 37 °C under 5% CO2. Genz-123346 ((1R,2R)-nonanoic acid[2-(2,3-dihydrobenzo(1,4)dioxin-6-yl)-2-hydroxy-1-pyrrolidin-1-yl-methylethyl]amide-l-tartaric acid salt; Genzyme Corp.), an inhibitor of glucosylceramide synthase, was added at an initial concentration of 250 nm on day 1 and supplemented every 24 h to a final nominal concentration of 750 nm during the 3 days of culture.
Cell-surface Staining of GM1 and CD3
Genz-123346-treated or mock-treated Jurkat T cells were collected by centrifugation and washed once with PBS. Cells were resuspended in 0.5 ml of cholera toxin B (CTB) binding buffer (PBS containing 0.5% BSA) and divided into two aliquots. One aliquot was stained with CTB-Alexa Fluor 488 and anti-CD3ϵ antibody and the other with Alexa Fluor 488 coupled to an anti-hamster IgG isotype control and anti-CD3ϵ antibody on ice for 30 min in the dark. After staining, the cells were washed twice with PBS and fixed in 2% paraformaldehyde for 15 min at room temperature in the dark. Samples were read on a BD LSR II flow cytometer (BD Biosciences), and the data were analyzed using the FlowJo Version 7.2 (TreeStar).
Activation of T Cells
Genz-123346-treated or mock-treated Jurkat T cells (∼2 × 10⁷) were activated with anti-human CD3/CD28 antibody coupled Dynabeads for 0 (no Dynabeads), 1, 5 and 15 min at a cell/bead ratio of 1:1. Activation was initiated by mixing the beads with the cells in a flask with gentle rocking in a humidified CO2 incubator set at 37 °C. About 5 × 10⁶ cells were collected for each time point into a prechilled 50-ml Falcon tube. The reaction was stopped by the addition of 10 volumes of ice-cold PBS, and the samples were placed in an ice water slurry bath until all the time points were collected. Cells were pelleted by brief centrifugation at 1500 rpm for 5 min at 4 °C. The cell pellets were resuspended, washed with 1 ml of ice-cold PBS, repelleted as described above, frozen on dry ice, and stored at −80 °C.
Fractionation Studies
Jurkat T cells (∼2 × 10⁷) were processed as described above, after which the cell pellets were lysed by the addition of 630 μl of ice-cold lysis buffer (0.15 m NaCl and 25 mm MES (pH 6.5), 0.2% Triton X-100, 1 μg/ml leupeptin, 1 μg/ml aprotinin, 1 mm phenylmethanesulfonyl fluoride, 1 mm sodium orthovanadate, and 50 mm sodium fluoride), followed by homogenization with 10 strokes in a glass Dounce homogenizer with a tight-fitting pestle. Cell lysates were left on ice for 1 h to solubilize the cell membranes, after which they were adjusted to 45% sucrose by the addition of an equal volume of 90% (w/v) sucrose in 0.15 m NaCl and 25 mm MES (pH 6.5) and fractionated over a step sucrose gradient as described by Tavano et al. (16). Twelve fractions (430 μl each) were collected, frozen on dry ice, and stored at −80 °C. The samples were processed for Western blot analysis, after which the blots were probed with anti-LAT, anti-phospho-LAT, or anti-flotillin-1 (a lipid raft marker) antibody. Western blot films were scanned on an HP Scanjet G3010 photo scanner, and signals of total LAT and phosphorylated LAT in fractions 2–5 (raft fractions) were quantified using NIH ImageJ software. The ratios of LAT were calculated based on the combined signals in fractions 2–5.
Western Blot Analysis of TCR Signaling Molecules
Frozen cell pellets were lysed in 200 μl of cell lysis buffer (50 mm Tris (pH 7.5), 150 mm NaCl, 1% Triton X-100, 0.25% SDS, 1 mm EDTA, 1 mm NaF, and 5 mm sodium orthovanadate) preheated to 100 °C and boiled in a heating block at 100 °C for another 5 min. Samples were sonicated briefly until no longer viscous (∼5 s), and the protein content was determined using the Micro BCA protein assay kit (Pierce). Approximately 25 μg of total protein was subjected to electrophoresis, after which the separated proteins were transferred onto nitrocellulose membranes and probed using antibodies against Lck, Zap70, and LAT or their phosphorylated counterparts. GAPDH was used to monitor for variations in protein loading.
Calcium Mobilization Assay
Approximately 50 ml of Genz-123346-treated or mock-treated Jurkat T cells (total of 2 × 10⁷) in medium was treated with Fura-2 acetoxymethyl ester at a final concentration of 5 μm for 60 min in a cell culture incubator. The Fura-2 acetoxymethyl ester-treated cells were then collected by centrifugation, resuspended in 2 ml of assay buffer (140 mm NaCl, 5 mm KCl, 0. 7 mm CaCl2, 0.7 mm MgCl2, 20 mm HEPES, 10 mm glucose, and 0.1% BSA (pH 7.4)), and allowed to equilibrate for 10 min. Approximately 400 μl of the labeled cells was added to a fluorometer cuvette and supplemented with CaCl2 to a final concentration of 5 mm. The base line was recorded for 1 min, after which anti-CD3/CD28 antibody-coupled Dynabeads (or other controls) were added at a cell/bead ratio of 1:2, and the calcium response was recorded for up to 300 s using an RF-5301PC spectrofluorophotometer (Shimadzu Corp.). Cytoplasmic calcium levels were calculated based on the fluorescence ratio of Fura-2 acetoxymethyl ester at excitation wavelengths of 340 and 380 nm as described previously (27).
Isolation, Culture, and Differentiation of Primary T Cells
Naive mouse T cells from spleens and lymph nodes of normal C57BL/6 mice and wild-type littermates of GM3 synthase knock-out (KO; −/−) and heterozygous (+/−) mice on a C57BL/6-129/svev mixed background (28) were purified using the CD4+CD62Lhigh cell isolation kit from Miltenyi Biotech. In some experiments, CD4+CD62LhighCD44lowCD25− cells were further purified by cell sorting on a FACSAria cell sorter (BD Biosciences). Approximately 2 × 10⁵ cells were plated onto U-bottom 96-well plates precoated with 1 μg/ml anti-CD3ϵ antibody in a total volume of 200 μl of DMEM supplemented with 10% FBS and 2 μg/ml soluble anti-CD28 antibody. Cells were differentiated into various helper T cell subtypes using the following conditions: Th0, no cytokines added; Th1, 10 ng/ml IL-12 plus 10 μg/ml anti-IL-4 antibody; Th2, 10 ng/ml IL-4 plus 10 μg/ml anti-IL-12 antibody; Th17, 5 ng/ml TGF-β, 25 ng/ml IL-6, 25 ng/ml IL-23, and 10 μg/ml anti-IL-4 and anti-IFN-γ antibodies; regulatory T cells, 5 ng/ml TGF-β and 25 ng/ml IL-2. When assessing the influence of Genz-123346 on Th17 differentiation, Genz-123346 was included in the culture medium from the start using the concentrations indicated in the figure legends. After 5 days of culture, cells were restimulated with 10 ng/ml phorbol 12-myristate 13-acetate and 1 μm ionomycin (Sigma) in the presence of GolgiStop (BD Biosciences) for 5 h in culture. Cells were stained with CTB-Alexa Fluor 488 for the surface level of GM1 and fluorescent antibodies against CD4 and CD25. For intracellular staining of cytokines, cells were permeabilized with fixation/permeabilization buffer from BD Biosciences and detected with antibodies against IFN-γ, IL-17, IL-4, and IL-10. Foxp3 and RORγt expression was analyzed with their respective antibodies after cells were permeabilized with fixation/permeabilization buffer from the eBioscience Foxp3 staining kit. Cells were also stained with 7-aminoactinomycin D or LIVE/DEAD Fixable Aqua stain (Invitrogen) to distinguish live cells from apoptotic cells. Samples were read on a BD LSR II flow cytometer, and the data were analyzed using FlowJo Version 7.2. IL-17 levels in Th17 differentiation culture media were measured using the IL-17A sandwich ELISA kit from eBioscience following the manufacturer's instruction.
Measurement of IL-2 and Cell Proliferation Assays
Primary human CD4+ T cells were treated with or without Genz-123346 for 3 days as described for Jurkat T cells, plated in duplicate onto U-bottom 96-well plates at a density of 1 × 10⁴ cells/well, and activated by the addition of anti-human CD3/CD28 antibody-coupled Dynabeads at a cell/bead ratio of 1:1 for 24 h. Culture media were collected and assayed for human IL-2 using an ELISA kit from eBioscience. Mouse CD4+ T cells isolated from splenocytes of wild-type littermates and heterozygous (+/−) and GM3 synthase KO (−/−) mice were seeded onto U-bottom wells precoated with 1 μg/ml anti-mouse CD3ϵ antibody in duplicate, along with 2 μg/ml soluble anti-mouse CD28 antibody. Cells were cultured for 24 h, after which the culture media were collected and assayed for murine IL-2 using an ELISA kit. To measure cell proliferation activity, duplicate sets of cells were cultured for 72 h, and [methyl-3H]thymidine (1.0 μCi/well; PerkinElmer Life Sciences) was then added for 16 h. Incorporated radioactivity was assessed by scintillation counting.
RESULTS
Treatment of Immune Cells with Genz-123346 Alters GSL Levels but Not the Composition of Membrane-associated Signaling Proteins
Genz-123346 is a recently described inhibitor of glucosylceramide synthase that catalyzes the first step in the biosynthesis of GSLs and gangliosides (29–31). Compared with its parent (d-threo-1-phenyl-2-decanoylamino-3-morpholino-1-propanol) and other known inhibitors of the enzyme (N-butyldeoxynojirimycin and N-(5′-adamantane-1′-yl-methoxy)pentyl-1-deoxynojirimycin), Genz-123346 exhibits greater potency (IC50 ∼ 14 nm) at lowering cell-surface GM1 levels in a cell-based inhibition assay. It also exhibits greater specificity than the other inhibitors, displaying no measurable inhibition of 1-O-acylceramide synthase, α-glucosidase, or the non-lysosomal glucocerebrosidase-2 at concentrations that effectively lower GSL levels. Consequently, treatment with Genz-123346 is not expected to elevate cellular levels of ceramide as opposed to d-threo-1-phenyl-2-decanoylamino-3-morpholino-1-propanol or glucosylceramide.
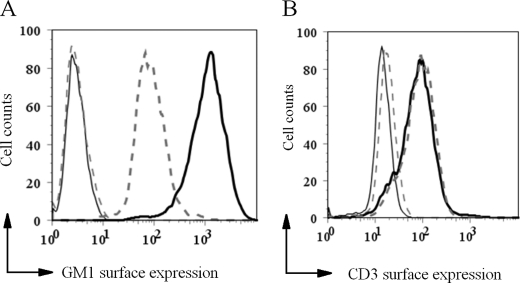
Treatment of Jurkat T cells with Genz-123346 for 3 days resulted in an ∼8-fold reduction in cell-surface GM1 levels as determined by staining with CTB followed by flow cytometry analysis (Fig. 1A). This reduction in GM1 levels did not affect cell-surface expression of CD3 (Fig. 1B). Genz-123346-mediated reduction of GM1 levels in Ramos B cells and U937 cells also did not alter the levels of CD79α and Fcγ receptor II, respectively (data not shown). Together, these data indicate that lowering the GSL levels in these immune cells does not translate into a significantly altered composition of signaling molecules on the cell surface.
FIGURE 1.
Effects of treating human Jurkat T cells with an inhibitor of glucosylceramide synthase (Genz-122346). A, treatment of Jurkat T cells with Genz-123346 for 3 days decreased the cell-surface levels of GM1 as measured by CTB labeling and flow cytometry. Solid line, mock-treated cells; dashed line, Genz-123346-treated cells. B, CD3 expression was not affected by Genz-123346 treatment as indicated by anti-CD3 antibody labeling followed by flow cytometry. No significant difference was detected between the Genz-122346-treated and untreated samples. Gray solid line, negative control; black solid line, mock-treated cells; dashed line, Genz-123346-treated cells.
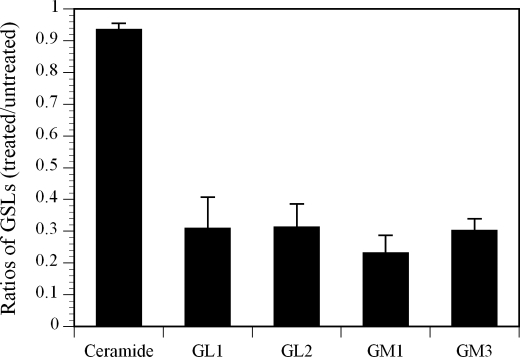
The impact of treating Jurkat T cells with Genz-123346 on GM1 and other GSLs was also measured by LC-MS. Fig. 2 shows that the amounts of GL1, GL2, GM1, and GM3 in the Genz-123346-treated Jurkat T cells were 3–4-fold lower than in the mock-treated cells. The disparity in the extent of reduction of GM1 noted here (∼4-fold) and in the flow cytometry study above (∼8-fold) was likely due to the fact that CTB stained only cell surface associated GM1, whereas the LC-MS method measured total cellular GM1 levels. Despite lowering a number of different GSLs, Genz-123346 did not affect cellular levels of ceramide (Fig. 2) or cell viability (data not shown).
FIGURE 2.
Analysis of GSLs in Jurkat T cells by LC-MS. Jurkat T cells treated with or without Genz-123346 for 3 days were collected, and their GSL content was analyzed by LC-MS. Results are expressed as mean ratios ± S.D. of GSLs in treated versus untreated cells.
Jurkat and Primary Human T Cells Treated with Genz-123346 Exhibit an Attenuated TCR proximal Signaling Activity and Reduced Production of IL-2
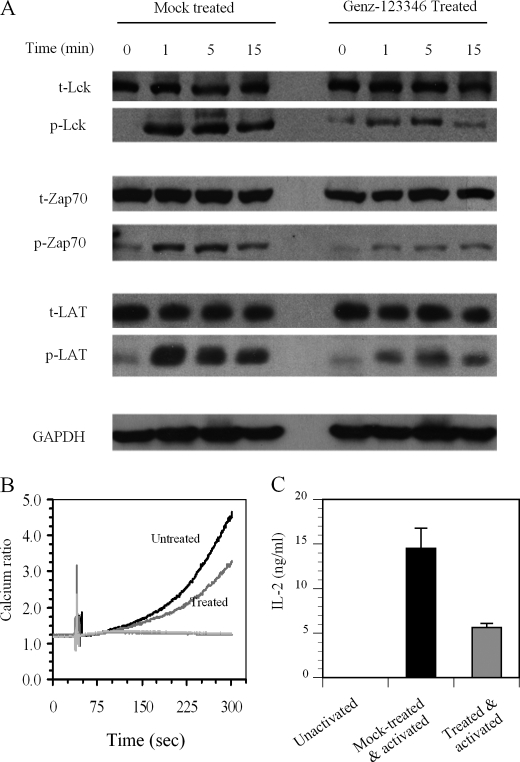
To assess the effect of lowering the GSL levels on TCR signaling, Jurkat T cells were incubated with or without Genz-123346 for 3 days and then activated by the addition of anti-CD3/CD28 antibody-coupled Dynabeads for 0, 1, 5, and 15 min. Analysis of the TCR proximal signaling molecules Lck, Zap70, and LAT showed that phosphorylation of these entities in Genz-123346-treated cells was significantly reduced for up to 15 min following activation (Fig. 3A). Western blot analysis indicated that the decrease in phosphorylation was not due to a reduction in the levels of these signaling proteins (Fig. 3A). Differences in the phosphorylation of these signaling molecules were most prominent at 1 and 5 min post-activation, becoming less obvious after 15 min. This observation is concordant with previous reports showing that phosphorylation of these molecules frequently begins to decline 15 min after T cell activation, returning to basal levels after 30 min (32). Consistent with the dampened phosphorylation of Lck, Zap70, and LAT, Genz-123346-treated Jurkat T cells also showed reduced calcium flux (another indicator of early TCR signaling following activation) compared with mock-treated cells (Fig. 3B).
FIGURE 3.
Treatment of Jurkat T cells with Genz-123346 inhibits TCR signaling and T cell activation. A, Jurkat T cells incubated with or without Genz-123346 for 3 days were activated for 0, 1, 5, and 15 min with anti-CD3/CD28 antibody-coupled Dynabeads. Cell lysates were analyzed by Western blotting for the total (t) amounts of Lck, Zap70, and LAT, as well as the amounts of the phosphorylated (p) proteins. GAPDH levels were measured to indicate loading variances. Slight backgrounds at 0 min in the phosphorylated protein samples might be due to the basal level of activation of Jurkat lymphoma T cells in culture. B, inhibition of the Ca2+ response by Genz-123346. Jurkat T cells treated or not with Genz-123346 for 3 days were activated as described for A, and the Ca2+ response was monitored as described under “Experimental Procedures.” C, Genz-123346 inhibited IL-2 production. Primary human T cells treated or not with Genz-123346 for 3 days were activated with Dynabeads as described for A and incubated for 24 h. IL-2 levels in the media determined by ELISA and are expressed as means ± S.D.
To determine whether the attenuated early TCR signaling activity observed following Genz-123346-mediated reduction in GSLs also extends to later phase T cell responses, IL-2 production (at 24 h post-activation) was measured. Naive human T cells isolated from peripheral blood were treated with Genz-123346 or mock-treated for 3 days and then activated with anti-CD3/CD28 antibody-coupled Dynabeads as described for Jurkat cells. Analysis of the culture media showed that IL-2 production levels were reduced by Genz-123346 treatment (Fig. 3C). Hence, the overall T cell responses from TCR proximal signaling activity to cytokine production are significantly dampened by Genz-123346-mediated reduction of GSL levels.
Inhibiting GSL Biosynthesis Impairs TCR Signaling without Affecting the Integrity of the Lipid Rafts
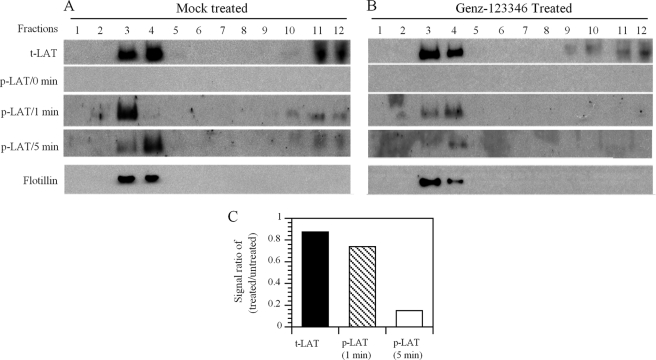
To determine whether the integrity and protein composition of the lipid rafts in the Jurkat T cells were affected by the reduction in GSL levels, mock-treated and Genz-123346-treated cells were subjected to subcellular fractionation by gradient centrifugation. Cells incubated with or without drug for 3 days followed by activation with anti-CD3/CD28 antibody-coupled Dynabeads for 0, 1, and 5 min were lysed and then fractionated. Flotillin, a marker of lipid rafts, was localized exclusively to fractions 3 and 4 of the gradient in both the mock- and drug-treated cell lysates (Fig. 4, A and B), suggesting that lowering the GSL levels had not affected the integrity of the rafts. Measurements of LAT from mock- and Genz-123346-treated cell lysates also showed no apparent differences in its subcellular distribution. The majority of LAT was co-localized with lipid rafts (fractions 3 and 4), with the remaining dispersed over fractions 9–12 (Fig. 4, A and B). This pattern of protein distribution is similar to that reported previously (16). Analysis of the fractions using anti-phospho-LAT antibody showed reduced phosphorylation in lysates prepared from the Genz-123346-treated cells at 1 and 5 min post-activation compared with the mock-treated cells (Fig. 4, A and B). Quantitation of the gels revealed that the most dramatic reduction was in phosphorylation of LAT at 5 min post-activation (Fig. 4C). Therefore, Genz-122346-mediated reduction in GSL levels does not grossly affect the integrity of the lipid rafts or alter the distribution and composition of the signaling proteins. However, the change in the GSL composition in lipid rafts results in a measurable reduction in TCR signaling activity.
FIGURE 4.
Reduction of GSLs by Genz-123346 inhibits TCR signaling without affecting the integrity of lipid rafts. Genz-123346-treated or untreated Jurkat T cells were activated with Dynabeads for 0 and 5 min, lysed, and fractionated by ultracentrifugation. Equal volumes of each fraction were analyzed by Western blotting using antibodies to LAT or flotillin (a marker of lipid rafts). Flotillin in the Genz-122346-treated or untreated cells was similarly confined to fractions 2–5, mainly in fractions 3 and 4. Fraction 1 represents the top of the gradient, and fraction 12 represents the bottom. Results are representative of three separate experiments. A, untreated cells; B, Genz-123346-treated cells; C, ratios of total (t) LAT and phosphorylated (p) LAT between treated and untreated cells of a representative study.
CD4+ T Cells from GM3 Synthase KO Mice Display Reduced Proliferative Activity and a Muted Response to Activation
A more physiologically relevant approach to probe the influence of GSLs on TCR signaling is to examine the activity of T cells from a transgenic mouse that is lacking in GM3 synthase (GM3S) activity (28). The biosynthesis of GM3 and all of the downstream GSLs in the a- and b-series is abolished in the GM3S KO mouse. The election to study a mouse model with this particular synthase deficiency as opposed to other enzymes engaged in the synthesis of GSLs was borne of GM3 being the precursor of more complex GSLs and its abundance in human T cells (33) and also because Zap70 reportedly associates with GM3 during T cell activation (34).
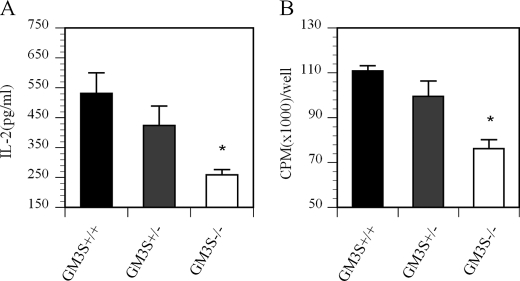
Splenic CD4+ T cells were isolated from GM3S KO (GM3S−/−), heterozygous (GM3S+/−), and wild-type littermate control (GM3S+/+) mice and then activated using a plate-bound anti-CD3 antibody supplemented with soluble anti-CD28 antibody. Culture media were collected 24 h later and assayed for the cytokine IL-2. A duplicate set of cells was similarly activated and cultured for 72 h before being subjected to a [3H]thymidine incorporation assay to measure their proliferation status. Fig. 5A shows that IL-2 production from T cells isolated from GM3S−/− and GM3S+/− mice was reduced to ∼50 and 75% of the levels observed in wild-type control mice, respectively. The proliferative activity of T cells prepared from GM3S−/− and GM3S+/− mice was also reduced compared with wild-type control mice (Fig. 5B). As with the IL-2 data, the proliferative activity of T cells from the GM3S+/− mice was intermediate between that of GM3S−/− and wild-type mice. These findings corroborate those noted above with Genz-122346 that lowering the GSL levels reduces T cell activation.
FIGURE 5.
Reduced GSL levels in GM3S-deficient T cells attenuates T cell activation and proliferation. CD4+ T cells were isolated from splenocytes of GM3S wild-type littermates (+/+) and GM3S heterozygous (+/−) and KO (−/−) mice. Cells were plated onto U-bottom 96-well plates precoated with anti-CD3 antibody and supplemented with soluble anti-CD28 antibody. A, after 24 h, IL-2 levels in the media were measured by ELISA. B, the proliferation status of the cells was measured by [3H]thymidine incorporation. Results are representative of two experiments. Data are presented as means ± S.D. *, p < 0.05 between GM3S+/+ and GM3S−/− mice.
Reducing the GSL Levels Inhibits the Differentiation of T Cells to the Th17 Lineage
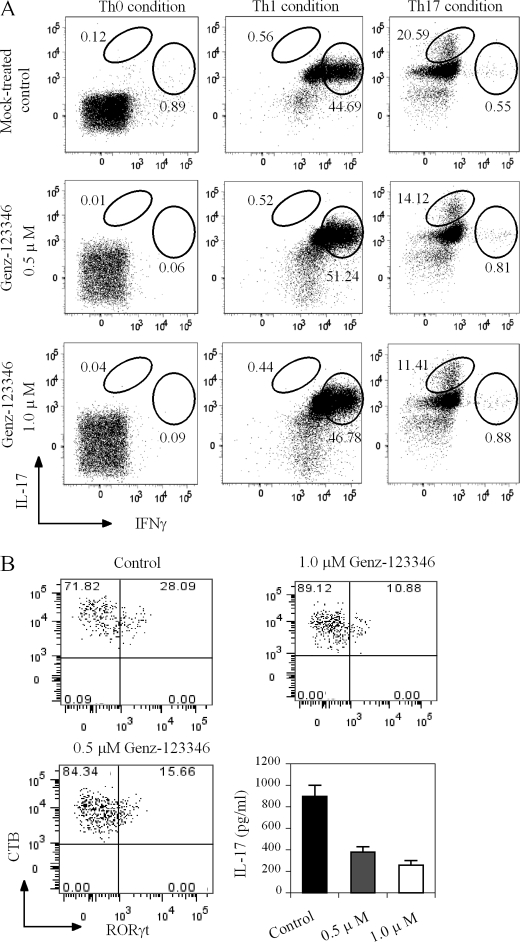
Naive T cells are able to differentiate into distinct subsets of effector cells depending on the activation signal and milieu of cytokines. The observation of a dampened TCR signaling activity and T cell activation in immune cells harboring lower amounts of GSLs prompted us to probe if this also impacted their ability to differentiate. To assess this, naive T cells were isolated from normal C57BL/6 mice and induced to differentiate into various Th cell types (Th1, Th2, Th17, and regulatory T) using well established conditions in the presence or absence of Genz-12336. As shown in Fig. 6A, the presence of Genz-123346 during the polarization process did not affect the ability of the cells to differentiate to Th1 cells or several other Th cell types (data not shown). However, there was a notable dose-dependent decrease in its ability to effect differentiation to IL-17-producing cells. An ∼50% reduction (from 20.59 to 11.41%) in IL-17-producing cells was achieved in the presence of 1 μm Genz-123346 (Fig. 6A, right panels). To confirm that these IL-17-producing cells were Th17 cells, they were stained with an antibody against RORγt, a Th17 lineage-specific transcription factor. As we were unable to co-stain the cells for IL-17, the levels of the cytokine in the culture media were measured. As shown in Fig. 6B, Genz-123346 treatment reduced the number of RORγt-positive Th17 cells in a manner similar to that observed for IL-17-producing cells. The number of cells that stained positive RORγt was reduced from 28.09% in untreated cells to 10.88% with 1 μm Genz-123346. As expected, IL-17 production was also significantly reduced by Genz-123346 treatment (Fig. 6B, lower right panel). Because purified naive T cells were used in our system, we believe the intracellular staining of IL-17 and RORγt can be used interchangeably for Th17 cells.
FIGURE 6.
Reduction of GSL levels by Genz-123346 inhibits Th17 differentiation. Naive CD4+CD62L+ T cells from wild-type C57BL/6 mice were used to assess the effects of Genz-123346 on Th differentiation. A, effect of Genz-123346 on differentiation of wild-type naive T cells into Th1 and Th17 subsets. Intracellular cytokines were stained using fluorescently labeled antibodies. Plots depict the expression of IFN-γ and IL-17 in live CD4+ gated cell populations. B, effect of Genz-123346 on Th17 differentiation as assessed by RORγt intracellular staining and IL-17 production. CTB denotes the GM1 level on the cell surface, which was reduced by Genz-123346 treatment. Results are representative of at least three studies.
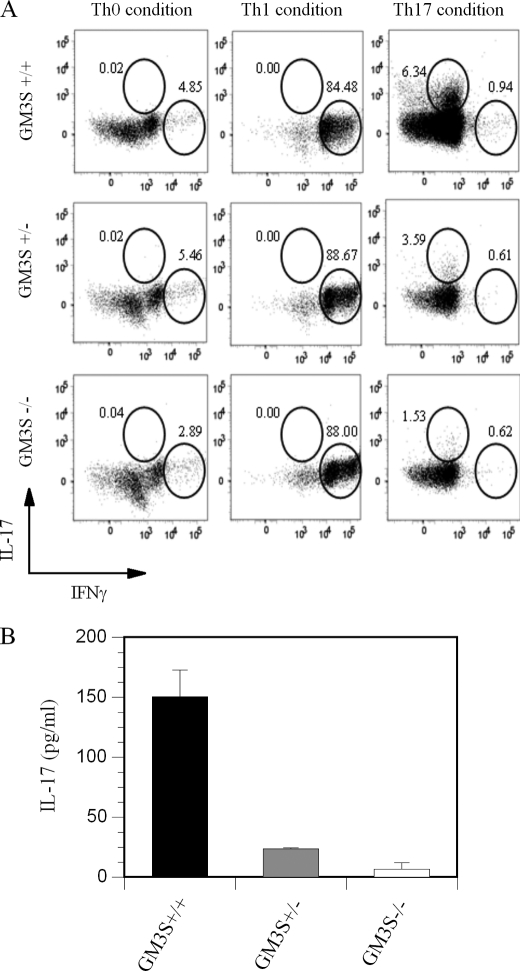
To eliminate the possibility that Genz-123346 might have had a direct impact on Th17 differentiation that is unrelated to GSL modulation, we also used T cells isolated from GM3S KO mice. A similar reduction in Th17 differentiation was observed with naive CD4+ T cells isolated from GM3S-deficient mice (1.53% Th17 cells) compared with those from their wild-type littermates (6.34% Th17 cells). The intermediate level (3.59%) of Th17 differentiation noted in GM3S+/− T cells again suggests that the relative levels of GSLs affect the extent of Th17 differentiation (Fig. 7A, right panels). The disparity in the extent of Th17 polarization between naive T cells from normal C57BL/6 mice (20.59%) (Fig. 6A, upper right panel) and T cells from GM3S wild-type littermates (6.34%) (Fig. 7A, upper right panel) might be due to differences in the genetic background of these mice. Reduction in Th17 differentiation was again confirmed by measuring levels of IL-17 in the media of GM3S+/+, GM3S+/−, and GM3S−/− cell cultures (Fig. 7B). A similar reduction in Th17 differentiation was observed using primary human T cells treated with 1 μm Genz-123346 (data not shown). Hence, a decrease in GSL results in a specific reduction in Th17 differentiation in response to T cell activation.
FIGURE 7.
Reduction of GSL levels through inactivation of GM3S inhibits Th17 differentiation. Naive CD4+CD62L+ T cells from GM3S KO (−/−) and heterozygous (+/−) mice and wild-type littermates (+/+) on a C57BL/6-129/svev mixed background were prepared and differentiated into various helper T cell subsets as described under “Experimental Procedures.” A, effect of GM3S deficiency on differentiation of naive T cells into Th1 and Th17 subsets. B, IL-17 levels in culture media of samples in A as measured by ELISA. Results are representative of at least three studies.
DISCUSSION
In this study, we have shown that lowering the levels of GSLs, which are major components of lipid rafts, using a potent glucosylceramide synthase inhibitor (Genz-123346) attenuated TCR signaling, T cell activation, and differentiation to the Th17 lineage. These observations were corroborated using T cells from a transgenic mouse lacking GM3S and therefore deficient in GM3 as well as other downstream GSLs. The findings of similarly altered TCR signaling and T cell activation in cells from the GM3S KO mouse indicated that the changes observed using Genz-123346 were not the result of nonspecific or off-target effects of the pharmacological agent, such as displacement of GSLs in the lipid rafts. Genz-123346 is a water-soluble compound, and inhibition of CTB binding to GM1 in the rafts occurred only after 24 h following treatment, suggesting that inhibition of GSL synthesis is necessary for the effect (data not shown). Rather, we posit that these effects likely reflected changes in the composition of GSLs residing in lipid rafts of T cells. Lowering the GSL levels did not appear to affect the integrity or the proteinaceous components of the lipid rafts, suggesting that it was the composition of lipid raft GSLs that likely played an important role in regulating the signal transduction activity and biology of T cells. Although it is unclear how GSLs influenced TCR signaling in the studies reported here, the ability of such lipids to affect other signaling entities is not without precedence. For example, GM3 has been reported to interact with the epidermal growth factor receptor via the N-acetylglucosamine moieties present on its oligosaccharide side chains (35, 36). This association of GM3 with the receptor has been implicated as a potential mode by which its tyrosine kinase and signaling activities are modulated. Perhaps more relevant is the report showing a direct association between GM3 and Zap70 in the plasma membrane microdomains following T cell activation (34). These reports of a direct interaction between GM3 and signaling entities further support a role for this ganglioside and perhaps other GSLs in signal modulation. However, because the GM3S-deficient mice retain the o-series of GSLs, it is likely that they play a lesser role than the a- and b-series in T cell signaling.
A more intriguing finding of our studies was the effect of lowering the GSL levels on the differentiation of Th subsets in vitro. A reduction in T cell GSL levels through either pharmacological inhibition of glucosylceramide synthase or genetic inactivation of GM3S (GM3S KO mice) specifically suppressed T cell differentiation to Th17 cells without affecting the polarization of other Th subsets, such as Th1, Th2 and regulatory T (Figs. 6 and 7 and data not shown). Further supporting the premise of a link between lipid rafts and T cell differentiation is the recent report by Saeki et al. (37) showing that a deficiency in the raft-resident protein Raftlin also specifically reduces Th17 differentiation but not the other Th subsets. These authors also noted impaired TCR signaling activity, including attenuated phosphorylation of TCR proximal signaling proteins, Ca2+ mobilization, and secretion of cytokines in Raftlin-deficient cells. In contrast, overexpression of Raftlin enhanced TCR signaling and generated a heightened T cell response. Together, these results suggest that the structural proteins and GSLs in lipid rafts play a role in modulating immune receptor signaling and Th17 differentiation. However, the mechanism by which changes in GSLs of lipid rafts affect Th17 differentiation remains unclear. Because Th17 differentiation from naive mouse CD4+ T cells requires T cell activation in the presence of TGF-β and IL-6, it is possible that lowering the GSL levels may interfere with the TCR activation step (Fig. 3) or affect the ability of the TGF-β receptor in the lipid rafts to mediate signal transduction (38).
Our findings are also consistent with those of several other groups (23, 24) who reported that an increase in GM1 levels (and perhaps other GSLs) on systemic lupus erythematosus T cells correlated with a hyper-responsive status of these diseased T cells. Along the same lines, CTB-induced lipid raft aggregation was shown to accelerate disease progression in lupus-prone mice (39). On the basis of these observations, we speculate that higher GSL levels in lipid rafts may act to positively recruit TCR proximal signaling proteins to the TCR complex or segregate them from the non-raft-resident negative signaling regulators, such as CD45. By favoring the collation of positive signaling molecules and reducing access of negative regulators, higher levels of GSLs in lipid rafts may promote the observed increase in T cell responsiveness toward stimulation. Given the inhibitory effects of lowering the GSL levels on Th17 differentiation and the well established role of Th17 in many autoimmune diseases, modulation of lipid raft GSLs with appropriate pharmacological agents may therefore represent an attractive approach for the treatment of autoimmune disorders.
Acknowledgments
We thank Richard Proia (National Institutes of Health) for the GM3S KO mouse, Joshua Pacheco for LC-MS analysis, Gina LaCorcia and John Dzuris for providing purified primary human T cells, and Juanita Campos-Rivera and Jose Sancho for helping with flow cytometry analysis. We are also grateful to John Williams, Melanie Ruzek, Diane Copeland, and other colleagues at Genzyme Corp. for helpful suggestions and discussions.
Yunxiang Zhu, Nathan Gumlaw, Jozsef Karman, Hongmei Zhao, Jinhua Zhang, Ji-Lei Jiang, Pete Maniatis, Andrea Edling, Wei-Lien Chuang, Craig Siegel, Johanne Kaplan, Canwen Jiang, and Seng H. Cheng are employees of Genzyme Corp.
- GSL
- glycosphingolipid
- TCR
- T cell receptor
- RORγt
- retinoic acid receptor-related orphan receptor γt
- CTB
- cholera toxin B
- KO
- knock-out
- GM3S
- GM3 synthase.
REFERENCES
- 1. Kasahara K., Sanai Y. (2000) Glycoconj. J 17, 153–162 [DOI] [PubMed] [Google Scholar]
- 2. Simons K., Toomre D. (2000) Nat. Rev. Mol. Cell Biol. 1, 31–39 [DOI] [PubMed] [Google Scholar]
- 3. Dykstra M., Cherukuri A., Pierce S. K. (2001) J. Leukocyte Biol. 70, 699–707 [PubMed] [Google Scholar]
- 4. Harder T., Engelhardt K. R. (2004) Traffic 5, 265–275 [DOI] [PubMed] [Google Scholar]
- 5. Horejsí V. (2003) Immunol. Rev. 191, 148–164 [DOI] [PubMed] [Google Scholar]
- 6. Horejsí V. (2004) Immunol. Lett. 92, 43–49 [DOI] [PubMed] [Google Scholar]
- 7. Janes P. W., Ley S. C., Magee A. I. (1999) J. Cell Biol. 147, 447–461 [DOI] [PMC free article] [PubMed] [Google Scholar]
- 8. Janes P. W., Ley S. C., Magee A. I., Kabouridis P. S. (2000) Semin. Immunol. 12, 23–34 [DOI] [PubMed] [Google Scholar]
- 9. Miceli M. C., Moran M., Chung C. D., Patel V. P., Low T., Zinnanti W. (2001) Semin. Immunol. 13, 115–128 [DOI] [PubMed] [Google Scholar]
- 10. Seminario M. C., Bunnell S. C. (2008) Immunol. Rev. 221, 90–106 [DOI] [PubMed] [Google Scholar]
- 11. Tuosto L., Parolini I., Schröder S., Sargiacomo M., Lanzavecchia A., Viola A. (2001) Eur. J. Immunol. 31, 345–349 [DOI] [PubMed] [Google Scholar]
- 12. Yokosuka T., Sakata-Sogawa K., Kobayashi W., Hiroshima M., Hashimoto-Tane A., Tokunaga M., Dustin M. L., Saito T. (2005) Nat. Immunol. 6, 1253–1262 [DOI] [PubMed] [Google Scholar]
- 13. Zeyda M., Stulnig T. M. (2006) Prog. Lipid Res. 45, 187–202 [DOI] [PubMed] [Google Scholar]
- 14. Montixi C., Langlet C., Bernard A. M., Thimonier J., Dubois C., Wurbel M. A., Chauvin J. P., Pierres M., He H. T. (1998) EMBO J. 17, 5334–5348 [DOI] [PMC free article] [PubMed] [Google Scholar]
- 15. Kosugi A., Hayashi F., Liddicoat D. R., Yasuda K., Saitoh S., Hamaoka T. (2001) Immunol. Lett. 76, 133–138 [DOI] [PubMed] [Google Scholar]
- 16. Tavano R., Gri G., Molon B., Marinari B., Rudd C. E., Tuosto L., Viola A. (2004) J. Immunol. 173, 5392–5397 [DOI] [PubMed] [Google Scholar]
- 17. Yasuda K., Kosugi A., Hayashi F., Saitoh S., Nagafuku M., Mori Y., Ogata M., Hamaoka T. (2000) J. Immunol. 165, 3226–3231 [DOI] [PubMed] [Google Scholar]
- 18. He X., Woodford-Thomas T. A., Johnson K. G., Shah D. D., Thomas M. L. (2002) Eur. J. Immunol. 32, 2578–2587 [DOI] [PubMed] [Google Scholar]
- 19. Pizzo P., Giurisato E., Tassi M., Benedetti A., Pozzan T., Viola A. (2002) Eur. J. Immunol. 32, 3082–3091 [DOI] [PubMed] [Google Scholar]
- 20. Rouquette-Jazdanian A. K., Pelassy C., Breittmayer J. P., Aussel C. (2006) Cell. Signal. 18, 105–122 [DOI] [PubMed] [Google Scholar]
- 21. Rouquette-Jazdanian A. K., Pelassy C., Breittmayer J. P., Aussel C. (2007) Cell. Signal. 19, 1404–1418 [DOI] [PubMed] [Google Scholar]
- 22. Kabouridis P. S., Magee A. I., Ley S. C. (1997) EMBO J. 16, 4983–4998 [DOI] [PMC free article] [PubMed] [Google Scholar]
- 23. Jury E. C., Kabouridis P. S., Flores-Borja F., Mageed R. A., Isenberg D. A. (2004) J. Clin. Invest. 113, 1176–1187 [DOI] [PMC free article] [PubMed] [Google Scholar]
- 24. Krishnan S., Nambiar M. P., Warke V. G., Fisher C. U., Mitchell J., Delaney N., Tsokos G. C. (2004) J. Immunol. 172, 7821–7831 [DOI] [PubMed] [Google Scholar]
- 25. Jury E. C., Isenberg D. A., Mauri C., Ehrenstein M. R. (2006) J. Immunol. 177, 7416–7422 [DOI] [PubMed] [Google Scholar]
- 26. Blank N., Schiller M., Gabler C., Kalden J. R., Lorenz H. M. (2005) Biochem. Pharmacol. 71, 126–135 [DOI] [PubMed] [Google Scholar]
- 27. Nakamura I., Nakai Y., Izumi H. (1996) Tohoku J. Exp. Med. 179, 291–294 [DOI] [PubMed] [Google Scholar]
- 28. Yamashita T., Hashiramoto A., Haluzik M., Mizukami H., Beck S., Norton A., Kono M., Tsuji S., Daniotti J. L., Werth N., Sandhoff R., Sandhoff K., Proia R. L. (2003) Proc. Natl. Acad. Sci. U.S.A. 100, 3445–3449 [DOI] [PMC free article] [PubMed] [Google Scholar]
- 29. Kolter T., Proia R. L., Sandhoff K. (2002) J. Biol. Chem. 277, 25859–25862 [DOI] [PubMed] [Google Scholar]
- 30. Lee L., Abe A., Shayman J. A. (1999) J. Biol. Chem. 274, 14662–14669 [DOI] [PubMed] [Google Scholar]
- 31. Zhao H., Przybylska M., Wu I. H., Zhang J., Siegel C., Komarnitsky S., Yew N. S., Cheng S. H. (2007) Diabetes 56, 1210–1218 [DOI] [PubMed] [Google Scholar]
- 32. Lee K. H., Dinner A. R., Tu C., Campi G., Raychaudhuri S., Varma R., Sims T. N., Burack W. R., Wu H., Wang J., Kanagawa O., Markiewicz M., Allen P. M., Dustin M. L., Chakraborty A. K., Shaw A. S. (2003) Science 302, 1218–1222 [DOI] [PubMed] [Google Scholar]
- 33. Sorice M., Longo A., Garofalo T., Mattei V., Misasi R., Pavan A. (2004) Glycoconj. J. 20, 63–70 [DOI] [PubMed] [Google Scholar]
- 34. Garofalo T., Lenti L., Longo A., Misasi R., Mattei V., Pontieri G. M., Pavan A., Sorice M. (2002) J. Biol. Chem. 277, 11233–11238 [DOI] [PubMed] [Google Scholar]
- 35. Yoon S. J., Nakayama K., Hikita T., Handa K., Hakomori S. I. (2006) Proc. Natl. Acad. Sci. U.S.A. 103, 18987–18991 [DOI] [PMC free article] [PubMed] [Google Scholar]
- 36. Yoon S. J., Nakayama K., Takahashi N., Yagi H., Utkina N., Wang H. Y., Kato K., Sadilek M., Hakomori S. I. (2006) Glycoconj. J. 23, 639–649 [DOI] [PubMed] [Google Scholar]
- 37. Saeki K., Fukuyama S., Ayada T., Nakaya M., Aki D., Takaesu G., Hanada T., Matsumura Y., Kobayashi T., Nakagawa R., Yoshimura A. (2009) J. Immunol. 182, 5929–5937 [DOI] [PubMed] [Google Scholar]
- 38. Ma X., Wang Q., Jiang Y., Xiao Z., Fang X., Chen Y. G. (2007) Biochem. Biophys. Res. Commun. 356, 67–71 [DOI] [PubMed] [Google Scholar]
- 39. Deng G. M., Tsokos G. C. (2008) J. Immunol. 181, 4019–4026 [DOI] [PMC free article] [PubMed] [Google Scholar]


