

Abstract
G protein-coupled receptor (GPCR) pathways control glucose and fatty acid metabolism and the onset of obesity and diabetes. Regulators of G protein signaling (RGS) are GTPase-activating proteins (GAPs) for Gi and Gq α-subunits that control the intensity and duration of GPCR signaling. Herein we determined the role of Rgs16 in GPCR regulation of liver metabolism. Rgs16 is expressed during the last few hours of the daily fast in periportal hepatocytes, the oxygen-rich zone of the liver where lipolysis and gluconeogenesis predominate. Rgs16 knock-out mice had elevated expression of fatty acid oxidation genes in liver, higher rates of fatty acid oxidation in liver extracts, and higher plasma β-ketone levels compared with wild type mice. By contrast, transgenic mice that overexpressed RGS16 protein specifically in liver exhibited reciprocal phenotypes as well as low blood glucose levels compared with wild type littermates and fatty liver after overnight fasting. The transcription factor carbohydrate response element-binding protein (ChREBP), which induces fatty acid synthesis genes in response to high carbohydrate feeding, was unexpectedly required during fasting for maximal Rgs16 transcription in liver and in cultured primary hepatocytes during gluconeogenesis. Thus, RGS16 provides a signaling mechanism for glucose production to inhibit GPCR-stimulated fatty acid oxidation in hepatocytes.
Keywords: Fatty Acid Oxidation, G Protein-coupled Receptor (GPCR), G Proteins, Gene Knock-out, Glucose Metabolism, Transgenic, G alpha GAP, RGS Proteins, Fasting and Refeeding, Fatty Liver/Hepatic Steatosis
Introduction
Body weight homeostasis is maintained, in part, by complex communication between G protein-coupled receptors (GPCRs)5 localized in the brain and in the periphery. Long term and short term satiety signals are integrated to create a dynamic equilibrium between energy expenditure and food intake.
The activation cycle of heterotrimeric G proteins revolves around receptor-catalyzed guanine nucleotide exchange on the Gα subunit; the GαGDPβγ heterotrimer is inactive, whereas hormone binding to receptor catalyzes formation of active GαGTP (1). RGS proteins are GTPase-activating proteins (GAPs) for Gi- and Gq/11-class α-subunits and can terminate signaling by restoring the inactive GαGDPβγ heterotrimer, thereby uncoupling hormone-bound receptor from effector protein activation (2–4). An important complexity of G protein signaling is that both GαGTP and free Gβγ subunits can independently regulate the production of second messengers by effector proteins. RGS proteins can integrate and coordinate responses to separate Gα and Gβγ signals to generate an emergent property, such as RGS-mediated Ca2+ oscillations evoked by Gαq/11-coupled agonists (5–8).
Given that Rgs mRNAs were up-regulated by GPCR agonists controlling mating responses and nutrient sensing in fungi (9–11), we hypothesized that Rgs expression could be utilized as a marker for unknown Gi- or Gq/11-mediated signal transduction in mammalian physiology. To explore novel G protein function in liver, we surveyed differential regulation of Rgs genes in liver of fasted and refed wild type mice (12). Interestingly, of the 21 Rgs genes, only Rgs16 mRNA was diurnally expressed, being induced during the second half of the light phase and rapidly degraded after feeding. Rgs16 mRNA was induced by fasting in periportal hepatocytes, the oxygen-rich zone in liver that preferentially supports fatty acid oxidation and gluconeogenesis (13).
Ongoing studies in our laboratory focus on the role liver G protein signaling in preserving the multifaceted balance of energy intake versus energy expenditure by utilizing Rgs16 as a marker for GPCR activation. Here we characterized Rgs16 mRNA and protein regulation during fasting and refeeding in wild type, Rgs16 transgenic gain-of-function, and knock-out loss-of-function mice. Interestingly, transgenic mice that express RGS16 protein in liver under the control of a doxycycline-inducible promoter develop fatty liver during a prolonged fast, as do Gα11−/− knock-out mice (after 10 days on a high fat, high carbohydrate diet). Rgs16 knock-out mice exhibit elevated fatty acid oxidation rates and plasma β-ketone levels, whereas transgenic mice that express Rgs16 specifically in liver have reciprocal phenotypes. The glucose-dependent transcription factor carbohydrate response element-binding protein (ChREBP) was required for maximal induction of Rgs16 during fasting, suggesting that RGS16 couples hepatic glucose production with the rate of fatty acid oxidation. We propose that RGS16 feedback inhibits Gi/Gq-mediated fatty acid oxidation in liver.
EXPERIMENTAL PROCEDURES
Materials
Reagents for cell culture, TRIzol, SuperScript II reverse transcriptase, and 100 mm dNTP set were from Invitrogen; PCR kit HotstarTaq DNA polymerase was from Qiagen; reagents and materials for qPCR were from Bio-Rad and Applied Biosystems; radioactive substances were from Amersham Biosciences; and other common chemicals were purchased from Sigma unless otherwise noted.
Animals and Colony Conditions
The mouse colony was maintained at 20 °C under a standard 12-h light cycle (12 h light/dark, lights on at Zeitgeber time 0 (ZT0; 6 a.m.); lights off at ZT12 (6 p.m.). C57BL/6 mice were purchased from Jackson Laboratories (Bar Harbor, ME). Female C57BL/6 mice in feeding studies were pair-caged. Male Rgs16 transgenic, Gα11−/− mice, and wild type controls were caged individually during feeding studies. Mice were ad libitum fed standard mouse chow (normal chow) containing 6% total energy as fat (Teklad 7002, Harlan Teklad Laboratories, Indianapolis, IN), except where noted. In experiments with restricted feeding, mice had free access to food only during 4 h from ZT4 to ZT8, water ad libitum. The high fat diet contained 41% calories as fat, 40% carbohydrate, and 19% protein (Teklad, catalog no. 96001); high protein diet contained 67% protein, 10% carbohydrate, and 23% fat (TestDiet, catalog no. 8091); and high carbohydrate diet contained 25% protein, 75% carbohydrate, and 0% fat (non-nutritive bulk and mineral mix (Alphacel) 20% by weight; ICN catalog no. 960238). Mice were 6–8 weeks in age before they were switched from normal chow to an experimental diet, and/ or drinking water was supplemented with doxycycline (0.1 mg/ml) and/or sucrose (5%), glucose (5%), or saccharin (0.45%). Mice were weighed to the nearest 0.1 g on an electronic scale. Blood glucose levels were measured by a glucometer (Ascensia ELITE, Bayer). Mice were sacrificed by cervical dislocation, and individual livers were dissected, frozen in liquid nitrogen immediately, and stored at −80 °C for future analysis. All animal studies were approved by the University of Texas Southwestern Institutional Animal Care and Use Committee review board.
Transgenic Rgs16 (TgR16) Mice
The ApoE::rtTA construct was made by ligating the optimized reverse tetracycline transactivator (rtTA2S-M2) (14) between the constitutive human ApoE gene promoter and its hepatic control region in the pLiv-11 vector (as described in Ref. 15). The TetON::Rgs16 construct was generated by inserting the Rgs16 cDNA tagged with a C-terminal triple repeat of the c-Myc epitope (Myc3) downstream of the tetracycline-responsive promoter in the plasmid pTRE. The β-globin polyadenylation site was inserted into TetON::Rgs16. The transgenes were linearized by restriction endonuclease digestion with Xho and SapI, and DNA fragments were isolated from agarose gel and microinjected into fertilized mouse eggs (C57BL/6XDBA). Transgenic mice were genotyped by PCR amplification with forward and reverse primer pairs for ApoE::rtTA (JH001, 5′-AATGGAGTCGGTATCGAAGG-3′; DS120, 5′-TCGTACTGTTTCTCTGTTGG-3′) and TetON::Rgs16 (JH003, 5′-TGACCTCCATAGAAGACACC-3′; JH004, 5′-GTATCGGAGCTCAGCTCTGA-3′); JH003 and JH004 anneal to the pTRE promoter and Rgs16 cDNA, to distinguish the TgR16 from endogenous Rgs16.
To induce TgR16 expression, doxycycline (Dox; 100 μg/ml) was added to the drinking water and changed every 3 days. The expression of TgR16 was confirmed by quantitative RT-qPCR. The primers used for RT-qPCR were as follows: forward, 5′-GCCCAGCTGAGCCTTCAC-3′ (corresponding to the sequence of Rgs16); reverse, 5′-GTCCTCTTCAGAAATGAGCTTTTG-3′ (corresponding to the sequence of myc 3′ tag).
Mouse Liver mRNA
Adult mice were either fed ad libitum or fasted for the indicated time. Mice were sacrificed by cervical dislocation, and individual livers were dissected, frozen in liquid nitrogen immediately, and stored at −80 °C for future analysis. RNA extraction was performed using TRIzol according to the manufacturer's protocol.
Quantitative RT-PCR
mRNA expression levels were determined using real-time quantitative PCR. RNA extraction from liver (50 mg) was performed using TRIzol according to the manufacturer's protocol. RNA quality and quantity was assessed by relative absorbance at 260 nm versus 280 nm. Following DNase treatment, cDNA synthesis was performed on 2 μg of total RNA in a volume of 100 μl using Superscript II reverse transcriptase kit (Invitrogen) and stored at −20 °C until use. For gene expression analysis shown in Fig. 2E, equal amounts of RNA from mice of the same group were pooled for qPCR assay. qPCR primers were designed using the Primer Express Software (Applied Biosystems, Foster City, CA) from published mRNA sequences (primer sequences available upon request). Amplifications were performed on the ABI Prism 7000 sequence detection system using the following reaction conditions: 1 cycle at 50 °C for 2 min, 1 cycle at 95 °C for 10 min, 40 cycles at 95 °C for 15 s and 60 °C for 1 min. The data were analyzed using the comparative CT method (2−ΔΔCT) as described (16).
FIGURE 2.

RGS16 inhibits fatty acid oxidation in liver. A and B, decreased plasma β-hydroxybutyrate (A) and decreased fatty acid oxidation rate (B) in transgenic Rgs16 (TgR16) liver mitochondria compared with WT littermates. Mice were fed ad libitum a high fat diet for 2 weeks with Dox (0.1 mg/ml) (n = 6/group) and then fasted overnight and sacrificed at ZT7. C and D, increased plasma β-hydroxybutyrate (C) and increased fatty acid oxidation rate (D) in Rgs16 KO liver compared with WT littermates. TCA, tricarboxylic acids. Mice were fasted overnight and sacrificed at ZT7 (n = 6/group). A–D, 3 mice/group; TgR16 or Rgs16 KO compared with WT in each condition; *, p < 0.05; **, p < 0.01. E, gene expression ratio in transgenic Rgs16 (TgR16) and Rgs16 KO mice compared with their respective littermates. Shown is qPCR analysis of genes in pathways for fatty acid synthesis (FA Syn), glucose metabolism (Glu), and fatty acid oxidation (FA Ox) (3 mice/group, mRNA pooled prior to qPCR). Error bars, S.E.
In Situ Hybridization
Frozen sections of liver were cut at 8 μm in a cryostat and thaw-mounted onto SuperFrost Plus (Fisher) glass slides. Ten series of sections were cut such that each series had a representation every 140 μm (17). Sections were pretreated by fixation, acetic anhydride, and defatting steps. Slides with coverslips were incubated for 18 h at 60 °C in a humidified chamber with buffer containing denatured salmon sperm DNA (0.033 mg/ml), yeast tRNA (0.15 mg/ml), dithiothreitol (40 μm), and a cRNA at 1 × 10⁷ cpm/ml. Riboprobes were generated using an in vitro transcription kit (Ambion, Austin, TX) by using T3 or T7 RNA polymerase in the presence of [32P]UTP and purified using Micro Bio-Spin 6 columns (Bio-Rad). Sections were then treated with RNase A (20 mg/ml, 30 min at 45 °C) and washed in descending concentrations of sodium citrate buffer to a stringency of 0.1× SSC at 60 °C and air-dried. Tissue sections were exposed to Biomax MR film (Eastman Kodak Co.) followed by dipping in autoradiographic emulsion (NTB2, Eastman Kodak Co.), exposed for an appropriate duration, developed, fixed, and counterstained with cresyl violet acetate. A coverslip was applied with DPX mounting, and samples were visualized under bright and dark field microscopy (Olympus, Melville, NY). Adjacent sections from fresh-frozen livers were used as controls for the effects of perfusion on mRNA integrity as well as for sense probe controls.
Histological Procedures
Liver was fixed in formalin, embedded in paraffin wax, sectioned, and stained with hematoxylin and eosin by a standard procedure. Frozen sections were stained with Oil Red O using standard procedures.
Western Blot
Liver homogenate (50 μg) was resuspended in 1% SDS that contained a mixture of protease inhibitors (Sigma), including leupeptin (10 μg/ml), soybean trypsin inhibitor (10 μg/ml), MG132 (16 μg/ml), phenylmethylsulfonyl fluoride (16 μg/ml), tosyl lysine choromethyl ketone (16 μg/ml), and tosyl phenylalanine choromethyl ketone (16 μg/ml). The samples were sonicated and immediately boiled for 3 min. A Lowry protein assay was employed to quantitate the protein and ensure equal loading (about 30 μg/lane). The samples were separated by SDS-PAGE and transferred to nitrocellulose paper. Proteins were detected using RGS16 antiserum (a gift from Carol Beadling, Cornell University), and Enhanced Chemiluminescence (Amersham Biosciences) was utilized to detect the rabbit HA-tagged secondary antibody. The membrane was exposed to ML film (Kodak Biomax).
Plasma and Tissue Chemical Analysis
Mice were sacrificed by cervical dislocation. Blood was transferred to tubes containing EDTA (Microcuvette 500 K3E tubes; Sarstedt, Inc.), and the plasma was isolated by centrifugation at 4 °C. Plasma was analyzed for cholesterol (Roche Applied Science), triglyceride (Infinity triglyceride kit, Thermo Electron Corp., Australia), and glucose (Sigma, glucose oxidase method). Whole livers were removed and frozen in liquid nitrogen, stored at −80 °C. Sections of ∼0.1 g of liver were taken for lipid analysis; liver sections were homogenized in 4 ml of chloroform/methanol (2:1, v/v), and the lipids were extracted as described previously (18) and analyzed for triglycerides and cholesterol using the same kits as used for plasma analysis. To determine rates of fatty acid oxidation, liver was chilled in ice-water and then immediately assayed for CO2 and tricarboxylic acid accumulation.
Fatty Acid Oxidation
Liver (1 g) was homogenized in 12 ml of 0.15 m KCl, 5 mm Tris-HCl, pH 7.2, and centrifuged at 500 × g for 10 min at 4 °C. An aliquot of 0.25 ml was used for fatty acid oxidation assayed by measuring the rate of breakdown of [l4C]oleate as described (20, 21). Reactions were terminated by the addition of perchloric acid. Fatty acid oxidation was assessed by the rate of incorporation of l4C into CO2 and in acid-soluble products reported as tricarboxylic acids (TCA; Fig. 2).
Statistical Analysis
Data are expressed as means ± S.E. The statistical significance of differences between groups was calculated with a two-tailed Student's t test or one-way analysis of variance followed by Tukey's multiple comparison test on all pairs. p values of less than 0.05 were considered statistically significant.
Hepatic Slices (Organotypic Liver Culture)
Tissue slices of 400 mm thick were prepared with McIlwain chopper from a large lobe of mouse liver according to Ref. 19 and cultivated in a fluid-air interface in a 6-well plate onto semiporous membranes (culture plate insert Millicell-CM, Millipore). The culture media consisted of DMEM no glucose supplemented with 5% FCS dialyzed, 2 mm l-glutamine, antibiotic-antimycotic (Invitrogen, catalog no. 15240-096), 100 nm insulin, and 100 nm dexamethasone. Depending on the experiment, the glucose concentration in media was changed from 0 to 50 mm.
Primary Hepatocyte Culture
Primary hepatocytes were obtained from mouse liver by the collagenase method (22) with minor modification. Following liver perfusion with collagenase type II (50 mg/100 ml), dispersed cells were filtered through 70-mm nylon (BD Falcon) and washed several times by centrifugation at 70 × g for 3 min at 4 °C. The final hepatocyte pellet was resuspended in hepatocyte growth media (Media 199 supplemented with 5% FCS, 100 units/ml penicillin, 100 mg/ml streptomycin, 25 nm insulin, and 25 nm dexamethasone), counted, and plated on Primaria culture plates (Falcon) at a density of 65,000 cells/cm2. Cell viability usually exceeded 90%, as assessed using trypan blue exclusion. After attachment for 3–4 h, hepatocytes were washed once with PBS, and fresh growth media was added. Hepatocytes were cultured for 2–3 days.
Gluconeogenesis
Glucose production in primary hepatocytes was assayed as described (23). Hepatocytes were plated in 6-well plates in hepatocyte growth media (described above). The next day (or 24 h after infection/transfection), cells were washed once with PBS and once in basic glucose production media: DMEM no glucose (Sigma, catalog no. 5030) supplemented with sodium bicarbonate, 25 mm HEPES buffer, pH 7.4, 100 units/ml penicillin, 100 mg/ml streptomycin, and 50 nm dexamethasone. To each well was added 2 ml of glucose production media (1 h), which was then replaced with a fresh 1 ml of glucose production media and the indicated additions. Glycerol was the gluconeogenic substrate. The culture media was collected after 3–4 h of incubation, and glucose content was measured by a glucose oxidase method with the GAGO-20 glucose assay kit (Sigma) according to manufacturer's instructions.
Transcription Run-on Assay
Nuclei from mouse livers were isolated as described (24), stored at −80 °C, and used within 4 weeks. cDNA plasmids (5 μg) or empty vector controls were slot-blotted onto nylon GeneScreen membrane (NEF 983, PerkinElmer Life Sciences) according the manufacturer's protocol. The rate of transcription was measured in isolated nuclei by a nuclear “run-off” assay; the nuclear RNA elongation reaction, isolation of newly synthesized 32P-RNA, and hybridization to cDNA plasmids were performed as described (25). The amount of hybridizing 32P-RNA was quantitated by densitometric scanning (using a Fujifilm FLA-5100 image reader) of PhosphorImager screens exposed for 24 h. Data were normalized to transcription of the GAPDH gene.
Adenovirus Experiments
Adenoviruses containing ChREBP or GK1 were prepared as described (26, 27). Primary hepatocytes were plated, incubated overnight, and infected with adenoviruses (multiplicity of infection, 5–10 for Ad-ChREBP and 30–50 for Ad-GK1). After 5 h, fresh media was exchanged, and experiments with adenovirus-treated cells were started the following day.
RESULTS
Transgenic Rgs16 Mice Develop Fatty Liver
To characterize the signaling pathways and physiologic function of RGS16 in liver, we made transgenic mice that express RGS16 protein specifically in hepatocytes. The transgene was cloned from a recombinant expression vector used to make RGS16 protein that inhibited hormone-stimulated Gi and Gq signaling in primary pancreatic acini and submandibular cells (8). Because the N-terminal amphipathic helix of R4 class RGS proteins (such as RGS16) contributes to membrane localization, receptor-selective interactions, post-translational regulation of GAP activity, and protein stability (4, 8, 28–33), transgenic RGS16 protein was tagged at the C terminus with a triple repeat of the Myc epitope to distinguish it from endogenous RGS16 protein (Fig. 1A). To avoid potential complications from the deleterious effects of expressing RGS16 protein during liver development, we placed Rgs16-myc under the transcriptional control of tetracycline-responsive elements (TREs). Liver specificity was achieved by using the hepatocyte enhancer of the ApoE promoter to drive expression of the Tet-On transcription factor (15). The two transgenic constructs were co-injected into fertilized mouse oocytes. One transgenic line (TgR16) was obtained that co-integrated the two plasmids and co-transmitted them through the germ line. The addition of doxycycline in the drinking water (0.001–0.1 mg/ml) promotes Tet-On binding to the TREs and expression of the Rgs16-myc transgene in liver of transgenic mice (Fig. 1, B and E). Rgs16-myc transgene (TgR16) was expressed in all hepatocytes following induction, in both fed and fasted mice, but was undetectable in the absence of doxycycline (Fig. 1, B and C). Liver extracts containing TgR16 protein have enhanced GAP activity in the single turnover GTPase assay (Fig. 1D).
FIGURE 1.

Transgenic Rgs16 (TgR16) mice develop fatty liver. Transgenic Rgs16 mRNA and protein expression in liver is doxycycline-dependent. A, the transgenes ApoE::TA and TetON::Rgs16 were co-injected to obtain transgenic RGS16 tagged at the C terminus with a triple repeat of the Myc epitope (white box following mRgs16). The human ApoE promoter drives the Tet activator protein (TAS2s-M2) expression in liver. TAS2s-M2 binds TREs to induce expression of transgenic Rgs16-myc3 (TgR16) only in the presence of doxycycline. B and C, in situ hybridization. Transgenic Rgs16-myc mRNA is expressed throughout the liver of fed TgR16 transgenic mice (doxycyclin, 0.1 mg/ml) (B) but not in TgR16 liver (C), without Dox. D, RGS16 transgenic protein GAP activity was determined by single turnover GTPase assay in liver extracts from either transgenic Rgs16 (TgR16) or wild type mice. GTP-bound myristoylated recombinant Gαi1 was the substrate; recombinant RGS4 was assayed for comparison with liver extracts and background GTP hydrolysis on Gαi1 (no addition). E, Rgs16 transgene expression is doxycyclin-dependent and liver-specific. Doxycycline in the drinking water (0.001–0.1 mg/ml) induced expression of Rgs16-myc (TgR16) mRNA in liver but not in the other tissues indicated (assayed by qPCR). Inset, Western blot of liver protein in TgR16 and wild type littermates detected by RGS16 antiserum. F, fatty liver in transgenic Rgs16 (TgR16). Liver sections are sections of TgR16 and wild type male mice (high fat diet, 9.5 weeks with Dox (0.1 mg/ml)). Liver sections were stained with oil red O and H&E. G, Dox-dependent increase in hepatic triglyceride content in TgR16 mice (n = 6/group). H, increased hepatic triglyceride content in Gα11−/− mice independent of Dox (0.1 mg/ml). G and H, statistical analysis. A one-way analysis of variance test followed by Tukey's multiple comparison test was used. a versus b, p < 0.01. Mice were maintained on a high fat diet for 10 days, with or without Dox (0.1 mg/ml). Mice were fasted overnight before liver was collected at ZT8 (n = 4/group). Error bars, S.E.
A pronounced difference in liver fat content was noticed between transgenic and wild type littermates maintained on the high fat diet and then fasted overnight. Oil Red O staining confirmed the accumulation of fat deposits in liver of transgenic mice (Fig. 1F). Liver triglycerides were significantly increased in TgR16 transgenic mice compared with wild type littermates when maintained on any one of several different diets but most dramatically elevated after being fed a high fat diet for 7 weeks or 9.5 weeks prior to fasting (Fig. 1G and Table 1). Plasma triglycerides were also elevated in these transgenic mice compared with wild type littermates. Doxycycline-water (0.1 mg/ml) had no effect in wild type mice but was essential for induction of the TgR16 transgene in liver and elevated triglyceride levels (Fig. 1, G and H, and Table 1). Interestingly, plasma glucose levels were somewhat depressed, whereas plasma insulin was within the normal range (Table 1). In an independent test of whether doxycycline is causing fatty liver, we found that Gα11-null mice developed fatty liver on a high fat/high sucrose diet, with elevated levels of triglycerides in liver and plasma, independently of doxycycline (Fig. 1H). Thus, hepatic expression of the Gi/Gq-GAP RGS16 causes fatty liver in fasted transgenic mice.
TABLE 1.
Comparison of dietary effects in wild type (WT) and TgR16 (Tg) male littermates
Wild type and TgR16 males are compared for each measurement within each dietary condition. Boldface type indicates statistical significance. ND, not determined.
| Measurements | Chow (10 days) |
High fat (10 days) |
High fat (7 weeks) |
High fat (9 weeks) |
Sucrose (3 days) |
High protein (2 weeks) |
||||||
|---|---|---|---|---|---|---|---|---|---|---|---|---|
| WT, n = 4 | Tg, n = 4 | WT, n = 5 | Tg, n = 10 | WT, n = 6 | Tg, n = 6 | WT, n = 2 | Tg, n = 3 | WT, n = 5 | Tg, n = 7 | WT, n = 3 | Tg, n = 3 | |
| Body weight gain (g) | 0.9 ± 0.2 | 0.2 ± 0.2 | 5.5 ± 1.6 | 5.7 ± 0.4 | 19.1 ± 0.7 | 16.3 ± 1.8 | 21.7 | 18.0 ± 1.5 | 0.7 ± 0.2 | 0.5 ± 0.2 | 0.2 ± 0.01 | 0.2 ± 0.01 |
| Liver Triglyceride content (mg/g) | 38.8 ± 11.7 | 66.2 ± 9.7 | 62.6 ± 6.9a | 108.1 ± 9.3a | 68.7 ± 9.9a | 122.0 ± 18.1a | 93.2 | 304.6 ± 28.0 | 6.5 ± 1.2a | 16.8 ± 1.6a | 42.8 ± 6.9a | 118.7 ± 14.4a |
| Liver cholesterol content (mg/g) | 2.1 ± 0.1 | 2.0 ± 0.1 | 3.4 ± 0.3 | 3.4 ± 0.2 | 2.7 ± 0.2 | 2.6 ± 0.2 | 1.4 | 1.4 ± 0.2 | 2.2 ± 0.1 | 2.0 ± 0.1 | 2.4 ± 0.1 | 2.9 ± 0.2 |
| Plasma triglyceride (mg/dl) | 50.6 ± 8.9 | 63.3 ± 4.7 | 107.4 ± 7.1 | 118.7 ± 6.6 | 89.7 ± 5.7b | 137.7 ± 7.8b | 85.0 | 117.1 ± 6.6 | 52.6 ± 5.5 | 87.8 ± 14.2 | 70.8 ± 2.4a | 107.4 ± 7.4a |
| Plasma cholesterol (mg/dl) | 91.4 ± 13.0 | 52.9 ± 13.0 | 118.7 ± 0.3a | 48.0 ± 4.6a | 153.4 ± 11.8a | 56.4 ± 2.3a | 143.7 | 56.5 ± 9.8 | 66.3 ± 4.5a | 40.5 ± 4.2a | 56.2 ± 3.2a | 26.9 ± 1.2a |
| Plasma glucose (mg/dl) | 107.3 ± 15.2 | 87.4 ± 4.9 | 123.7 ± 13.9 | 120.1 ± 8.8 | 154.3 ± 12.6a | 97.7 ± 6.3a | 203.2 | 117.9 ± 10.5 | 157.7 ± 10.1 | 191.4 ± 13.6 | 85.6 ± 10.6 | 74.1 ± 16.1 |
| Plasma insulin (ng/ml) | 1.3 ± 0.6 | 0.8 ± 0.2 | ND | ND | 1.5 ± 0.4 | 3.1 ± 0.7 | ND | ND | ND | ND | 0.4 ± 0.01 | 0.7 ± 0.2 |
a p < 0.01.
b p < 0.05.
Elevated β-Ketones and Fatty Acid Oxidation in Rgs16 Knock-out (KO) Mice
A null allele of Rgs16 was made by deleting the RGS domain in exon 5 and confirmed by qPCR and Western blot assays.6 Interestingly, plasma β-hydroxybutyrate levels were lower in fasted transgenic Rgs16 (TgR16) mice compared with wild type controls (Fig. 2A), whereas they were elevated in Rgs16 KO mice (Fig. 2C). The rate of fatty acid oxidation in liver extracts was correspondingly low in TgR16 mice and high from Rgs16 KO mice (Fig. 2, B and D) compared with wild type controls, consistent with plasma levels of β-hydroxybutyrate in TgR16 and Rgs16 KO mice.
We characterized the expression of transcription factors and target genes that regulate fatty acid and glucose metabolism in TgR16 transgenic and Rgs16 KO mice (Fig. 2E). PPARα induces the expression of genes involved in fatty acid β-oxidation (34). Although PPARα expression is not altered, three of its target genes, Fgf21, FABP-1, and CPT-1 (26), were down-regulated in TgR16 mice, consistent with hepatic steatosis caused by reduced fatty acid oxidation. Interestingly, Fgf21 and endogenous Rgs16 mRNA expression were among the most suppressed genes we characterized in TgR16 mice (Fig. 2E). This is consistent with RGS16 transgenic protein inhibiting a GPCR pathway that both promotes fatty acid oxidation in liver of fasted mice and activates expression of its own feedback inhibitor, RGS16. By contrast, in the Rgs16 KO mice, the fasting genes FABP-1 and Fgf21 were elevated relative to their wild type controls. By contrast to the fatty oxidation genes, no consistent pattern of alteration was observed in the fatty acid synthesis and gluconeogenic genes.
Dietary Saccharides Induce Hepatic Rgs16
While testing different diets and supplements, we found that the most pronounced increase in Rgs16 mRNA and protein was in the liver of mice that had been provided 5% sucrose-water for 3 days and then denied chow 4 h into dark phase (Fig. 3, A (c), B, and C) (12). This treatment allows the most sustained intake of carbohydrate without down-regulation of Rgs16 expression in response to dietary amino acids (12). In situ hybridization showed that Rgs16 mRNA was restricted to periportal hepatocytes during fasting but induced in all hepatocytes when mice were provided sucrose-water (Fig. 3A, a versus c) (12). Rgs16 mRNA declined to basal levels after feeding in liver of wild type mice (Fig. 3A, b) (12).
FIGURE 3.

Dietary simple carbohydrates strongly induce Rgs16 mRNA and protein. A, in situ hybridization of Rgs16 mRNA in liver. a, fasted liver at ZT16; b, fed liver at ZT16; c, liver at ZT9, day 3 of restricted feeding (RF) with water ad libitum (Rgs16 is expressed throughout the liver, highest in periportal, declining toward pericentral hepatocytes); d, liver at ZT16, day 3 with 5% sucrose-water ad libitum (Rgs16 expression is uniformly distributed in the liver). Scale bar, 200 mm; 12 h light/dark. B and C, Rgs16 mRNA (B) and protein (C) are induced by dietary sucrose. Liver was collected at ZT16 from mice denied chow from ZT4 to ZT16 and provided either 5% sucrose-water, 0.45% saccharine, or water ad libitum and assayed for Rgs16 mRNA by qPCR and protein by Western blot (30 μg protein/lane). Recombinant, untagged RGS16 expressed in COS-7 cells served as a marker (rRgs16). Error bars, S.E.
Elevated Rgs16 mRNA and protein expression required at least 3 days of ad libitum access to 5% sucrose-water. Chow was removed on day 3, 4 h after lights on (at ZT4), and mice were sacrificed 4 h after lights off (at ZT16). The addition of sucrose or a sweetener (saccharine; 0.45%) to the drinking water during the ad libitum feeding period suppressed the daily intake of chow and increased liquid consumption. However, sucrose stimulated at least 4-fold higher levels of Rgs16 mRNA and protein expression in the liver of fasted mice than either water or 0.45% saccharine (Fig. 3, B and C). Therefore, sugar consumption, not reduced food or increased water intake, induced Rgs16 mRNA and protein expression.
Rgs16 Induction by Glucose Is ChREBP-dependent
Liver expresses two transcription factors, ChREBP and sterol response element-binding protein (SREBP-1c), that control the expression of genes essential for glycolysis and fatty acid synthesis in response to dietary carbohydrates (35–39). Because Rgs16 mRNA and protein expression is elevated when mice are provided 5% sucrose-water ad libitum (Fig. 3), we tested whether Rgs16 expression was affected in ChREBP and SREBP-1c KO mice. Interestingly, Rgs16 mRNA and protein expression are suppressed in ChREBP KO mice that were denied food but provided 5% glucose-water ad libitum from ZT4 to ZT16 (Fig. 4, A, E, and F). ChREBP KO mice were provided glucose because they do not tolerate sucrose or fructose (35). Many ChREBP target genes are independently regulated by SREBP-1c (36). However, Rgs16 mRNA expression was normal in SREPB-1c KO mice (Fig. 4B). We observed ChREBP-dependent glucose induction of both Rgs16 and the classical ChREBP target gene liver pyruvate kinase in liver slice culture (Fig. 4, C and D) as well as in rat and mouse primary hepatoctyes (see below) (27).
FIGURE 4.

ChREBP is required for Rgs16 mRNA and protein expression in mice on a high simple carbohydrate diet and during prolonged fasting. A, ChREBP−/− (KO) and WT mice (n = 3/group) were maintained on normal chow and 5% glucose-water for 3 days ad libitum before removing chow ZT4–ZT16. Liver was collected at ZT16 for qPCR analysis of Rgs16 mRNA expression. Statistical analysis was as follows: one-way analysis of variance test followed by Tukey's multiple comparison test. a versus c, p < 0.01; a versus d, p < 0.01; b versus d, p < 0.01; all other pairwise comparisons were not significantly different. B, SREBP-1c−/− (KO) mice and WT mice were treated as in A, except mice were provided 5% sucrose-water (n = 4/group). There was no statistically significant difference in Rgs16 mRNA expression between WT and SREBP KO mice, with or without sucrose-water. C and D, Rgs16 and liver pyruvate kinase mRNA expression in liver slices is induced by glucose in a dose- and ChREBP-dependent manner. Male mice (129SV/EvxC57BL/6) were provided normal chow and water ad libitum overnight, liver slices were collected at ZT4 and cultured 30 h in hepatocyte media at the indicated glucose concentrations (10 mm lactate was substituted for “0” glucose). Rgs16 mRNA (C) and liver pyruvate kinase mRNA (D) expression in liver slices from wild type and ChREBP−/− littermates. Shown is qPCR analysis of Rgs16 and liver pyruvate kinase expression normalized to the level in the liver of fed wild type mice harvested at ZT16. E (top), nuclear run-on transcription analysis; autoradiogram of 32P-labeled nascent transcript hybridized to the indicated cDNAs on nylon membranes. GAPDH served as a constitutively expressed internal control. Fed or fasted WT and ChREBP KO male mice were provided either water or 15% glucose-water ad libitum during restricted feeding. E (bottom), quantitation of Rgs16 transcription rate, normalized to GAPDH in each sample. Rgs16 mRNA steady-state levels were assayed by qPCR. Rgs16 transcription rate and mRNA levels in fasted mice are defined as 1.00. Shown is liver isolated at ZT5 day 3 restricted feeding (− Food) or refed normal chow (0.2 g) for 1 h (+ Food). RF, restricted feeding (n = 4/group). F, liver protein from ChREBP KO and WT mice in A (5% glucose) or WT mice in B (5% sucrose). Liver was collected at ZT16 for Western analysis of RGS16 protein expression (30 μg/lane). Error bars, S.E.
Transcription nuclear run-on assays showed that glucose-dependent induction of Rgs16 transcription is ChREBP-dependent. Rgs16 transcription was induced in the liver of wild type mice consuming 15% glucose water without access to chow. By contrast, Rgs16 transcription was not induced by glucose above the fasting level in ChREBP KO mice. Interestingly, the tandemly duplicated paralogs, Rgs16 and Rgs8 (40), were similarly regulated (Fig. 4E). Rgs16 and Rgs8 could be direct targets of ChREBP transcriptional regulation. However, an important feature of Rgs16 transcription and mRNA and protein expression is that, unlike other ChREBP target genes, Rgs16 is down-regulated by feeding, including high carbohydrate chow (Figs. 3A (b) and 4E). This suggests Rgs16 does not promote glycolysis or fatty acid synthesis, as do classical ChREBP target genes, but instead regulates fatty acid oxidation and/or gluconeogenesis when complex dietary nutrients are lacking.
Rgs16 mRNA expression in wild type mouse primary hepatocytes was glucose-responsive only after cells were infected with adenovirus expressing glucokinase-1 (AdV::GK; Fig. 5A), whereas GK overexpression was not required in mouse liver slice culture (Fig. 4C) or rat hepatocytes (27) (data not shown). By contrast, cells from ChREBP KO mice expressed Rgs16 in high glucose only after hepatocytes were co-infected with adenovirus expressing both GK and ChREBP (AdV::ChR; Fig. 5B). Interestingly, wild type mouse primary hepatocytes incubated with glycerol (10 mm) under gluconeogenic conditions expressed Rgs16 independent of GK (Fig. 5E), whereas hepatocytes from ChREBP KO mice only expressed Rgs16 if infected with AdV::ChR (Fig. 5F).
FIGURE 5.

Rgs16 mRNA expression is induced by ChREBP in a glucose-dependent manner. A and B, ChREBP, GK, and glucose are required for Rgs16 mRNA expression in ChREBP KO primary hepatocytes. C–F, Rgs16 mRNA induction by glycerol is ChREBP-dependent but GK-independent. 8-Bromo-cyclic AMP stimulates glucose production but inhibits Rgs16 mRNA expression in wild type and ChREBP KO primary hepatocytes. G–J, glucagon stimulates glucose production but inhibits Rgs16 mRNA expression in wild type primary hepatocytes. Error bars, S.E.
Glucagon is the classical Gs-coupled fasting hormone that stimulates cAMP synthesis and hepatic glucose production. Importantly, either glucagon or 8-bromo-cyclic AMP stimulated glucose production (Figs. 5, C, D, G, and H) but inhibited Rgs16 mRNA expression (Fig. 5, E, F, I, and J) in both wild type and ChREBP KO primary hepatocytes. Thus, RGS16 probably regulates Gi- or Gq-coupled receptors, not Gs-coupled glucagon receptors, in liver of fasting mice.
DISCUSSION
Combined analysis of gain-of-function and loss-of-function mutants indicates that RGS16 inhibits Gi/Gq-mediated fatty acid oxidation in hepatocytes. Consistent with this interpretation, Rgs16 is not expressed in liver during early fasting, when glucagon evokes Gs-coupled stimulation of adenylyl cyclase, cAMP production, activation of the transcription factor CRTC2, and glucose production from glycogen and gluconeogenic amino acids (12) (see Fig. 7). Furthermore, glucagon inhibits Rgs16 expression in primary hepatocytes treated with either glucagon or cAMP for up to 4 h (Fig. 5). Fatty acid oxidation and β-ketone production elevate in the later half of the light phase, when Rgs16 is expressed in periportal hepatocytes, the cell type in liver that preferentially supports gluconeogenesis and fatty acid oxidation (Fig. 3). Liver-specific expression of an Rgs16 transgene causes hepatosteatosis, lower blood glucose and β-ketone levels, and reduced fatty acid oxidation in liver extracts from mice fasted overnight and reduced expression of genes that promote fatty acid oxidation (Figs. 1 and 2 and Table 1). By contrast, Rgs16 KO mice show reciprocal responses (Fig. 2).
FIGURE 7.
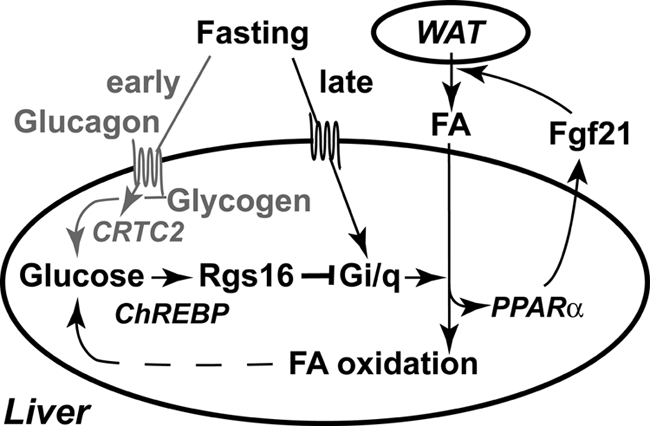
RGS16 inhibits hepatic fatty acid oxidation in a ChREBP-dependent manner. During the early fasting phase (ZT0–ZT6; gray font and arrows), glucagon stimulates hepatic glucose production from glycogen (48). The Gs-coupled glucagon receptor stimulates cAMP production, which activates the transcription factor CRTC2 (46) but inhibits Rgs16 mRNA accumulation (Fig. 5). We propose that a novel Gi/Gq-coupled receptor promotes fatty acid oxidation during the late fasting phase (after ZT6) (12). Fatty acid (FA) metabolites may serve as ligands of PPARα, which stimulates Fgf21 expression (26, 45). FGF21 promotes fatty acid lipolysis and release from white adipose tissue (WAT) (26, 49). Fatty acid oxidation in liver produces ATP and NADH necessary to drive hepatic gluconeogenesis during prolonged fasting. Glucose metabolites, such as xylulose 5-phosphate (37, 50), presumably activate ChREBP-dependent Rgs16 transcription and mRNA accumulation during the late fasting phase (Figs. 3 and 4). RGS16 inhibits Gi/Gq-mediated fatty acid oxidation (Figs. 1 and 2), thus modulating fatty acid utilization during periods of energy deprivation.
Rgs16 and its tandemly duplicated paralog, Rgs8 (40), may be general regulators of glucose homeostasis because these genes are expressed not only in liver during fasting but also in islet beta cells during postnatal and embryonic development and even in pancreatic progenitor cells at the initiation of pancreas development (41). Importantly, expression in adult pancreas is suppressed until periods of high insulin demand, as in mouse models of type 1 and type 2 diabetes, and during midgestation in pregnant females. Rgs16 is more abundantly expressed in the liver and pancreas than Rgs8 (41).6 The Rgs8-null mutant has no reported abnormalities (42). Co-expression of Rgs16 and Rgs8 in pancreas and liver presumably allows at least partial compensation of each single gene deletion mutant, necessitating double knock-out mice for a complete analysis of Rgs16 and Rgs8 regulation of GPCR signaling and energy homeostasis.
In the liver of fasted mice, ChREBP was unexpectedly required for maximal induction of Rgs16 and Rgs8 (Fig. 4). Consistent with this observation, Rgs16 mRNA induction in primary hepatocytes that were provided glycerol for gluconeogenesis is ChREBP-dependent (Fig. 3). ChREBP was first discovered as the glucose-responsive transcription factor required for fatty acid synthesis in the fed state (43). The insulin-responsive transcription factor SREBP-1c also stimulates fatty acid synthesis (38, 39) but, like insulin, has no effect on Rgs16 gene expression in liver or hepatocytes (Fig. 4). Recently, ChREBP was shown to induce expression of Fgf21 (44), a hormone that promotes the release of fatty acids from WAT during fasting (26, 45). Interestingly, metabolites of fatty acid oxidation are likely to be endogenous ligands of PPARα, the nuclear receptor transcription factor first shown to induce Fgf21 expression (26, 45). RGS16 inhibits Fgf21 expression about 3-fold in Rgs16 transgenic mice, whereas Fgf21 expression is elevated in Rgs16 KO mice (Fig. 2E). Fgf21 transgenic mice hyperstimulate the fasted state, and as predicted, Rgs16 mRNA and protein was elevated in the liver of fed and fasted mice (Fig. 6). We propose a novel function for ChREBP in managing the utilization of fatty acids during prolonged fasting, by inducing expression of FGF21 to promote fat mobilization from WAT stores and RGS16 to couple gluconeogenesis to the modulation of fatty acid oxidation in hepatocytes (Fig. 7).
FIGURE 6.

Liver-specific expression of FGF21 induces hepatic Rgs16. A, Western blot of RGS16 protein in liver from wild type and transgenic Fgf21 (TgF21) (26) littermates (30 μg/lane; RGS16 antiserum provided by C. Beadling). B, Rgs16, CPT-1, and PEPCK mRNA steady-state levels assayed by qPCR. Shown are relative levels of mRNA in the liver of fed and fasted TgF21 and fed wild type compared with fasted wild type levels for each gene. C, transcription rates of Rgs16 and GAPDH in liver from fed and fasted wild type and Fgf21 transgenic mice. Liver was collected at ZT16 for each assay.
Liver metabolism adapts during fasting to changes in substrate availability and energy demands of the body. A fasting-inducible switch, sometime around 6 h into the light phase (ZT6), modulates the metabolic transition for hepatic glucose production from glycogen to fatty acid oxidation (46). This metabolic transition is coincident with the induction of Rgs16 and other members of the RevErbα cluster of circadian regulated genes in liver (47). Like other circadian regulated genes in liver, Rgs16 gene expression is sensitive to the nutrition status of the animal, feeding schedule, and dietary components (Figs. 1 and 3) (12). RGS proteins are essential regulators of G protein signaling, and in fungi, Rgs gene expression can be induced by activation of the GPCR pathway they regulate. Interestingly, endogenous Rgs16 was among the most suppressed genes we characterized in TgR16 mice (Fig. 2). This is consistent with RGS16 transgenic protein inhibiting a GPCR pathway that both promotes fatty acid oxidation in the liver of fasted mice and activates the expression of its own feedback inhibitor. Rgs16 appears to be a sensitive reporter gene in liver to help identify novel hormones and understand complex interactions between metabolic signals functioning to regulate glucose and fatty acid metabolism. RGS16 could modulate transitions between the fasted and fed states and regulate GPCR control of circadian rhythm in liver.
The hormone(s) and GPCR(s) that stimulate RGS16-regulated fatty acid oxidation in hepatocytes remain to be identified. Presumably, these pathways are Gi- or Gq-coupled, because RGS16 is a Gi/Gq-GAP. Glucagon and the glucagon receptor have been implicated in fatty acid oxidation after a 24-h fast. Although glucagon can evoke Ca2+ signaling, a second messenger of Gi and Gq pathways, it is not known if these effects in late fasting are Gi- or Gq-coupled. The transcription factor PPARα is required for the expression of fatty acid oxidation genes during prolonged fasting and is activated by glucagon in a p38 MAPK- and AMPK-dependent manner (48). Although the onset of Rgs16 expression is delayed a few h in the liver of PPARα KO mice, it is not required for Rgs16 expression during a prolonged fast (data not shown). By contrast, ChREBP KO mice revealed a dramatic diminution of Rgs16 transcription after prolonged fasting (Fig. 4). Rgs16 is likely to be a target of one or more transcription factors traditionally associated with fasting, in addition to ChREBP (or a ChREBP-dependent factor) during a prolonged fast.
Acknowledgments
We thank Drs. Robert Hammer and Jay Horton for providing the ApoE and TRE transgenic expression vectors, Carol Beadling for RGS16 antiserum, Susanne Mumby and Steve Gold for advice on protein preparation from tissues for Western blots, Jay Horton and Amy Cox for insulin determinations, Guosheng Liang for SREBP-1c KO mice, Steve Kliewer for Fgf21 transgenic mice, Chris Newgard for glucokinase adenovirus, Li Jiang for 8-bromo-cyclic AMP, and the University of Texas Southwestern Transgenic Core Facility for producing founder Rgs16 knock-out mice.
This work was supported, in whole or in part, by National Institutes of Health Grants GM61395 and PAR-98-057 (to T. M. W.) and HL072551 (to D. K. O.). This work was also supported by Welch Foundation Grant I-1382 (to T. M. W.).
J. Huang and T. M. Wilkie, unpublished results.
- GPCR
- G protein-coupled receptor
- RGS
- regulator(s) of G protein signaling
- GAP
- GTPase-activating protein
- Dox
- doxycycline
- qPCR
- quantitative PCR
- TRE
- tetracycline-responsive element
- ZT
- Zeitgeber time.
REFERENCES
- 1. Gilman A. G. (1987) Annu. Rev. Biochem. 56, 615–649 [DOI] [PubMed] [Google Scholar]
- 2. Berman D. M., Wilkie T. M., Gilman A. G. (1996) Cell 86, 445–452 [DOI] [PubMed] [Google Scholar]
- 3. Ross E. M., Wilkie T. M. (2000) Annu. Rev. Biochem. 69, 795–827 [DOI] [PubMed] [Google Scholar]
- 4. Zeng W., Xu X., Popov S., Mukhopadhyay S., Chidiac P., Swistok J., Danho W., Yagaloff K. A., Fisher S. L., Ross E. M., Muallem S., Wilkie T. M. (1998) J. Biol. Chem. 273, 34687–34690 [DOI] [PubMed] [Google Scholar]
- 5. Luo X., Popov S., Bera A. K., Wilkie T. M., Muallem S. (2001) Mol. Cell 7, 651–660 [DOI] [PubMed] [Google Scholar]
- 6. Muallem S., Wilkie T. M. (1999) Cell Calcium 26, 173–180 [DOI] [PubMed] [Google Scholar]
- 7. Xu X., Croy J. T., Zeng W., Zhao L., Davignon I., Popov S., Yu K., Jiang H., Offermanns S., Muallem S., Wilkie T. M. (1998) J. Biol. Chem. 273, 27275–27279 [DOI] [PubMed] [Google Scholar]
- 8. Xu X., Zeng W., Popov S., Berman D. M., Davignon I., Yu K., Yowe D., Offermanns S., Muallem S., Wilkie T. M. (1999) J. Biol. Chem. 274, 3549–3556 [DOI] [PubMed] [Google Scholar]
- 9. Dietzel C., Kurjan J. (1987) Mol. Cell. Biol. 7, 4169–4177 [DOI] [PMC free article] [PubMed] [Google Scholar]
- 10. Dohlman H. G., Song J., Ma D., Courchesne W. E., Thorner J. (1996) Mol. Cell. Biol. 16, 5194–5209 [DOI] [PMC free article] [PubMed] [Google Scholar]
- 11. Hsueh Y. P., Xue C., Heitman J. (2007) Mol. Biol. Cell 18, 3237–3249 [DOI] [PMC free article] [PubMed] [Google Scholar]
- 12. Huang J., Pashkov V., Kurrasch D. M., Yu K., Gold S. J., Wilkie T. M. (2006) Comp. Hepatol. 5, 8–18 [DOI] [PMC free article] [PubMed] [Google Scholar]
- 13. Jungermann K., Katz N. (1989) Physiol. Rev. 69, 708–764 [DOI] [PubMed] [Google Scholar]
- 14. Lamartina S., Roscilli G., Rinaudo C. D., Sporeno E., Silvi L., Hillen W., Bujard H., Cortese R., Ciliberto G., Toniatti C. (2002) Hum. Gene Ther. 13, 199–210 [DOI] [PubMed] [Google Scholar]
- 15. Dong J., Feldmann G., Huang J., Wu S., Zhang N., Comerford S. A., Gayyed M. F., Anders R. A., Maitra A., Pan D. (2007) Cell 130, 1120–1133 [DOI] [PMC free article] [PubMed] [Google Scholar]
- 16. Kurrasch D. M., Huang J., Wilkie T. M., Repa J. J. (2004) Methods Enzymol. 389, 3–15 [DOI] [PubMed] [Google Scholar]
- 17. Tonnaer J. A., Lammers A. J., Wieringa J. H., Steinbusch H. W. (1986) Brain Res. 370, 200–203 [DOI] [PubMed] [Google Scholar]
- 18. Kalaany N. Y., Gauthier K. C., Zavacki A. M., Mammen P. P., Kitazume T., Peterson J. A., Horton J. D., Garry D. J., Bianco A. C., Mangelsdorf D. J. (2005) Cell Metab. 1, 231–244 [DOI] [PubMed] [Google Scholar]
- 19. Verrill C., Davies J., Millward-Sadler H., Sundstrom L., Sheron N. (2002) J. Pharmacol. Toxicol. Methods 48, 103–110 [DOI] [PubMed] [Google Scholar]
- 20. Long C. S., Haller R. G., Foster D. W., McGarry J. D. (1982) Neurology 32, 663–666 [DOI] [PubMed] [Google Scholar]
- 21. McGarry J. D., Mannaerts G. P., Foster D. W. (1978) Biochim. Biophys. Acta 530, 305–313 [DOI] [PubMed] [Google Scholar]
- 22. Horton J. D., Shimano H., Hamilton R. L., Brown M. S., Goldstein J. L. (1999) J. Clin. Invest. 103, 1067–1076 [DOI] [PMC free article] [PubMed] [Google Scholar]
- 23. Yoon J. C., Puigserver P., Chen G., Donovan J., Wu Z., Rhee J., Adelmant G., Stafford J., Kahn C. R., Granner D. K., Newgard C. B., Spiegelman B. M. (2001) Nature 413, 131–138 [DOI] [PubMed] [Google Scholar]
- 24. Hattori M., Tugores A., Veloz L., Karin M., Brenner D. A. (1990) DNA Cell Biol. 9, 777–781 [DOI] [PubMed] [Google Scholar]
- 25. Srivastava R. A., Schonfeld G. (2000) in The Nucleic Acid Protocols Handbook (Rapley R. ed) pp. 207–212, Humana Press Inc., Totowa, NJ [Google Scholar]
- 26. Inagaki T., Dutchak P., Zhao G., Ding X., Gautron L., Parameswara V., Li Y., Goetz R., Mohammadi M., Esser V., Elmquist J. K., Gerard R. D., Burgess S. C., Hammer R. E., Mangelsdorf D. J., Kliewer S. A. (2007) Cell Metab. 5, 415–425 [DOI] [PubMed] [Google Scholar]
- 27. Ma L., Robinson L. N., Towle H. C. (2006) J. Biol. Chem. 281, 28721–28730 [DOI] [PubMed] [Google Scholar]
- 28. Bernstein L. S., Grillo A. A., Loranger S. S., Linder M. E. (2000) J. Biol. Chem. 275, 18520–18526 [DOI] [PubMed] [Google Scholar]
- 29. Bernstein L. S., Ramineni S., Hague C., Cladman W., Chidiac P., Levey A. I., Hepler J. R. (2004) J. Biol. Chem. 279, 21248–21256 [DOI] [PubMed] [Google Scholar]
- 30. Heximer S. P., Lim H., Bernard J. L., Blumer K. J. (2001) J. Biol. Chem. 276, 14195–14203 [DOI] [PubMed] [Google Scholar]
- 31. Ou-Yang Y. S., Tu Y., Yang F. (2003) Biosci. Rep. 23, 213–224 [DOI] [PubMed] [Google Scholar]
- 32. Saitoh O., Murata Y., Odagiri M., Itoh M., Itoh H., Misaka T., Kubo Y. (2002) Proc. Natl. Acad. Sci. U.S.A. 99, 10138–10143 [DOI] [PMC free article] [PubMed] [Google Scholar]
- 33. Srinivasa S. P., Bernstein L. S., Blumer K. J., Linder M. E. (1998) Proc. Natl. Acad. Sci. U.S.A. 95, 5584–5589 [DOI] [PMC free article] [PubMed] [Google Scholar]
- 34. Lee S. S., Pineau T., Drago J., Lee E. J., Owens J. W., Kroetz D. L., Fernandez-Salguero P. M., Westphal H., Gonzalez F. J. (1995) Mol. Cell. Biol. 15, 3012–3022 [DOI] [PMC free article] [PubMed] [Google Scholar]
- 35. Iizuka K., Bruick R. K., Liang G., Horton J. D., Uyeda K. (2004) Proc. Natl. Acad. Sci. U.S.A. 101, 7281–7286 [DOI] [PMC free article] [PubMed] [Google Scholar]
- 36. Towle H. C. (2001) Proc. Natl. Acad. Sci. U.S.A. 98, 13476–13478 [DOI] [PMC free article] [PubMed] [Google Scholar]
- 37. Veech R. L. (2003) Proc. Natl. Acad. Sci. U.S.A. 100, 5578–5580 [DOI] [PMC free article] [PubMed] [Google Scholar]
- 38. Brown M. S., Goldstein J. L. (1998) Nutr. Rev. 56, S1–S3; discussion S54–S75 [DOI] [PubMed] [Google Scholar]
- 39. Tontonoz P., Kim J. B., Graves R. A., Spiegelman B. M. (1993) Mol. Cell. Biol. 13, 4753–4759 [DOI] [PMC free article] [PubMed] [Google Scholar]
- 40. Sierra D. A., Gilbert D. J., Householder D., Grishin N. V., Yu K., Ukidwe P., Barker S. A., He W., Wensel T. G., Otero G., Brown G., Copeland N. G., Jenkins N. A., Wilkie T. M. (2002) Genomics 79, 177–185 [DOI] [PubMed] [Google Scholar]
- 41. Villasenor A., Wang Z. V., Rivera L. B., Ocal O., Asterholm I. W., Scherer P. E., Brekken R. A., Cleaver O., Wilkie T. M. (2010) Dis. Model. Mech. 3, 567–580 [DOI] [PMC free article] [PubMed] [Google Scholar]
- 42. Kuwata H., Nakao K., Harada T., Matsuda I., Aiba A. (2007) Kobe J. Med. Sci. 53, 275–281 [PubMed] [Google Scholar]
- 43. Yamashita H., Takenoshita M., Sakurai M., Bruick R. K., Henzel W. J., Shillinglaw W., Arnot D., Uyeda K. (2001) Proc. Natl. Acad. Sci. U.S.A. 98, 9116–9121 [DOI] [PMC free article] [PubMed] [Google Scholar]
- 44. Iizuka K., Takeda J., Horikawa Y. (2009) FEBS Lett. 583, 2882–2886 [DOI] [PubMed] [Google Scholar]
- 45. Badman M. K., Pissios P., Kennedy A. R., Koukos G., Flier J. S., Maratos-Flier E. (2007) Cell Metab. 5, 426–437 [DOI] [PubMed] [Google Scholar]
- 46. Liu Y., Dentin R., Chen D., Hedrick S., Ravnskjaer K., Schenk S., Milne J., Meyers D. J., Cole P., Yates J., 3rd, Olefsky J., Guarente L., Montminy M. (2008) Nature 456, 269–273 [DOI] [PMC free article] [PubMed] [Google Scholar]
- 47. Panda S., Antoch M. P., Miller B. H., Su A. I., Schook A. B., Straume M., Schultz P. G., Kay S. A., Takahashi J. S., Hogenesch J. B. (2002) Cell 109, 307–320 [DOI] [PubMed] [Google Scholar]
- 48. Longuet C., Sinclair E. M., Maida A., Baggio L. L., Maziarz M., Charron M. J., Drucker D. J. (2008) Cell Metab. 8, 359–371 [DOI] [PMC free article] [PubMed] [Google Scholar]
- 49. Hotta Y., Nakamura H., Konishi M., Murata Y., Takagi H., Matsumura S., Inoue K., Fushiki T., Itoh N. (2009) Endocrinology 150, 4625–4633 [DOI] [PubMed] [Google Scholar]
- 50. Kabashima T., Kawaguchi T., Wadzinski B. E., Uyeda K. (2003) Proc. Natl. Acad. Sci. U.S.A. 100, 5107–5112 [DOI] [PMC free article] [PubMed] [Google Scholar]