

Abstract
Background
While genetic influences on Alcohol Dependence (AD) are substantial, progress in the identification of individual genetic variants that impact on risk has been difficult.
Methods
We performed a genome-wide association study on 3,169 alcohol consuming subjects from the population-based Molecular Genetics of Schizophrenia (MGS2) control sample. Subjects were asked 7 questions about symptoms of AD which were analyzed by confirmatory factor analysis. Genotyping was performed using the Affymetrix 6.0 array. Three sets of analyses were conducted separately for European American (EA, n=2,357) and African-American (AA, n=812) subjects: individual SNPs, candidate genes and enriched pathways using Gene Ontology (GO) categories.
Results
The symptoms of AD formed a highly coherent single factor. No SNP approached genome-wide significance. In the EA sample, the most significant intragenic SNP was in KCNMA1, the human homolog of the slo-1 gene in C. Elegans. Genes with clusters of significant SNPs included AKAP9, PIGG and KCNMA1. In the AA sample, the most significant intragenic SNP was CEACAM6 and genes showing empirically significant SNPs included KCNQ5, SLC35B4 and MGLL. In the candidate gene based analyses, the most significant findings were with ADH1C, NFKB1 and ANKK1 in the EA sample, and ADH5, POMC, and CHRM2 in the AA sample. The ALIGATOR program identified a significant excess of associated SNPs within and near genes in a substantial number of GO categories over a range of statistical stringencies in both the EA and AA sample.
Conclusions
While we cannot be highly confident about any single result from these analyses, a number of findings were suggestive and worthy of follow-up. Although quite large samples will be needed to obtain requisite power, the study of AD symptoms in general population samples is a viable complement to case-control studies in identifying genetic risk variants for AD.
Keywords: alcohol dependence, genome-wide association study, gene ontology, control
Twin and adoption studies have provided consistent and indeed compelling evidence for the operation of genetic factors in the etiology of alcohol dependence (AD) (e.g. Cloninger, Bohman, and Sigvardsson 1981; Goodwin et al. 1973; Heath et al. 1997; Kendler et al. 1992; Kendler et al. 1997; Prescott and Kendler 1999). Linkage and candidate gene association studies have suggested a range of chromosomal regions and candidate genes that impact on risk for AD (Gelernter and Kranzler 2009; Kalsi et al. 2009; Stacey, Clarke, and Schumann 2009). Genome wide association studies (GWAS) have proven to be a successful method for the identification of risk genes for a range of complex human disorders and traits (Cichon et al. 2009; Frazer et al. 2009; Sebastiani et al. 2009). We are aware of five published GWAS for AD, examining i) pooled DNA from 120 affected and 160 control subjects from the Collaborative Study of the Genetics of Alcoholism (COGA) (Johnson et al. 2006), ii) 487 male German subjects with AD and 1,358 population controls (Treutlein et al. 2009), iii) 1,192 cases and 692 controls from the COGA sample (Edenberg et al. 2010), iv) 1,897 AD-cases and 1,932 controls from the Study of Addiction: Genetics and Environment (SAGE) sample (Bierut et al. 2010) and v) pooled DNA study of a population based sample of 1224 cases and 1162 control subjects (Lind et al. 2010).
In this report we utilize an alternative GWAS strategy – examining a quantitative measure of symptoms of AD in a general population sample from the United States consisting of 2,357 European-American (EA) and 812 African-American (AA) subjects. This approach is justified on two grounds. First, evidence from twin studies has shown that quantitative measures of drinking and drinking related problems index closely the risk for AD (Grant et al. 2009; Kendler et al. 2010; Whitfield et al. 2004). Second, power analyses demonstrate that quantitative measures can provide greater power for genetic analysis than dichotomous classifications into cases and controls (Neale, Eaves, and Kendler 1994). The potential advantages of using quantitative measures is well illustrated by findings from the Irish Affected Sib Pair Study of Alcohol Dependence (IASPSAD) where the linkage signal on chromosome 4p was much greater when using a quantitative measure of AD than with the more traditional dichotomous diagnosis (Prescott et al. 2006). To utilize more completely the potential of this data set, we examine our results in three ways: i) by individual genetic variants, ii) through a set of a priori candidate genes and iii) by genes sorted into their gene ontology (GO) classification.
Methods
Sample
Ascertainment, consent, assessment, phlebotomy, diagnosis, ancestry, sample and genotypic quality control (QC), and sharing of biomaterials and data for the MGS2 control collection have been previously described in detail (Sanders et al. 2008; Sanders et al. 2010; Shi et al. 2009). Briefly, Knowledge Networks, Inc., a survey research company (KN), recruited self-identified non-Hispanic adult control subjects, 3,364 EA and 1,301 AA, from their nationwide panel of survey participants, which had been assembled by random digit dialing (772 of the AA controls were recruited through a subcontract to SSI, Survey Sampling International by internet banner ads). Institutional review board approval was obtained at NorthShore University HealthSystem. The order of procedures for control subjects was recruitment, online consent (identical hard-copy consent signed at venipuncture), online questionnaire completion, venipuncture for DNA extraction and establishment of lymphoblastoid cell lines (LCLs) at Rutgers University Cell and DNA Repository (RUCDR), and full anonymization of data and biomaterials. The questionnaire (available at nimhgenetics.org) was primarily comprised of the Composite International Diagnostic Interview – Short Form (CIDI-SF) (Kessler et al. 1998b; Kessler et al. 1998a; Wittchen 1994), modified to screen for lifetime diagnoses (AD, drug dependence, major depressive episode/s, generalized anxiety disorder, specific phobia, social phobia, agoraphobia, panic attacks, and obsessive compulsive disorder). The questionnaire also included other components assessing various traits and disorders: Fagerström Test for Nicotine Dependence (FTND) (Heatherton et al. 1991); Eysenck brief neuroticism and extraversion scales (Eysenck, Eysenck, and Barrett 1985); sexual identity; height and body mass index (BMI); psychosis and mania screens; ancestry (race/ethnicity) (Nurnberger, Jr. et al. 1994) for each grandparent; and basic demographics. We scored the dichotomous presence/absence of individual disorders according to the CIDI-SF (Kessler et al. 1998a) scoring memo (Nelson, Kessler, and Mroczek 2001). For the Molecular Genetics of Schizophrenia (MGS2) genome wide association study (GWAS) of schizophrenia (Shi et al. 2009), we genotyped 3,827 (2,817 EA and 1,010 AA) control samples with the Affymetrix 6.0 array, selected for eligibility based on previous laboratory study of genotypic ancestral background and DNA quality. Of these, over 95% (3,667) of the control samples passed stringent sample and genotypic QC and were suitable for our analysis, on the basis of having both phenotypic and genotypic data. Genotypes and phenotypic data for these controls are available by application to dbGaP (Database of Genotypes and Phenotypes, dbgap.ncbi.nlm.nih.gov, Study Accessions: phs000021.v2.p1 and phs000167.v1.p1), and DNA, LCLs, and additional phenotypic data are available through the NIMH repository (nimhgenetics.org).
Phenotype Definition
Symptoms of AD were assessed by the CIDI-SF with a section that began by asking respondents the largest number of drinks they ever consumed in 24 hours. Those who responded “never drank” (n=498) were considered lifetime abstainers and excluded from subsequent analyses. Subjects who reported consuming 4 or more drinks in a day were then asked 7 questions which assessed craving for alcohol, DSM-IV criterion A2 for alcohol abuse (dangerous use) and criteria 1 (tolerance), 3 (loss of control), 5 (“great deal of time…”), 6 (activities given up), and 7 (use despite knowledge of harm) for AD. All items were binary except those assessing loss of control and activities given up which had 5 possible responses. The interview skipped these questions for individuals who responded that the most they ever consumed in a day was 1 to 3 drinks (n=1,030). We assumed that these individuals were “light social drinkers” and included them in our analysis with a score of zero for the number of alcohol-related symptoms. We derived factor scores on the total number of individuals with both phenotypic and genotypic data, (3,169 individuals: 2,357 EA and 812 AA).
Genotyping Methods
As previously described in more detail (Shi et al. 2009), DNA samples were genotyped using the Affymetrix 6.0 array at the Broad Institute. Samples (5.3%) were excluded for high missing data rates, outlier proportions of heterozygous genotypes, incorrect sex or genotypic relatedness to other subjects. SNPs (7% for AA, 25% for EA and 27% for combined analyses) were excluded for minor allele frequencies < 1%, high missing data rates, Hardy–Weinberg deviation (controls), excessive Mendelian errors (trios), discordant genotypes (duplicate samples) or large allele frequency differences among DNA plates. Principal component scores reflecting continental and within-Europe ancestries of each subject were computed and outliers were excluded. Genomic control λ values for autosomes after quality control procedures were 1.005 and 0.998 for the AA and EA samples, respectively.
Statistical Methods
Factor Analysis
Exploratory and confirmatory factor analysis was carried out in Mplus (Muthen and Muthen 2007). We utilized three fit-indices which reflect the model's balance of explanatory power and parsimony: the Tucker-Lewis Index (TLI) (Tucker and Lewis 1973), the Comparative Fit Index (CFI) (Bentler 1990), and the root mean square error of approximation (RMSEA) (Steiger 1990). For the TLI and CFI, values between 0.90 and 0.95 are considered acceptable and ≥ 0.95 as good. For the RMSEA, good and acceptable models typically have values ≤ 0.05 and 0.10, respectively. The primary association analysis was a linear regression of the alcohol factor score on the number of minor alleles at each SNP (thus, a 1df additive model). Principal components corresponding to population (Shi et al, 2009) were included as covariates in the analysis, to minimize bias due to population stratification. Age and sex were also included as covariates. The effect of possible non-normality of the trait value on the Type I error rate of the linear regression analysis was tested by generating 10,000,000 random sets of genotypes for each of 3 minor allele frequencies 0.1, 0.25, 0.5. Regression of the trait on these genotype sets was performed, and Type I error rate estimated as the proportion of sets where the regression reached significance. No inflation of observed Type I error rate compared to nominal values was observed for any of the significance levels tested (ranging from 0.05 to 10-6). Thus, it was not considered necessary to perform a transformation on the factor scores.
Set-based Gene-wise Permutations of Top Genes and Select Candidate Genes
The set-based method in PLINK (pngu.mgh.harvard.edu/purcell/plink/) (Purcell et al. 2007) has the advantage of performing association as well as permutation tests. For each set, the program selects independent SNPs according to a user-defined threshold value above a particular r2 (in this case 0.8). For each set of independent SNPs, a permutation procedure can be applied by keeping the linkage disequilibrium (LD) constant and permuting the phenotype a large number of times (10,000 times in this case). The empirical p-value is defined as the number of times the permuted set-statistic (i.e. the mean single-SNP association statistic over the independent SNPs) exceeds an original set statistic +1 (R+1) divided by the number of permutations +1 (N+1=10,001).
Two separate set-based analyses were conducted to obtain empirical values of association: (1) a selected list derived from the top 5% of the genes in the MGS GWAS dataset and, (2) a more focused examination of candidate genes for AD. For assessing the top genes in the MGS dataset, we listed the top performing SNPs located either within genes or within 100kb of genes. The top 5% of genes were thus selected, however due to the considerable computing effort required to perform the permutations, a further cutoff was applied to this list; set-based gene-wise permutations were limited to genes where the top SNP showed p≤0.0005. Further, to avoid over-inflation of the permuted p-value, the SNP with the smallest p-value was removed from the set-based analysis.
For the second analysis, we a priori selected 48 genes (Table 2) with evidence for association with AD from four previous gene-finding efforts for AD: COGA (Begleiter 1995), the IASPSAD (Prescott et al. 2005), the Connecticut sample (Lappalainen et al. 2002), and the GWAS results from the German sample (Treutlein et al. 2009). We identified SNPs in these genes in the MGS dataset and performed set-based permutations at the gene-wise level to correct for multiple testing of SNPs and at the experiment-wise level to correct for multiple testing of genes.
Table 2.
Genes selected for the set-based analysis from previous published reports. We note that evidence for these genes is not confined to these reports.
| Gene ID | Chr | Associated Phenotype | Sample/s | Reference |
|---|---|---|---|---|
| OPRD1 | 1 | substance dependence | CT | Zhang et al, 2008 |
| POMC | 2 | opioid dependence in alcoholic families | COGA,CT | Xuei et al, 2007; Zhang et al, 2009 |
| GAD1 | 2 | initial sensitivity; age of onset of AD | IR | Kuo et al, 2009 |
| PECR | 2 | AD (GWAS) | TR | Treutlein et al, 2009 |
| ERC2 | 3 | AD (GWAS) | TR | Treutlein et al, 2009 |
| GABRG1 | 4 | AD | CT | Covault et al, 2008 |
| GABRA2 | 4 | AD; conduct disorder, antisocial disorder | COGA | Edenberg et al, 2004; Dick et al, 2006 |
| SNCA | 4 | Craving | COGA | Foroud et al, 2007 |
| ADH5 | 4 | AD | CT,IR | Luo et al, 2006; Kuo et al, 2009 |
| ADH4 | 4 | AD | COGA,CT,IR | Edenberg et al, 2006; Luo et al, 2007; Kuo et al, 2009 |
| ADH1A | 4 | AD | COGA,CT,IR | Edenberg et al, 2006; Luo et al, 2007; Kuo et al, 2009 |
| ADH1B | 4 | AD | COGA,CT,IR | Edenberg et al, 2006; Luo et al, 2007; Kuo et al, 2009 |
| ADH1C | 4 | AD (GWAS) | TR,IR | Treutlein et al, 2009 |
| ADH7 | 4 | AD | CT | Luo et al, 2007 |
| NFKB1 | 4 | AD | COGA | Edenberg et al, 2008 |
| TACR3 | 4 | AD and cocaine dependence | COGA | Foroud et al, 2008 |
| DKK2 | 4 | AD symptom counts | IR | Kalsi et al, 2010 |
| EGF | 4 | AD symptom counts | IR | Kalsi et al, 2010 |
| CAST | 5 | AD (GWAS) | TR | Treutlein et al, 2009 |
| ERAP1 | 5 | AD (GWAS) | TR | Treutlein et al, 2009 |
| PCDHA1-13 | 5 | AD (GWAS) | TR | Treutlein et al, 2009 |
| PPP2R2B | 5 | AD (GWAS) | TR | Treutlein et al, 2009 |
| GABRA1 | 5 | Drinking patterns | GOGA | Dick et al, 2006 |
| CNR1 | 6 | AD and drug dependence | CT | Zuo et al, 2007 |
| GABRR1 | 6 | AD | COGA | Xuei et al, 2010 |
| GABRR2 | 6 | AS | COGA | Xuei et al, 2010 |
| ESR1 | 6 | AD (GWAS) | TR | Treutlein et al, 2009 |
| OPRM1 | 6 | AD and drug dependence | CT | Zhang et al, 2006 |
| NPY | 7 | AD | CT | Lappalainen et al, 2002 |
| ACN9 | 7 | AD | COGA | Dick et al, 2008 |
| CHRM2 | 7 | AD, Major depressive disorder, illicit drugs | COGA | Wang et al, 2004; Luo et al, 2005 |
| GATA4 | 8 | AD (GWAS) | TR | Treutlein et al, 2009 |
| OPRK1 | 8 | AD | COGA,CT | Xuei et al, 2006; Zhang et al, 2008 |
| PENK | 8 | opioid dependence | COGA | Xuei et al, 2007 |
| NCAM1 | 11 | AD | CT | Yang et al, 2007 |
| TTC12 | 11 | AD | CT | Yang et al, 2007 |
| ANKK1 | 11 | AD | COGA,CT | Dick et al, 2007; Yang et al, 2007 |
| DRD2 | 11 | AD | COGA,CT | Dick et al, 2007; Yang et al, 2007 |
| CCDC41 | 12 | AD (GWAS) | TR | Treutlein et al, 2009 |
| ALDH2 | 12 | AD | CT,IR | Luo et al, 2006; Kuo et al, 2009 |
| GABRG3 | 15 | AD | COGA | Dick et al, 2004 |
| CHRNA5 | 15 | AD | COGA | Wang et al, 2009 |
| CDH13 | 16 | AD (GWAS) | TR | Treutlein et al, 2009 |
| ZNF699 | 19 | AD | IR | Riley et al, 2006 |
| CD3EAP | 19 | AD (GWAS) | TR | Treutlein et al, 2009 |
| PDYN | 20 | AD | COGA | Xuei et al, 2006 |
| OPRL1 | 20 | opioid dependence | COGA | Xuei et al, 2007 |
| GRIK1 | 21 | AD | CT | Kranzler et al, 2009 |
Enriched pathways using ALIGATOR
Effect sizes reported for SNPs associated with complex traits have generally been small. Thus, the power of a single GWAS to find SNPs showing unequivocal evidence of association is low. A likely reason for the small effect sizes observed for each individual SNP is genetic heterogeneity - that is, different individuals possess susceptibility alleles at different SNPs, or even different genes. This will greatly reduce the power to detect association with any single SNP. However, if the genes in question influence etiology through a common biological pathway, tests based on the pathway as a whole should give increased power to detect association, even in the absence of any genome-wide significant single SNPs, as well as being more replicable between studies.
The idea of pathway enrichment analysis is to test whether a specified set of biologically related genes (pathway) shows greater than expected association with disease compared to a random set of genes. ALIGATOR (Holmans et al. 2009) was used to perform such an analysis using a combined set of GO categories and KEGG pathways. ALIGATOR converts a list of significant SNPs into a list of significant genes (defined as those genes containing one or more significant SNPs) and tests this list for enrichment of gene sets defined by the categories/pathways. Enrichment is defined as a gene set containing a larger number of significant genes than expected by chance. Replicate gene lists of the same length as the original are generated by randomly sampling SNPs (thus correcting for variable gene size). The lists are used to obtain p-values for enrichment for each gene set (by comparing the number of significant genes observed on the actual gene list to that observed on each replicate list), to correct these for testing multiple non-independent categories, and to test whether the number of significantly enriched categories is higher than expected (for a fuller description, see Holmans et al. 2009). Unlike methods designed for gene-expression data (where there is typically only one measurement per gene), ALIGATOR uses data from all the SNPs tested in a gene and corrects for the variable numbers of SNPs per gene. Each gene is counted once regardless of how many significant SNPs it contains, thus eliminating the influence of LD between SNPs within genes.
The analysis was restricted to GO categories and KEGG pathways containing at least three genes, resulting in a total of 7652 gene sets. SNPs that mapped to within 20kb of a gene (genome build 36_3) were assigned to that gene, in order to include promoter and regulatory regions. If SNPs mapped within 20kb of more than one gene all such genes were included. The choice of a 20kb window is not entirely arbitrary, since a recent study of gene expression found that the majority of eQTLs lie within genes (Veyrieras et al. 2008). Any one SNP was not allowed to add more than one gene to any GO category, to prevent the analysis being biased by SNPs located in multiple functionally related overlapping genes. Gene sets required at least two signals to be counted as enriched, in order to remove the possibility of a small gene set being deemed significantly enriched based on one signal.
To prevent the number of significantly-enriched gene sets being inflated by clusters of closely-related GO categories/KEGG pathways containing the same set of significant genes, a pruning procedure was then applied to the gene sets. A relatedness measure R was defined for each pair of gene sets as the number of genes in both sets divided by the number of genes in either (or both) sets. Thus identical gene sets would have an R=1 and completely non-overlapping ones have R=0. A criterion K was defined, and the list of gene sets pruned by removing categories with R > K, producing less biased but more significantly enriched gene sets. The same pruning procedure was applied to the lists of enriched gene sets from the simulated studies generated in ALIGATOR, to enable a test of an excess number of enriched gene sets, allowing for pruning, to be performed. In this paper, we utilized two values of K: 0.2 and 0.5.
Results
Factor Analysis
An exploratory factor analysis conducted in Mplus (Muthen and Muthen 2007) revealed a single strong AD factor with loadings ≥ +0.84 for all seven items. A confirmatory single factor analysis yielded excellent values for CFI (0.976) and TLI (0.984) and acceptable values for RMSEA (0.086). All items loaded very strongly on the common factor with the two highest assessing alcohol-related interference (+0.97) and loss of control (+0.93) while the two lowest (both +0.83) evaluating tolerance and use of alcohol despite knowledge of harm. These factor scores were then regressed onto the covariates of age, sex, and race (i.e., EA versus AA) and the residuals, for GWAS analysis. The distribution of this score is seen in Figure 1.
FIGURE 1.
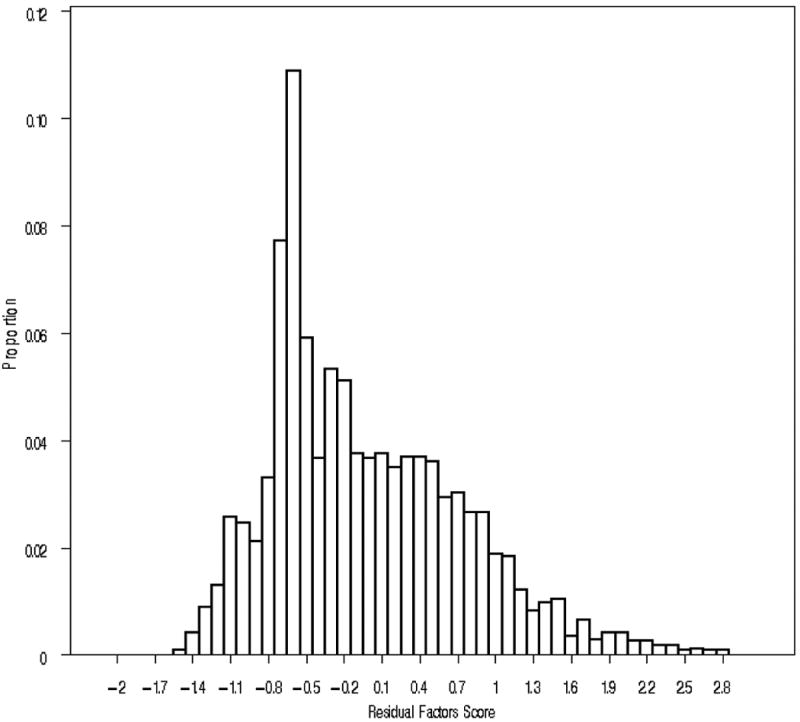
The distribution of the residual scores on the alcohol dependence symptom factor (n=3,169). The X-axis reflects the residual factor score, determined by confirmatory factor analysis and accounting for the effects of age, sex and ethnicity, for 7 items reflecting symptoms of alcohol dependence. The Y–axis reflects the proportion of the sample falling into each scoring category.
SNP Based Analysis
In our association analysis based on the AD factor score, we observed 60 SNPs with p<10-5 in the EA sample and 81 SNPs showing p<10-5 in the AA sample. In both samples, the top SNPs were located in intergenic regions: in the EA sample rs2876950 (p=7.52×10⁻⁶) was 148kb from the nearest gene, COBL (cordon bleu homolog), and in the AA sample, rs6777876 (p=4.0×10⁻⁷) was 68kb from a predicted gene, C3orf31, and 277kb from SYN2 (synapsin II). Although many SNPs were located in intergenic regions, both samples showed several SNPs to be located within or close to genes. Using a cutoff of p<10-4, we observed 249 SNPs lying either in a gene or located within 100kb of a gene in the EA sample and 438 such SNPs in the AA sample. These SNPs are listed in the supplementary Tables A1 and A2.
Set-Based Analysis of the Top Genes
Selection of a subset of genes from the top 5% (based on a cutoff of top SNP showing p≤0.0005), identified 51 genes in the EA sample and 98 genes in the AA sample. Results of the set-based analyses using 10,000 permutations showed that the number of genes achieving gene-wise significance was greater than expected. At a significance threshold of 5%, we would have expected 3 significant genes in the EA sample and 5 in the AA sample. However, our analyses demonstrated gene-wise significance in 9/51 genes in the EA sample and 6/98 genes in the AA sample (Table 1). At the more stringent significance cutoff of 0.5%, we would have expected by chance zero or one significant gene in both samples. Instead we observed 5 genes in the EA sample and 3 genes in the AA sample (empirical p<0.005).
Table 1.
The top genes in the European-American and African-American samples: the top 5% genes were identified based on top performing SNPs located either in a gene or within 100kb of genes. Permutations were conducted to calculate empirical p-values. The uncorrected p-values for the top SNPs are shown. Although individual SNPs in the genes do not show experiment-wise significance, several genes produced empirically significant values. 3 genes in the EA and 1 gene in the AA sample meet a Bonferroni-like experiment-wide correction. Six genes in the EA and 5 genes in the AA sample show gene-wise significance.
| GENE ID | CHR | Permuted p-value | top SNP | position_bp, HapMap | uncorrected p-value |
|---|---|---|---|---|---|
| European-American | |||||
| PITRM1 | 10 | 0.0004 | rs2279216 | 3170951 | 3.77E-05 |
| PIGG | 4 | 0.0005 | rs11730410 | 531595 | 1.83E-05 |
| AKAP9 | 7 | 0.0005 | rs10281556 | 91497989 | 6.18E-05 |
| PFKP | 10 | 0.0014 | rs1053000 | 3168881 | 7.71E-05 |
| KRIT1 | 7 | 0.0018 | rs2040499 | 91647593 | 5.15E-05 |
| AOX1 | 2 | 0.0055 | rs2241080 | 201235484 | 3.95E-05 |
| AHNAK2 | 14 | 0.0055 | rs2033932 | 104518120 | 7.68E-05 |
| KCNMA1 | 10 | 0.0166 | rs717207 | 78713370 | 2.17E-05 |
| IGFBP1 | 7 | 0.0363 | rs2854843 | 45897660 | 5.38E-03 |
| DOCK2 | 5 | 0.1081 | rs1316638 | 169409589 | 2.66E-05 |
| PLA2G4A | 1 | 0.1377 | rs761516 | 185227949 | 5.15E-05 |
| TRPC4 | 13 | 0.1453 | rs4943543 | 37372387 | 6.18E-05 |
| DAB1 | 1 | 0.2211 | rs10159302 | 57578138 | 7.85E-05 |
| CGNL1 | 1 | 0.3178 | rs12440459 | 55482230 | 6.76E-05 |
| CNTNAP2 | 7 | 0.7155 | rs10279700 | 146599228 | 4.08E-05 |
| African-American | |||||
| KCNQ5 | 6 | 0.0002 | rs3799285 | 73947782 | 2.00E-05 |
| MGLL | 3 | 0.0012 | rs11716997 | 129034320 | 5.11E-05 |
| SLC35B4 | 7 | 0.0015 | rs2544208 | 133620656 | 9.08E-06 |
| MORC1 | 3 | 0.0066 | rs2197741 | 110214799 | 3.10E-05 |
| IL8 | 4 | 0.0081 | rs2886920 | 74845809 | 2.52E-05 |
| CEACAM6 | 19 | 0.0236 | rs2701 | 46966939 | 1.05E-05 |
| GSTA3 | 6 | 0.0613 | rs588565 | 52900813 | 1.72E-03 |
| PTPLAD2 | 9 | 0.0676 | rs11789272 | 21020851 | 5.42E-05 |
| GRIN2A | 16 | 0.1320 | rs7206714 | 10085496 | 1.69E-05 |
Of the 9 genes showing significance at the p=0.05 cutoff in the EA sample, 3 genes produced empirical values of p≤0.0005: PITRM1 (pitrilysin metallopeptidase), PIGG (phosphatidylinositol glycan anchor biosynthesis, class G), and AKAP9 (A kinase (PRKA) anchor protein (yotiao) 9). Moreover, these 3 genes can be considered to survive experiment-wise Bonferroni-like correction. Genes showing only gene-wise significance included KRIT1 (ankyrin repeat containing), p=0.0018 and PFKP (phosphofructokinase, platelet), p=0.0014. There were 4 genes with permuted p-values between 0.05 and 0.001: AOX1 (aldehyde oxidase 1), p=0.0055; AHNAK2 (AHNAK nucleoprotein 2), p=0.0055; KCNMA1 (potassium large conductance calcium-activated channel, subfamily M, alpha member 1), p=0.0166; IGFBP1 (insulin-like growth factor binding protein 1), p=0.0363.
Although analyses in the AA sample also produced gene-wise significance for several genes, there was no overlap in the top genes in the two samples (Table 1). The most significant gene in the AA sample was KCNQ5 (potassium voltage-gated channel, KQT-like subfamily, member 5) with an empirical p=0.0002; this gene was also the only one to survive experiment-wide Bonferroni correction. Two genes achieved gene-wise significance with p-values of 0.001: SLC35B4 (solute carrier family 35, member B4) and MGLL (monoglyceride lipase). A further three genes showed gene-wise significance of p<0.05, specifically IL8 (interleukin 8), p=0.008, MORC1 (MORC family CW-type zinc finger 1), p=0.006 and CEACAM6 (carcinoembryonic antigen-related cell adhesion molecule 6 (non-specific cross reacting antigen), p=0.023.
Set-Based Analysis of Candidate Genes Selected a Priori
We performed set-based permutation using an a priori list of 48 genes selected from four previous GWAS based gene-finding efforts in AD (Table 2). Although none of these genes achieved experiment-wise correction for multiple testing, gene-wise evaluation produced a number of genes yielding significance under the null (Table 3). We note that not all of them produced results; Table 3 shows the genes which achieved significance, or not, under the null. We considered first the full sample (EA and AA) and then each sub-sample separately. In the full sample, 20 genes yielded results, of which 2 survived permutation under the null hypothesis to produce p<0.05 and a total of 7 at p<0.1. Results in the individual samples showed statistical trends (p<0.1) for 5/19 genes in the EA samples and 7/23 for the AA sample. Overall, the most significant result was observed for ADH1C (alcohol dehydrogenase 1C) which produced a permuted value of p=0.015 in the combined sample. Considering the two samples separately, the most significant result was ADH1C in the EA sample (p=0.003) and POMC (proopiomelanocortin) in the AA sample (p = 0.0008). In the EA sample, p<0.1 was observed for PECR (peroxisomal trans-2-enoyl-coA reductase), ERC2 (ELKS/RAB6-interacting/CAST family member 2), ADH1C, NFKB1 (nuclear factor of kappa light polypeptide gene enhancer in B-cells 1), and ANKK1. In the AA sample, the 7 genes producing trend results (p<0.1) were: ADH5 (alcohol dehydrogenase 5), DKK2 (dickkopf homolog 2), PPP2R2B (protein phosphatase 2, subunit B, beta isoform), GABRR1 (gamma amino-butyric acid receptor, rho 1), CHRM2 (cholinergic receptor, muscarinic 2), ZNF699 (zinc finger protein, 699), and POMC.
Table 3. Set-based analyses using prior candidate genes selected for association with AD.
| GENE ID | ALL | EA | AA |
|---|---|---|---|
| p-values | p-values | p-values | |
| PECR | 0.061 | 0.066 | |
| ERC2 | 0.452 | 0.086 | 0.616 |
| GABRG1 | 0.233 | ||
| GABRA2 | 0.219 | 0.122 | 0.121 |
| ADH5 | 0.050 | ||
| ADH1C | 0.015 | 0.003 | |
| NFKB1 | 0.059 | 0.024 | |
| DKK2 | 0.046 | 0.036 | |
| EGF | 0.152 | 0.209 | 0.107 |
| CAST | 0.527 | 0.411 | |
| ERAP1 | 0.132 | ||
| PCDHA4 | 0.330 | 0.111 | 0.225 |
| PPP2R2B | 0.741 | 0.330 | 0.040 |
| GABRR1 | 0.071 | 0.099 | |
| ESR1 | 0.330 | 0.611 | |
| OPRM1 | 0.593 | 0.220 | |
| CHRM2 | 0.068 | 0.104 | 0.048 |
| GATA4 | 0.327 | ||
| OPRK1 | 0.224 | ||
| NCAM1 | 0.200 | 0.567 | 0.893 |
| TTC12 | 0.177 | 0.104 | |
| ANKK1 | 0.066 | 0.068 | |
| DRD2 | 0.407 | 0.227 | |
| CCDC41 | 0.223 | 0.129 | 0.223 |
| GABRG3 | 0.676 | 0.568 | 0.582 |
| CDH13 | 0.218 | 0.955 | 0.170 |
| ZNF699 | 0.015 | ||
| GRIK1 | 0.859 | 0.870 | 0.897 |
| POMC | 0.171 | 0.001 | |
| OPRD1 | 0.144 |
Gene Ontology Categories/KEGG pathways
We first applied the ALIGATOR program to our EA and AA samples examining 364,069 SNPs covering 22,702 genes in the EA sample and 441,447 SNPs covering 22,902 genes in the AA sample; the results are presented in Table 4. The list of significant SNPs was chosen such that 5% of genes were covered (i.e. the 5% of genes with the most significant single-SNP p-value). For the EA sample, this corresponded to a SNP p-value criterion of 0.0046, and a list of 1135 genes. For the AA sample, the SNP p-value criterion was 0.0030, and the gene list contained 1145 genes.
Table 4.
ALIGATOR enrichment analyses of GO categories/KEGG pathways among association signals in EA and AA samples, showing significantly more enriched categories/pathways than expected by chance. Specific enriched categories representing potentially functional pathways are presented in the following two tables for the two analyses highlighted in bold in this table.
Note: Columns headed “N of cat” show the total numbers of categories significantly enriched at the p-value specified in the column head. “p-value” refers to the test of whether the number of enriched categories is higher than expected by chance.
The list of significant genes was defined as the 5% of genes with the most significant single-SNP p-values and analysis was restricted to categories containing at least 2 genes on this list. SNPs were assigned to genes if they lay within 20kb of that gene.
| Categories enriched at p<0.05 | Categories enriched at p<0.01 | Categories enriched at p<0.001 | ||||||||||
|---|---|---|---|---|---|---|---|---|---|---|---|---|
| EA | AA | EA | AA | EA | AA | |||||||
| Pruning of closely-overlapping categories | N of cat. | p-value | N of cat. | p-value | N of cat. | p-value | N of cat. | p-value | N of cat. | p-value | N of cat. | p-value |
| Unpruned (all categories analysed) | 347 | 0.003 | 254 | 0.064 | 96 | 0.004 | 62 | 0.052 | 15 | 0.009 | 6 | 0.241 |
| pruned (overlap <0.5) | 234 | 0.001 | 180 | 0.040 | 58 | 0.005 | 46 | 0.034 | 13 | 0.001 | 5 | 0.200 |
| pruned (overlap <0.2) | 168 | <0.001 | 127 | 0.040 | 50 | <0.001 | 28 | 0.138 | 10 | 0.005 | 3 | 0.404 |
In the EA sample, 347 categories/pathways were observed to be enriched at p<0.05, 96 at p<0.01 and 15 at p<0.001. These numbers are significantly larger than expected by chance (p=0.003, p=0.004, p=0.009 respectively), suggesting a biological basis for AD captured by the GO and KEGG annotations. When gene set pruning was applied, the excess of enriched categories became even more significant (Table 4), suggesting that the results are not being driven by a few well-annotated areas of biology, each containing several closely-related GO categories/KEGG pathways.
In the AA sample, 254 categories/pathways were observed to be enriched at p<0.05, 62 at p<0.01 and 6 at p<0.001. While there is some evidence for an excess of enriched categories at the less stringent significance levels (p=0.064 and p=0.052, respectively), this does not reach formal statistical significance. At an enrichment significance level of p<0.001, an excess of enriched categories is not observed (p=0.241). Applying pruning with K=0.5 increased the significance of the number of categories enriched at p<0.05 and p<0.01 (p=0.040 and p=0.034, respectively). There is thus some evidence for a biological basis to AD, captured by GO and KEGG annotations, in the AA sample. However, this evidence is not as strong as in the EA sample and a possible explanation may be due in part to the smaller AA sample.
In the supplementary data (Tables A3 and A4), we present the specific enriched GO categories/KEGG pathways corresponding to the most significant results in Table 4, at the category cutoff of p<0.01 for both samples. Thus, Table A3 contains those categories enriched at p<0.01 in the EA sample when pruning was applied with K=0.2, and Table A4 contains the GO categories/KEGG pathways enriched at p<0.01 in the AA sample when pruning was applied with K=0.5. The EA sample produced an excess of categories related to such diverse functions as response to hormone stimulus, membrane raft organization, anatomical structure homeostasis, phosphorylation, and regulation of transporter activity. GO categories observed in the AA sample included functions such as lipid catabolic processes, regulation of protein transport, regulation of cell adhesion, and cholesterol metabolic process. In tables A5 and A6, we present some of the individual GO categories for the top 5% of genes. These tables illustrate that genes may be functionally involved in several processes and therefore can occur in more than one GO category.
Discussion
In our general population sample, after excluding lifetime abstainers, we identified a highly coherent single factor with strong loadings on all 7 items assessing the symptoms of alcohol abuse and dependence. When controlling for age, sex and ancestry, the estimated residual AD factor scores was broadly dispersed, indicating that we succeeded at assessing a wide range of vulnerability to AD. We analyzed the available genetic data in this sample at three levels: i) individual SNPs and genes from the association analysis, ii) prior selected candidate genes and iii) GO categories. We organize this discussion around these three levels of analysis.
Association Analyses in the MGS control samples
In this study of a genome-wide analysis of a general population sample using a quantitative AD factor score, none of the SNP results achieved genome-wide significance. The genes that showed more tentative signals encoded kinases, peptidases, binding proteins, zinc finger proteins, and channel proteins. Our permutation tests in the EA sample produced statistical significance for a number of genes, with three of them (PITRM1, PIGG and AKAP9) demonstrating experiment-wide significance. Amongst these top genes, PITRM1 (p=0.0004) encodes a protein involved in the degradation of peptides. Although PITRM1 may at first appear to have little relevance to AD, a prior genome-wide study found 3 SNPs in this gene showing p<8.9×10⁻⁶ (Anney et al. 2008) impacting on risk for conduct disorder which has been frequently shown to increase vulnerability to alcohol problems.
Another noteworthy signal in the EA sample was observed in AKAP9, which produced 13 SNPs with p<10-4 and an empirical p=0.0005. Encoding a cytoskeletal protein, AKAP9 belongs to a family of structurally diverse A-kinase anchor proteins which regulate intracellular signaling through scaffolding and trafficking. The protein has been shown to co-localize with N-methyl-D-aspartate subunit 1 (GRIN1) (Lin et al. 1998) and through binding to the C-terminal of the NR1 receptor unit, it may be involved in the cytoskeletal anchoring of NMDA receptors, thereby serving a role in synaptic function (Lin et al. 1998). Anchor proteins at synaptic junctions facilitate specific clustering and anchoring of neurotransmitters and ion channels; evidence suggests that they can regulate signaling activity of NMDA receptors by modulating phosphorylation through interactions with phosphatase-kinase complexes (Dohrman et al. 2002; Westphal et al. 1999). In AD, NMDA receptors play a critical role by affecting tolerance, craving, withdrawal, and relapse (Kumari and Ticku 2000); alcohol may disrupt specificity of the signaling cascades and the protein-protein complexes (Ron 2004). Thus, by affecting the NMDA signaling cascade, AKAP9 would be involved in the molecular mechanisms of alcohol use disorders.
Of particular interest is the result in KCNMA1 which produced numerous SNPs with p<10-4 and an empirical p=0.016; experimental evidence suggests that this gene may affect development of tolerance to alcohol (Davies et al. 2003; Ghezzi et al. 2004; Pietrzykowski et al. 2004). KCNMA1 encodes the pore-forming alpha 1 subunit of the large conductance, voltage and calcium-sensitive potassium channels, known as BK (for ‘big’ potassium channels) channels. Alcohol has an immediate effect on the BK channel, leading to increased activity (Dopico et al. 1999; Dopico, Anantharam, and Treistman 1998). Some of the actions of alcohol may arise through prolongation of the opening of this channel (Dopico et al. 1999). Experiments involving slo-1, the nematode homolog of KCNMA1, showed that mutant animals were resistant to the effects of alcohol, suggesting that the gene may be involved in alcohol tolerance (Crowder 2004; Davies et al. 2003). KCNMA1 may have a similar effect in humans; polymorphisms in KCNMA1 were associated with the subjective assessment of level of response to alcohol (Schuckit et al. 2005). Given this prior evidence, our findings provide additional evidence that the gene may impact on AD risk.
In the AA sample, the top signals were also in genes potentially involved in signal transduction, suggesting the importance of signaling pathways to alcohol use disorders. Similar to the results in the EA sample, the AA sample produced significant gene-wise results in a gene encoding a potassium voltage gated channel protein. In the EA sample, the signal was in KCNMA1 and in the AA sample, we observed gene-wise empirical results with KCNQ5, which produced an empirical p=0.0002; indeed, the gene also demonstrates experiment-wide significance. As a member of the Kv7 family of potassium channel subunits, it encodes a protein which functions as a low-threshold voltage gated channel known as M-channel (Brown and Passmore 2009). M-channels are characteristically inhibited by the activity of hormones and transmitters on G-protein coupled receptors. Modulation of ligand-gated ion channels is critical to producing alcohol-induced effects and a recent study looking specifically at channel currents in the mesolimbic dopamine pathway showed that alcohol produced an inhibition of the M-current in ventral tegmental area (VTA), subsequently producing excitation of the dopamine neurons (Koyama, Brodie, and Appel 2007). This is a critical mechanism underlying alcohol-induced increase in dopamine levels in the VTA.
Another significant result was the solute carrier, SLC35B4 (p=0.0015), encoding a glycosyltransferase involved in the transfer of nucleotide sugars from the cytoplasm to the Golgi apparatus for synthesis of glycoproteins (Ashikov et al. 2005). Glycosyltransferases are critical to metabolism of carbohydrates (Davies, Gloster, and Henrissat 2005) and may potentially be related to alcohol metabolism.
Comparing our results with recently published GWAS studies (Bierut et al. 2010; Edenberg et al. 2010; Lind et al. 2010; Treutlein et al. 2009) we see little overlap with genes identified in these studies, apart from the notable exception of KCNMA1. In the GWAS performed in the Collaborative Study of Genetics of Alcoholism (COGA) sample, one SNP (rs12219105) produced p=1.5×10⁻⁴ with AD in the EA case-control subset and p=3.9×10⁻² in the AA case-control subset. A further test in the family sample produced nominal results (p=0.036) in individuals with early onset of AD. A meta-analysis of two GWAS studies, examining nicotine and AD in Australian and Dutch population samples showed that rs592676 in KCNMA1 was associated with nicotine dependence (Lind et al. 2010). Some of the top signals from the German GWAS (Treutlein et al. 2009) were examined in our set-based analysis and these are discussed in the section below.
Candidate Gene Analysis
To complement our genome wide study, we examined whether our study replicated genes with prior evidence for association with AD, a priori selecting 48 genes. We assessed gene-wise and experiment-wise significance by conducting permutation tests to correct for the number of genes and for the variable number of SNPs per gene and the LD structure of those SNPs. We note that although the analysis did not produce experiment-wise significance for any of the genes, the results for gene-wise analysis indicated several genes achieving significance. Furthermore, given the prior evidence for association of each of these genes with AD, it could be argued that an experiment-wise correction is too conservative. In the combined analysis, ADH1C was the most significant finding and considering that ADH genes are the most plausible candidates for alcoholism, it is encouraging that our set-based analysis confirmed prior results with this gene. Previous association studies between ADH genes and AD have been widely replicated (Birley et al. 2009; Edenberg and Foroud 2006; Macgregor et al. 2009; Whitfield 2002). Allelic variants in ADH1C have generally demonstrated association in East Asians, who experience a ‘flushing’ reaction, leading to a protective effect (Chen et al. 1999; Osier et al. 1999). Nonetheless, a recent study examining the direct relationship between drinking measures and ADH variants showed that a polymorphism in ADH1C was associated with alcohol consumption in a large Caucasian population sample (Macgregor et al. 2009). In the current study, the combined analysis produced an empirical p=0.015 and when analyzed separately, the EA sample produced p=0.003, which represented the most significant result in the EA sample for the set-based analyses. Although, the AA sample did not produce any results with this gene it showed significant results with another ADH gene, ADH5 (p=0.05). Previous findings with this gene include association (p=0.004) in a small sample of 150 individuals of AA ancestry (Luo et al. 2007).
Two genes which had previously shown association with AD in the large COGA sample were also broadly replicated in the EA sample, with analyses producing encouraging results with ANKK1 (ankyrin repeat and kinase domain containing 1; p=0.068) and NFKB1 (nuclear factor of kappa light polypeptide gene enhancer in B-cells 1; p=0.024). Studies in the COGA sample had reported nominal association with two SNPs in ANKK1 (p=0.03) (Dick et al. 2007) and examination of NFKB1 had shown experiment-wide significant association (p=0.01), after correction for multiple testing. Just as replication of previously reported candidate genes is necessary to assess the validity of the findings, results of GWAS also need to be tested in other samples and our set-based analyses provided supporting evidence for PECR (peroxisomal trans-2-enoyl-CoA reductase). One SNP (rs7590720) produced genome-wide significance with P=9.72×10⁻⁹ in a German sample (Treutlein et al. 2009). Although no single SNP produced p<10-3 in our study, gene-wise permutation produced a trend result: p=0.06.
In our gene-wise assessment in the AA sample, we observed a different set of results. We cannot be sure the degree to which these differences result from chance effects, or reflect differences in the underlying genetic architecture of risk for AD in these two ancestries (as has recently been suggested for schizophrenia (Purcell et al. 2009)). The most significant gene in the AA sample in our study was POMC, which had been previously tested in a family and population-based case-control study but had not produced significant association (Zhang et al. 2009); our study yielded a permuted P=0.0008. Of interest are results from two genes, DKK2 and ZNF699, which had previously shown significant association with AD symptom counts (Kalsi et al. 2010) and AD (Riley et al. 2006) in a severely affected clinical sample of Irish ancestry.
Gene Ontology Analysis
The ALIGATOR program was developed to identify groups of genes which may be potentially etiological for complex disorders (Holmans et al. 2009), based on whether they belong to particular GO categories. This analysis was extended here to include KEGG pathways. In our EA sample, application of the ALIGATOR algorithm found a highly significant excess of enriched GO categories/KEGG pathways, based on SNPs within 20kb of genes (Table 4). In the AA sample, the results were less striking, although of borderline statistical significance. This may be due to the AA sample being smaller, and thus less powerful.
When we examined the GO categories with an excess of hits within genes displaying high scores on our AD factor score (results presented in Appendix, Tables A3 and A4), there was a surprising lack of neurotransmitter or receptor based GO categories. Nonetheless, we did observe several GO categories that could potentially be involved in the molecular mechanisms of AD such as tolerance and withdrawal. Thus, the analysis in the EA sample identified cellular mechanisms including responses to hormonal stimuli, anatomical structural homeostasis, phosphorylation, and NADPH oxidase complex, glucocorticoid stimulus, cellular response to insulin stimulus, insulin receptor signaling pathway, and sulfation. Some of these categories suggest a role in the general biology underlying addictive behavior; when the genes were considered individually, we observed signals in genes related to calcium and potassium signaling and glutamate receptor subunits which may have a direct role in addiction, including AD. ALIGATOR analysis helped to highlight processes related to underlying mechanisms; the Australian/Dutch GWAS (Lind et al. 2010) also reported results with genes encoding transporters, cell adhesion molecules and cytoskeleton proteins. Structural homeostasis has been shown to play a role in the regulation of drug-induced neuroplasticity through regulation of scaffold protein and signal transduction (Szumlinski, Ary, and Lominac 2008).
ALIGATOR analysis also found evidence in the AA sample for over-representation of genes; these were primarily related to lipid and cholesterol metabolism as well as functions such as regulation of cell adhesion and insulation signaling, which overlap with those found in the EA sample. Recent work on lipid metabolism has highlighted a complex pathway of interacting proteins such as PPARα (peroxisome proliferators-activated receptor-α), SREBP (sterol regulatory element-binding protein) proteins which regulate cholesterol and fatty acid synthesis, cytokines and signaling proteins such as NF-κB (nuclear factor-κB) (Sozio and Crabb 2008).
Yet others may be involved in alcohol-related pathology, for example, the interaction of alcohol and lipid metabolism is fundamental to the pathogenesis of alcoholic fatty liver, hyperlipidemia and atherosclerosis produced by excessive alcohol consumption (Feinman and Lieber 1999). Our study has highlighted genes encoding transcription factors, regulatory proteins, lipid metabolism, cell signaling, and it is plausible that variants of these genes may be involved in risk for AD as well as alcohol-related pathology such as liver dysfunction.
Limitations
These results should be interpreted in the context of three potentially important methodological limitations. First, our sample contained large numbers of individuals who drank but reported never consuming substantial amounts of alcohol at one time. Because of the skip structure of the CIDI-SF, they were not asked about symptoms of alcohol abuse or dependence. We included them but assumed that they would have endorsed no symptoms. This assumption is unlikely to be entirely correct but preferable to excluding them from the analysis.
Second, our sample was underpowered to detect the small effect sizes genes that are likely to impact on risk for AD. Looking at our larger EA sample and assuming an r2 of 0.8 between a SNP and a risk variant (Clayton, Chapman, and Cooper 2004), our power to detect a variant at the commonly accepted genome wide significance level of p ≤5 × 10⁻⁸ that influenced 0.5, 1.0., 1.5, 2.0 and 2.5% of variance in our AD factor was, respectively, 0.9%, 13.4%, 44.7%, 75.4% and 92.1%. We would have ≥ 80% power to detect a variant responsible for 1, 1.5 and 2% of trait variance at p levels of < 0.001, < 1.0×10⁻⁵ and < 1.0×10⁻⁶, respectively.
Third, as might be expected given our modest statistical power, none of our results reached levels of statistical significance that would provide high confidence that individually they represented true positive findings. Given this low power and the large number of statistical tests performed, it is plausible that a substantial proportion or even all of our results reflect false positives. This problem is not unique to our study and has been seen with other published findings with complex behavior traits including the prior published GWAS studies of AD (Edenberg et al. 2010; Johnson et al. 2006; Treutlein et al. 2009). Our own judgment is that a number of our results are suggestive and in aggregate unlikely to reflect only random effects. Here, we extended our analyses through gene-wise permutations which led to a number of significant results and importantly, these were for genes which represent plausible candidates based on earlier work. In all, we conducted several levels of analyses to examine enrichment of signals and produced statistically significant results at the gene-level, and a few at experiment-wide level, for signals affecting our AD factor score, gene-level replication of previous candidates and enrichment of pathways. We are at an early stage in the process of identifying individual risk loci in the human genome for AD using GWAS methods and our results need to be examined in independent samples to test whether they represent true positive findings. We hope that this paper makes a contribution towards the effort of identifying etiological genes and gene pathways underlying alcohol use disorders.
Supplementary Material
Acknowledgments
This analyses were supported in part by NIH grants R37AA011408, P20AA017828 (Kenneth S. Kendler MD). Data and biomaterials from the NIMH GI (Genetics Initiative) MGS2 (Molecular Genetics of Schizophrenia) control samplewere collected by NorthShore University HealthSystem, Evanston, IL, R01 MH59571, Pablo V. Gejman, M.D. (Collaboration Coordinator; PI) as part of a collaborative R01 application comprised of ten sites. From 2003-2006, the Principal Investigators and Co-Investigators were: NorthShore University HealthSystem, Evanston, IL, R01 MH59571, Pablo V. Gejman, M.D. (Collaboration Coordinator; PI), Alan R. Sanders, M.D.; Emory University School of Medicine, Atlanta, GA, R01 MH59587, Farooq Amin, M.D. (PI); University of California, San Francisco, CA, R01 MH60870, William F. Byerley, M.D. (PI); University of Iowa, Iowa, IA, R01 MH59566, Donald W. Black, M.D. (PI), Raymond R. Crowe, M.D.; Washington University, St. Louis, MO, R01 MH60879, C. Robert Cloninger, M.D. (PI); University of Colorado, Denver, CO, R01 MH59565, Robert Freedman, M.D. (PI), Ann Olincy, M.D.; Stanford University, Palo Alto, CA, R01 MH61675, Douglas F. Levinson, M.D. (PI); Louisiana State University, New Orleans, LA, R01 MH67257, Nancy G. Buccola, APRN, BC, MSN (PI); University of Queensland, Brisbane, Queensland, Australia, R01 MH59588, Bryan J. Mowry, M.D. (PI); Mt. Sinai School of Medicine, New York, NY, R01 MH59586, Jeremy M. Silverman, Ph.D. (PI). Our schizophrenia GWAS (genotyping and analyses) was supported by the Genetic Association Information Network (GAIN) and grants U01MH79469 (Pablo V. Gejman, M.D.), U01MH79470 (Douglas F. Levinson, M.D.), and R01MH81800 (Pablo V. Gejman, M.D.). We thank the individuals at each participating institution for their various contributions, especially Roberta Fishman, John Corcoran, and Douglas A. Fugman and thank the individuals who volunteered for the control sample for their participation.
References
- Anney RJ, Lasky-Su J, O'Dushlaine C, Kenny E, Neale BM, Mulligan A, Franke B, Zhou K, Chen W, Christiansen H, Arias-Vasquez A, Banaschewski T, Buitelaar J, Ebstein R, Miranda A, Mulas F, Oades RD, Roeyers H, Rothenberger A, Sergeant J, Sonuga-Barke E, Steinhausen H, Asherson P, Faraone SV, Gill M. Conduct disorder and ADHD: evaluation of conduct problems as a categorical and quantitative trait in the international multicentre ADHD genetics study. Am J Med Genet B Neuropsychiatr Genet. 2008;147B(8):1369–1378. doi: 10.1002/ajmg.b.30871. [DOI] [PubMed] [Google Scholar]
- Ashikov A, Routier F, Fuhlrott J, Helmus Y, Wild M, Gerardy-Schahn R, Bakker H. The human solute carrier gene SLC35B4 encodes a bifunctional nucleotide sugar transporter with specificity for UDP-xylose and UDP-N-acetylglucosamine. J Biol Chem. 2005;280(29):27230–27235. doi: 10.1074/jbc.M504783200. [DOI] [PubMed] [Google Scholar]
- Begleiter H. The Genetics of Alcoholism. Oxford University Press; New York: 1995. [Google Scholar]
- Bentler PM. Comparative fit indexes in structural models. PB. 1990;107(2):238–246. doi: 10.1037/0033-2909.107.2.238. [DOI] [PubMed] [Google Scholar]
- Bierut LJ, Agrawal A, Bucholz KK, Doheny KF, Laurie C, Pugh E, Fisher S, Fox L, Howells W, Bertelsen S, Hinrichs AL, Almasy L, Breslau N, Culverhouse RC, Dick DM, Edenberg HJ, Foroud T, Grucza RA, Hatsukami D, Hesselbrock V, Johnson EO, Kramer J, Krueger Rf, Kuperman S, Lynskey M, Mann K, Neuman RJ, Nothen NM, Nurnberger JI, Jr, Porjesz B, Ridinger M, Saccone NL, Saccone SF, Schuckit MS, Tishfield JA, Wang JC, Rietschel M, Goate AM, Rice JP, Gene, Environment Association Studies Consortium A genome-wide association study of alcohol dependence. Proc Natl Acad Sci U S A. 2010;107(11):5082–5087. doi: 10.1073/pnas.0911109107. [DOI] [PMC free article] [PubMed] [Google Scholar]
- Birley AJ, James MR, Dickson PA, Montgomery GW, Heath AC, Martin NG, Whitfield JB. ADH single nucleotide polymorphism associations with alcohol metabolism in vivo. Hum Mol Genet. 2009;18(8):1533–1542. doi: 10.1093/hmg/ddp060. [DOI] [PMC free article] [PubMed] [Google Scholar]
- Brown DA, Passmore GM. Neural KCNQ (Kv7) channels. Br J Pharmacol. 2009;156(8):1185–1195. doi: 10.1111/j.1476-5381.2009.00111.x. [DOI] [PMC free article] [PubMed] [Google Scholar]
- Chen CC, Lu RB, Chen YC, Wang MF, Chang YC, Li TK, Yin SJ. Interaction between the functional polymorphisms of the alcohol- metabolism genes in protection against alcoholism. Am J Hum Genet. 1999;65(3):795–807. doi: 10.1086/302540. [DOI] [PMC free article] [PubMed] [Google Scholar]
- Cichon S, Craddock N, Daly M, Faraone SV, Gejman PV, Kelsoe J, Lehner T, Levinson DF, Moran A, Sklar P, Sullivan PF. Genomewide association studies: history, rationale, and prospects for psychiatric disorders. AJP. 2009;166(5):540–556. doi: 10.1176/appi.ajp.2008.08091354. [DOI] [PMC free article] [PubMed] [Google Scholar]
- Clayton D, Chapman J, Cooper J. Use of unphased multilocus genotype data in indirect association studies. Genet Epidemiol. 2004;27(4):415–428. doi: 10.1002/gepi.20032. [DOI] [PubMed] [Google Scholar]
- Cloninger CR, Bohman M, Sigvardsson S. Inheritance of alcohol abuse. Cross-fostering analysis of adopted men. Arch Gen Psychiatry. 1981;38(8):861–868. doi: 10.1001/archpsyc.1981.01780330019001. [DOI] [PubMed] [Google Scholar]
- Crowder CM. Ethanol targets: a BK channel cocktail in C. elegans. Trends Neurosci. 2004;27(10):579–582. doi: 10.1016/j.tins.2004.07.006. [DOI] [PubMed] [Google Scholar]
- Davies AG, Pierce-Shimonura JT, Kim H, VanHoven MK, Thiele TR, Bonci A, Bargmann CI, McIntire SL. A central role of the BK potassium channel in behavioral responses to ethanol in C. elegans. Cell. 2003;115(6):655–666. doi: 10.1016/s0092-8674(03)00979-6. [DOI] [PubMed] [Google Scholar]
- Davies GJ, Gloster TM, Henrissat B. Recent structural insights into the expanding world of carbohydrate-active enzymes. Curr Opin Struct Biol. 2005;15(6):637–645. doi: 10.1016/j.sbi.2005.10.008. [DOI] [PubMed] [Google Scholar]
- Dick DM, Wang JC, Plunkett J, Aliev F, Hinrichs S, Bertelsen S, Budde JP, Goldstein EL, Kaplan D, Edenberg HJ, Nurnberger J, Jr, Hesselbrock V, Schuckit M, Kuperman S, Tischfield J, Porjesz B, Begleiter H, Bierut LJ, Goate A. Family-based association analyses of alcohol dependence phenotypes across DRD2 and neighboring gene ANKK1. Alcoholism-Clinical and Experimental Research. 2007;31(10):1645–1653. doi: 10.1111/j.1530-0277.2007.00470.x. [DOI] [PubMed] [Google Scholar]
- Dohrman DP, Chen HM, Gordon AS, Diamond I. Ethanol-induced translocation of protein kinase A occurs in two phases: control by different molecular mechanisms. Alcohol Clin Exp Res. 2002;26(3):407–415. [PubMed] [Google Scholar]
- Dopico AM, Anantharam V, Treistman SN. Ethanol increases the activity of Ca(++)-dependent K+ (mslo) channels: functional interaction with cytosolic Ca++ J Pharmacol Exp Ther. 1998;284(1):258–268. [PubMed] [Google Scholar]
- Dopico AM, Anantharam V, Treistman SN. Alcohol modulation of calcium-activated potassium channels. Neurochem Int. 1999;35(2):103–106. doi: 10.1016/s0197-0186(99)00051-0. [DOI] [PubMed] [Google Scholar]
- Edenberg HJ, Foroud T. The genetics of alcoholism: identifying specific genes through family studies. Addiction Biology. 2006;11(3-4):386–396. doi: 10.1111/j.1369-1600.2006.00035.x. [DOI] [PubMed] [Google Scholar]
- Edenberg HJ, Koller DL, Xuei X, Wetherill L, McClintick JN, Almasy L, Bierut LJ, Bucholz KK, Goate A, Aliev F, Dick D, Hesselbrock V, Hinrichs A, Kramer J, Kuperman S, Nurnberger LI, Jr, Rice JP, Schuckit MA, Taylor R, Webb BT, Tischfield JA, Porjesz B, Foroud T. Genome-wide association study of alcohol dependence implicates a region on chromosome 11. Alcohol Clin Exp Res. 2010 Mar 1; doi: 10.1111/j.1530-0277.2010.01156.x. epub ahead of print. [DOI] [PMC free article] [PubMed] [Google Scholar]
- Eysenck SBG, Eysenck HJ, Barrett P. A revised version of the psychoticism scale. Personal Individual Differences. 1985;6:21–29. [Google Scholar]
- Feinman L, Lieber CS. Ethanol and lipid metabolism. Am J Clin Nutr. 1999;70(5):791–792. doi: 10.1093/ajcn/70.5.791. [DOI] [PubMed] [Google Scholar]
- Frazer KA, Murray SS, Schork NJ, Topol EJ. Human genetic variation and its contribution to complex traits. Nature Reviews Genetics. 2009;10(4):241–251. doi: 10.1038/nrg2554. [DOI] [PubMed] [Google Scholar]
- Gelernter J, Kranzler HR. Genetics of alcohol dependence. Human Genetics. 2009;126(1):91–99. doi: 10.1007/s00439-009-0701-2. [DOI] [PMC free article] [PubMed] [Google Scholar]
- Ghezzi A, Al-Hasan YM, Larios LE, Bohm RA, Atkinson NS. slo K+ channel gene regulation mediates rapid drug tolerance. Proceedings of the National Academy of Sciences of the United States of America. 2004;101(49):17276–17281. doi: 10.1073/pnas.0405584101. [DOI] [PMC free article] [PubMed] [Google Scholar]
- Goodwin DW, Schulsinger F, Hermansen L, Guze SB, Winokur G. Alcohol problems in adoptees raised apart from alcoholic biological parents. Arch Gen Psychiatry. 1973;28(2):238–243. doi: 10.1001/archpsyc.1973.01750320068011. [DOI] [PubMed] [Google Scholar]
- Grant JD, Agrawal A, Bucholz KK, Madden PA, Pergadia ML, Nelson EC, Lynskey MT, Todd RD, Todorov AA, Hansell NK, Whitfield JB, Martin NG, Heath AC. Alcohol Consumption Indices of Genetic Risk for Alcohol Dependence. Biol Psychiatry. 2009;66(8):795–800. doi: 10.1016/j.biopsych.2009.05.018. [DOI] [PMC free article] [PubMed] [Google Scholar]
- Heath AC, Bucholz KK, Madden PA, Dnwiddie SH, Slutske WS, Bierut LJ, Statham DJ, Dunne MP, Whitfield JB, Martin NG. Genetic and environmental contributions to alcohol dependence risk in a national twin sample: consistency of findings in women and men. Psychol Med. 1997;27(6):1381–1396. doi: 10.1017/s0033291797005643. [DOI] [PubMed] [Google Scholar]
- Heatherton TF, Kozlowski LT, Frecker RC, Fagerstrom KO. The Fagerstrom Test for Nicotine Dependence: a revision of the Fagerstrom Tolerance Questionnaire. Br J Addiction. 1991;86(9):1119–1127. doi: 10.1111/j.1360-0443.1991.tb01879.x. [DOI] [PubMed] [Google Scholar]
- Holmans P, Green EK, Pahwa JS, Ferreira MA, Purcell SM, Sklar P, Owen MJ, O'Donovan MC, Craddock N. Gene ontology analysis of GWA study data sets provides insights into the biology of bipolar disorder. AJHG. 2009;85(1):13–24. doi: 10.1016/j.ajhg.2009.05.011. [DOI] [PMC free article] [PubMed] [Google Scholar]
- Johnson C, Drgon T, Liu QR, Walther D, Edenberg H, Rice J, Foroud T, Uhl GR. Pooled association genome scanning for alcohol dependence using 104,268 SNPs: Validation and use to identify alcoholism vulnerability loci in unrelated individuals from the collaborative study on the genetics of alcoholism. American Journal of Medical Genetics Part B-Neuropsychiatric Genetics. 2006;141B(8):844–853. doi: 10.1002/ajmg.b.30346. [DOI] [PMC free article] [PubMed] [Google Scholar]
- Kalsi G, Kuo PH, Aliev F, Alexander J, JcMichael O, Patterson DG, Walsh D, Zhao Z, Schuckit M, Nurnberger J, Jr, Edenberg H, Kramer J, Vladimirov V, Prescott CA, Dick DM, Kendler KS, Riley BP. A systematic gene-based screen of chr4q22-q32 identifies association of a novel susceptibility gene, DKK2, with the quantitative trait of alcohol dependence symptom counts. Hum Mol Genet. 2010;19(12):2497–506. doi: 10.1093/hmg/ddq112. [DOI] [PMC free article] [PubMed] [Google Scholar]
- Kalsi G, Prescott CA, Kendler KS, Riley BP. Unraveling the molecular mechanisms of alcohol dependence. Trends in Genetics. 2009;25(1):49–55. doi: 10.1016/j.tig.2008.10.005. [DOI] [PubMed] [Google Scholar]
- Kendler KS, Heath AC, Neale MC, Kessler RC, Eaves LJ. A population-based twin study of alcoholism in women. JAMA. 1992;268(14):1877–1882. [PubMed] [Google Scholar]
- Kendler KS, Myers J, Dick D, Prescott CA. The Relationship between Genetic Influences on Alcohol Dependence and on Patterns of Alcohol consumption. Alcohol Clin Exp Res. 2010 Apr 5; doi: 10.1111/j.1530-0277.2010.01181.x. epub ahead of print. [DOI] [PMC free article] [PubMed] [Google Scholar]
- Kendler KS, Prescott CA, Neale MC, Pedersen NC. Temperance board registration for alcohol abuse in a national sample of Swedish male twins, born 1902 to 1949. Arch Gen Psychiatry. 1997;54(2):178–184. doi: 10.1001/archpsyc.1997.01830140090015. [DOI] [PubMed] [Google Scholar]
- Kessler RC, Andrews G, Mroczek DK, Ustun B, Wittchen HU. The World Health Organization Composite International Diagnostic Interview Short Form (CIDI-SF) Int J Meth Psychiat Res. 1998a;7(4):171–185. [Google Scholar]
- Kessler RC, Wittchen HU, Abelson JM, Kendler KS, Knauper B, McGonagle KA, Schwartz N, Zhao S. Methodological studies of the Composite International Diagnostic Interview (CIDI) in the US National Comorbidity Study (NCS) International Journal of Methods in Psych Res. 1998b;7:33–55. [Google Scholar]
- Koyama S, Brodie MS, Appel SB. Ethanol inhibition of m-current and ethanol-induced direct excitation of ventral tegmental area dopamine neurons. J Neurophysiol. 2007;97(3):1977–1985. doi: 10.1152/jn.00270.2006. [DOI] [PMC free article] [PubMed] [Google Scholar]
- Kumari M, Ticku MK. Regulation of NMDA receptors by ethanol. Prog Drug Res. 2000;54:152–189. [PubMed] [Google Scholar]
- Lappalainen J, Kranzler HR, Malison R, Price LH, Van Dyck C, Rosenheck RA, Cramer J, Southwick S, Charney D, Krystal J, Gelernter J. A functional neuropeptide Y Leu7Pro polymorphism associated with alcohol dependence in a large population sample from the United States. Arch Gen Psychiatry. 2002;59(9):825–831. doi: 10.1001/archpsyc.59.9.825. [DOI] [PubMed] [Google Scholar]
- Lin JW, Wyszynski M, Madhavan R, Sealock R, Kim JU, Sheng M. Yotiao, a novel protein of neuromuscular junction and brain that interacts with specific splice variants of NMDA receptor subunit NR1. J Neurosci. 1998;18(6):2017–2027. doi: 10.1523/JNEUROSCI.18-06-02017.1998. [DOI] [PMC free article] [PubMed] [Google Scholar]
- Lind PA, Macgregor S, Vink JM, Pergadia ML, Hansell NK, de Moor MH, Smit AB, Hottenga JJ, Richter MM, Heath AC, Martin NG, Willemsen G, de Geus EJ, Vogelzangs N, Penninx BW, Whitfield JB, Montgomery GW, Boomsma DI, Madden PA. A genomewide association study of nicotine and alcohol dependence in Australian and Dutch populations. Twin Res Hum Genet. 2010;13(1):10–29. doi: 10.1375/twin.13.1.10. [DOI] [PMC free article] [PubMed] [Google Scholar]
- Luo X, Kranzler HR, Zuo L, Wang S, Schork NJ, Gelernter J. Multiple ADH genes modulate risk for drug dependence in both African- and European-Americans. Hum Mol Genet. 2007;16(4):380–390. doi: 10.1093/hmg/ddl460. [DOI] [PMC free article] [PubMed] [Google Scholar]
- Macgregor S, Lind PA, Bucholz KK, Hansell NK, Madden PA, Richter MM, Montgovery GW, Martin NG, Heath SC, Whitfield JB. Associations of ADH and ALDH2 gene variation with self report alcohol reactions, consumption and dependence: an integrated analysis. Hum Mol Genet. 2009;18(3):580–593. doi: 10.1093/hmg/ddn372. [DOI] [PMC free article] [PubMed] [Google Scholar]
- Muthen LK, Muthen BO. In: Mplus User's Guide: Fifth Edition. Muthen & Muthen, editor. Los Angeles, CA: 2007. Fifth Edition: November 2007. [Google Scholar]
- Neale MC, Eaves LJ, Kendler KS. The power of the classical twin study to resolve variation in threshold traits. Behav Genet. 1994;24(3):239–258. doi: 10.1007/BF01067191. [DOI] [PubMed] [Google Scholar]
- Nelson CB, Kessler RC, Mroczek D. Scoring the World Health Organization's Composite International Diagnostic Interview Short Form (CIDI-SF; v1.0 NOV98 for all disorders except OCD which is from v1.1 MAR99) 2001 http://www.hcp.med.harvard.edu/ncs/ftpdir/cidisf_readme.pdf.
- Nurnberger JI, Jr, Blehar MC, Kaufmann CA, York-Cooler C, Simpson SG, Harkavy-Friedman J, Severe JB, Malaspina D, Reich T. Diagnostic interview for genetic studies. Rationale, unique features, and training NIMH Genetics Initiative. Arch Gen Psychiatry. 1994;51(11):849–859. doi: 10.1001/archpsyc.1994.03950110009002. [DOI] [PubMed] [Google Scholar]
- Osier M, Pakstis AJ, Kidd JR, Lee JF, Yin SJ, Ko HC, Edenberg HJ, Lu RB, Kidd KK. Linkage disequilibrium at the ADH2 and ADH3 loci and risk of alcoholism. Am J Hum Genet. 1999;64(4):1147–1157. doi: 10.1086/302317. [DOI] [PMC free article] [PubMed] [Google Scholar]
- Pietrzykowski AZ, Martin GE, Puig SI, Knott TK, Lemos JR, Treistman SN. Alcohol tolerance in large-conductance, calcium-activated potassium channels of CNS terminals is intrinsic and includes two components: decreased ethanol potentiation and decreased channel density. J Neurosci. 2004;24(38):8322–8332. doi: 10.1523/JNEUROSCI.1536-04.2004. [DOI] [PMC free article] [PubMed] [Google Scholar]
- Prescott CA, Kendler KS. Genetic and environmental contributions to alcohol abuse and dependence in a population-based sample of male twins. AJP. 1999;156(1):34–40. doi: 10.1176/ajp.156.1.34. [DOI] [PubMed] [Google Scholar]
- Prescott CA, Sullivan PF, Kuo P, Webb BT, Vittum J, Patterson DG, Thiselton DL, Myers JM, Devitt M, Halberstadt LJ, Robinson VP, Neale MC, van den Oord E, Walsh D, Riley BP, Kendler KS. Genomewide linkage study in the Irish affected sib pair study of alcohol dependence: evidence for a susceptibility region for symptoms of alcohol dependence on chromosome 4. Mol Psychiatry. 2006;11(6):603–611. doi: 10.1038/sj.mp.4001811. [DOI] [PubMed] [Google Scholar]
- Prescott CA, Sullivan PF, Myers JM, Patterson DG, Devitt M, Halberstadt LJ, Walsh D, Kendler KS. The Irish Affected Sib Pair Study of Alcohol Dependence: study methodology and validation of diagnosis by interview and family history. Alcohol Clin Exp Res. 2005;29(3):417–429. doi: 10.1097/01.alc.0000156085.50418.07. [DOI] [PubMed] [Google Scholar]
- Purcell S, Neale B, Todd-Brown K, Thomas L, Ferreira MS, Bender D, Maller J, Sklar P, de Bakker PI, Daly MJ, Sham PC. PLINK: a tool set for whole-genome association and population-based linkage analyses. Am J Hum Genet. 2007;81(3):559–575. doi: 10.1086/519795. [DOI] [PMC free article] [PubMed] [Google Scholar]
- Purcell SM, Wray NR, Stone JL, Visscher PM, O'Donovan MC, Sullivan PF, Sklar P, Ruderfer DM, McQuillin A, Morris DW, O'Dushlaine CT, Corvin A, Holmans PA, Macgregor S, Gurling H, Blackwood DHR, Corvin A, Craddock NJ, Gill M, Hultman CM, Kirov GK, Lichtenstein P, Muir WJ, Owen MJ, Pato CN, Scolnick EM, St Clair D, Craddock NJ, Holmans PA, Williams NM, Georgieva L, Nikolov I, Norton N, Williams H, Toncheva D, Milanova V, Hultman CM, Lichtenstein P, Thelander EF, Sullivan P, Kenny E, Quinn EM, Gill M, Corvin A, Choudhury K, Datta S, Pimm J, Thirumalai S, Puri V, Krasucki R, Lawrence J, Quested D, Bass N, Crombie C, Fraser G, Kuan SL, Walker N, Blackwood DHR, Muir WJ, McGhee KA, Pickard B, Malloy P, Maclean AW, Van Beck M, Wray NR, Macgregor S, Visscher PM, Pato MT, Medeiros H, Middleton F, Carvalho C, Morley C, Fanous A, Conti D, Knowles JA, Ferreira CP, Macedo A, Azevedo MH, Kirby AN, Ferreira MAR, Daly MJ, Chambert K, Kuruvilla F, Gabriel SB, Ardlie K, Moran JL, Daly MJ, Scolnick EM. Common polygenic variation contributes to risk of schizophrenia and bipolar disorder. Nature. 2009;460(7256):748–752. doi: 10.1038/nature08185. [DOI] [PMC free article] [PubMed] [Google Scholar]
- Riley BP, Kalsi G, Kuo PH, Vladimirov V, Thiselton DL, Vittum J, Wormley B, Grotewiel MD, Patterson DG, Sullivan PF, van den Oord E, Walsh D, Kendler KS, Prescott CA. Alcohol dependence is associated with the ZNF699 gene, a human locus related to Drosophila hangover, in the Irish affected sib pair study of alcohol dependence (IASPSAD) sample. Mol Psychiatry. 2006;11:1025–1031. doi: 10.1038/sj.mp.4001891. [DOI] [PubMed] [Google Scholar]
- Ron D. Signaling cascades regulating NMDA receptor sensitivity to ethanol. Neuroscientist. 2004;10(4):325–336. doi: 10.1177/1073858404263516. [DOI] [PMC free article] [PubMed] [Google Scholar]
- Sanders AR, Duan J, Levinson DF, Shi J, He D, Hou C, Burrell GJ, Rice JP, Nertney DA, Olincy A, Rozic P, Vinogradov S, Buccola NG, Mowry BJ, Freedman R, Amin F, Black DW, Silverman JM, Byerley WF, Crowe RR, Cloninger CR, Martinez M, Gejman PV. No significant association of 14 candidate genes with schizophrenia in a large European ancestry sample: implications for psychiatric genetics. AJP. 2008;165(4):497–506. doi: 10.1176/appi.ajp.2007.07101573. [DOI] [PubMed] [Google Scholar]
- Sanders AR, Levinson DF, Duan J, Dennis JM, Li R, Kendler KS, Rice JR, Shi J, Mowry BJ, Amin F, Silverman JM, Buccola NG, Byerley WF, Black DW, Freedman R, Cloninger CR, Gejman PV. The internet-based MGS2 control sample: Self report of mental illness. AJP. 2010 June 1; doi: 10.1176/appi.ajp.2010.09071050. epublished ahead of print. [DOI] [PMC free article] [PubMed] [Google Scholar]
- Schuckit MA, Wilhelmsen K, Smith TL, Feiler HS, Lind P, Lange LA, Kalmijn J. Autosomal linkage analysis for the level of response to alcohol. Alcohol Clin Exp Res. 2005;29(11):1976–1982. doi: 10.1097/01.alc.0000187598.82921.27. [DOI] [PubMed] [Google Scholar]
- Schumann G, Johann M, Frank J, Preuss U, Dahmen N, Laucht M, Rietschel M, Rujescu D, Lourdusamy A, Clarke TK, Krause K, Dyer A, Depner M, Wellek S, Treutlein J, Szegedi A, Giegling I, Cichon S, Blomeyer D, Heinz A, Heath S, Lathrop M, Wodarz N, Soyka M, Spanagel R, Mann K. Systematic analysis of glutamatergic neurotransmission genes in alcohol dependence and adolescent risky drinking behavior. Arch Gen Psychiatry. 2008;65(7):826–838. doi: 10.1001/archpsyc.65.7.826. [DOI] [PubMed] [Google Scholar]
- Sebastiani P, Timofeev N, Dworkis DA, Perls TT, Steinberg MH. Genome-wide association studies and the genetic dissection of complex traits. American Journal of Hematology. 2009;84(8):504–515. doi: 10.1002/ajh.21440. [DOI] [PMC free article] [PubMed] [Google Scholar]
- Shi J, Levinson DF, Duan J, Sanders AR, Zheng Y, Pe'er I, Dudbridge F, Holmans PA, Whittemore AS, Mowry BJ, Olincy A, Amin F, Cloninger CR, Silverman JM, Buccola NG, Byerley WF, Black DW, Crowe RR, Oksenberg JR, Mirel DB, Kendler KS, Freedman R, Gejman PV. Common variants on chromosome 6p22.1 are associated with schizophrenia. Nature. 2009;460(7256):753–757. doi: 10.1038/nature08192. [DOI] [PMC free article] [PubMed] [Google Scholar]
- Sozio M, Crabb DW. Alcohol and lipid metabolism. Am J Physiol Endocrinol Metab. 2008;295(1):E10–E16. doi: 10.1152/ajpendo.00011.2008. [DOI] [PMC free article] [PubMed] [Google Scholar]
- Stacey D, Clarke TK, Schumann G. The genetics of alcoholism. Current Psychiatry Reports. 2009;11(5):364–369. doi: 10.1007/s11920-009-0055-4. [DOI] [PubMed] [Google Scholar]
- Steiger JH. Structural model evaluation adn modification: an interval estimation approach. Multivar Beh Res. 1990;25:173–180. doi: 10.1207/s15327906mbr2502_4. [DOI] [PubMed] [Google Scholar]
- Szumlinski KK, Ary AW, Lominac KD. Homers regulate drug-induced neuroplasticity: implications for addiction. Biochem Pharmacol. 2008;75(1):112–133. doi: 10.1016/j.bcp.2007.07.031. [DOI] [PMC free article] [PubMed] [Google Scholar]
- Treutlein J, Cichon S, Ridinger M, Wodarz N, Soyka M, Zill P, Maier W, Moessner R, Gaebel W, Dahmen N, Fehr C, Scherbaum N, Steffens M, Ludwig KU, Frank J, Wichmann HE, Schreiber S, Dragano N, Sommer WH, Leonardi-Essmann F, Lourdusamy A, Gebicke-Haerter P, Wienker TF, Sullivan PF, Nothen MM, Kiefer F, Spanagel R, Mann K, Rietschel M. Genome-wide Association Study of Alcohol Dependence. Arch Gen Psychiatry. 2009;66(7):773–784. doi: 10.1001/archgenpsychiatry.2009.83. [DOI] [PMC free article] [PubMed] [Google Scholar]
- Tsai G, Coyle JT. The role of glutamatergic neurotransmission in the pathophysiology of alcoholism. Annu Rev Med. 1998;49:173–184. doi: 10.1146/annurev.med.49.1.173. [DOI] [PubMed] [Google Scholar]
- Tucker LR, Lewis C. A reliability coefficient for maximum likelihood factor analysis. Psychometrika. 1973;38:1–10. [Google Scholar]
- Veyrieras JB, Kudaravalli S, Kim SY, Dermitzakis ET, Gilad Y, Stephens M, Pritchard JK. High-resolution mapping of expression-QTLs yields insight into human gene regulation. PLoS Genet. 2008;4(10):e1000214. doi: 10.1371/journal.pgen.1000214. [DOI] [PMC free article] [PubMed] [Google Scholar]
- Westphal RS, Tavalin SJ, Lin JW, Alto NM, Fraser ID, Langeberg LK, Sheng M, Scott JD. Regulation of NMDA receptors by an associated phosphatase-kinase signaling complex. Science. 1999;285(5424):93–96. doi: 10.1126/science.285.5424.93. [DOI] [PubMed] [Google Scholar]
- Whitfield JB. Alcohol dehydrogenase and alcohol dependence: variation in genotype- associated risk between populations. Am J Hum Genet. 2002;71(5):1247–1251. doi: 10.1086/344287. [DOI] [PMC free article] [PubMed] [Google Scholar]
- Whitfield JB, Zhu G, Madden PA, Neale MC, Heath AC, Martin NG. The genetics of alcohol intake and of alcohol dependence. Alcohol Clin Exp Res. 2004;28(8):1153–1160. doi: 10.1097/01.alc.0000134221.32773.69. [DOI] [PubMed] [Google Scholar]
- Wittchen HU. Reliability and validity studies of the WHO--Composite International Diagnostic Interview (CIDI): a critical review. J Psychiatr Res. 1994;28(1):57–84. doi: 10.1016/0022-3956(94)90036-1. [DOI] [PubMed] [Google Scholar]
- Zhang H, Kranzler HR, Weiss RD, Luo X, Brady KT, Anton RF, Farrer LA, Gelernter J. Pro-opiomelanocortin gene variation related to alcohol or drug dependence: evidence and replications across family- and population-based studies. Biol Psychiatry. 2009;66(2):128–136. doi: 10.1016/j.biopsych.2008.12.021. [DOI] [PMC free article] [PubMed] [Google Scholar]
Associated Data
This section collects any data citations, data availability statements, or supplementary materials included in this article.