

Abstract
Multipotent progenitors in the vertebrate retina often generate clonally related mixtures of excitatory and inhibitory neurons. The postmitotically expressed transcription factor, Ptf1a, is essential for all inhibitory fates in the zebrafish retina, including three types of horizontal and 28 types of amacrine cell. Here, we show that specific types of inhibitory neurons arise from the cell-autonomous influence of Ptf1a in the daughters of fate-restricted progenitors, such as Ath5 or Vsx1/2-expressing progenitors, and that in the absence of Ptf1a, cells that would have become these specific inhibitory subtypes revert to the histogenetically appropriate excitatory subtypes of the same lineage. Altered proportions of amacrine subtypes respecified by the misexpression of Ptf1a in the Ath5 lineage suggest that Ath5-expressing progenitors are biased, favoring the generation of some subtypes more than others. Yet the full array of inhibitory cell subtypes in Ath5 mutants implies the existence of Ath5-independent factors involved in inhibitory cell specification. We also show that an extrinsic negative feedback on the expression of Ptf1a provides a control mechanism by which the number of any and all types of inhibitory cells in the retina can be regulated in this lineage-dependent way.
Introduction
In the vertebrate retina, excitatory glutamatergic neurons (photoreceptors, bipolar cells, and ganglion cells), and inhibitory glycinergic and GABAergic neurons (horizontal and amacrine cells) are often both descendants of single multipotent progenitors (Turner and Cepko, 1987; Holt et al., 1988; Wetts and Fraser, 1988). Excitatory cells in zebrafish come from progenitors that express either visual homeobox transcription factor 1 (Vsx1) (bipolar cells), Vsx2 (Müller glia and bipolar cells), or the basic helix loop helix transcription factor Ath5 (ganglion cells and photoreceptors). How the lineages of the two inhibitory cell types relate to these previously identified progenitor pools is unknown. Intrinsically expressed lineage factors might be important, as previous studies in Xenopus showed that retinal descendants of specific early blastomeres are biased toward generating particular amacrine subtypes (Huang and Moody, 1995, 1997; Moody et al., 2000), and in mice all horizontal cells and at least some amacrine cells come from the Math5 lineage (Yang et al., 2003).
The pancreas transcription factor 1a (Ptf1a) plays a pivotal role in pancreas development, but is also transiently expressed after the final apical division in retinal neurons that become the many amacrine and horizontal subtypes (Jusuf and Harris, 2009). In the retina, Ptf1a knockdown causes an increase in ganglion and loss of amacrine and horizontal cells (Fujitani et al., 2006; Dullin et al., 2007; Nakhai et al., 2007). Conversely, Ptf1a overexpression generates an excess of inhibitory at the expense of excitatory neurons (Dullin et al., 2007). Thus, Ptf1a appears to function as a switch between excitatory and inhibitory fates. The clear involvement of Ptf1a in the specification inhibitory fates, however, does not explain the diversity of inhibitory subtypes. Since retinal progenitors show considerable heterogeneity in their expression of transcription factors (Trimarchi et al., 2007, 2008), we asked whether the retina generates such inhibitory subtype diversity by combining progenitor-restricted transcription factors, which influence excitatory lineages, with the expression of Ptf1a, which switches excitatory into inhibitory cells. To answer this question, we combined four-dimensional (4D) in vivo time-lapse imaging of lineages in retinas of transgenic zebrafish lines, knockdown and/or misexpression of Ptf1a and Ath5, and mosaic analysis to study the origin and lineages of different inhibitory neuron subtypes. These studies indicate that within the Ath5-positive lineage, Ptf1a autonomously specifies all horizontal cell subtypes and promotes some amacrine cell subtypes, although Ath5 is not itself a determining factor for the specification of these particular subtypes.
While intrinsic mechanisms such as lineage and transcription factors may influence the identities of distinct inhibitory subtypes, extrinsic influences are also involved in regulating the numbers of specific cell types. In the mouse, embryonic retinal progenitors, when mixed in culture with large numbers of postmitotic amacrine cells, produce significantly fewer amacrine cells than they normally would (Belliveau and Cepko, 1999). Similarly, when specific amacrine subtypes are deleted from the central retina of a growing amphibian tadpole or fish, new cells arising from the peripheral margin produce more than the usual proportion of these subtypes (Negishi et al., 1982; Reh and Tully, 1986). We show here that wild-type progenitors transplanted into Ptf1a knockdown animals have an increased probability of expressing Ptf1a. Thus, a negative feedback loop is used to control the excitatory/inhibitory balance in the retina via regulation of Ptf1a expression.
Materials and Methods
Animals.
Zebrafish were maintained and bred at 26.5°C. Embryos were raised at 28.5°C or 32°C and staged as described previously (Kimmel et al., 1995) in hours post fertilization (hpf). Embryos used for wholemount imaging were treated with 0.003% phenylthiourea (Sigma) from 11–24 hpf to delay pigment formation in the eye. All procedures were performed under the project license PL80/2198 approved by the U.K. Home Office and by the Local Ethical Review Panel at the University of Cambridge.
Seven different transgenic lines expressing red or green fluorescent proteins (dsRed, RFP, or GFP), some of which were membrane associated through a growth-associated protein (gap) peptide, under the control of different promoters were used in this study and have been described previously, as follows: Tg(ptf1a:GFP) was generated using bacterial artificial chromosome recombineering (Godinho et al., 2005) and kindly provided to us by Steven D. Leach (John Hopkins Medical Institutions, Baltimore, MD). Zebrafish transgenic lines Tg (vsx1:GFP), Tg(vsx2:GFP) and Tg(vsx2:dsRed) were kind gifts from Shin-ichi Higashijima's laboratory (Kimura et al., 2006, 2008) (National Institutes of Natural Sciences, Okazaki Institute for Integrative Bioscience, Okazaki, Japan). The Tg(ath5:gapGFP), Tg(ath5:GFP), and Tg(ath5:gapRFP) lines used here were generated previously in our laboratory (Zolessi et al., 2006). Double transgenic lines were created by crossing single transgenic lines to each other.
Morpholino injection.
Two antisense ptf1a translation-blocking morpholinos (MOs) were obtained from Gene Tools. Both have previously been used to generate Ptf1a morphants (Lin et al., 2004). MO1 was targeted against the initiation codon with the sequence 5′-CCAACACAGTGTCCATTTTTTGTGC-3′; MO2 was targeted against a region 44 bp upstream from the translational start site with the sequence 5′-TTGCCCAGTAACAACAATCGCCTAC-3′. A previously described antisense translational MO with the sequence 5′TTCATGGCTCTTCAAAAAAGTCTCC-3′was used to knockdown ath5 expression (Pittman et al., 2008). MO oligonucleotides were reconstituted as 1 mm stock solutions in water and injected into the yolk of one- or two-cell stage embryos. As shown previously, injections of 4 ng of either Ptf1a MO caused the complete loss of trypsin expression, revealing the complete loss of the exocrine pancreas (Lin et al., 2004). The ideal amount resulting in an eye phenotype was 10–12 ng for both Ptf1a MOs and 4 ng for Ath5 MO. Standard control zebrafish morpholino up to 16 ng had no effect.
Overexpression plasmid cloning.
An overexpression system was designed, in which ptf1a expression was driven by the ath5 promoter using the Gal4/UAS system. An expression cassette of Gal4VP16_UAS and a plasmid carrying the upstream activation sequence (UAS) promoter by itself were derived from an EF1α:Gal4VP16_UAS:GFP construct obtained from Köster and Fraser (2001). The 5kb ath5 promoter that drives our fluorescent reporter proteins was previously shown to recapitulate endogenous expression (Poggi et al., 2005). This promoter was excised from PUC18 plasmid using Pst1 and Swa1 and subcloned into the same sites upstream of Gal4VP16 in the Gal4VP16_UAS expression construct. Subsequently, gap43GFP was excised from a pCS2+ vector using HindIII and XhoI and blunt-end cloned into the PmeI site downstream of the UAS promoter, thus creating ath5:Gal4VP16_UAS:gapGFP.
The ptf1a gene was subcloned under the control of the UAS promoter. The ptf1a gene had been cloned into the pCS2+ vector from the original pcDNA3.1 vector using EcoR1 sites. Using the same restriction enzyme sites, ptf1a was cut out and blunt-end cloned in at the PmeI site of a plasmid containing the UAS promoter. Ten picograms of ath5:Gal4VP16_UAS:gapGFP was injected into the cell of one- or two-cell stage embryos with or without the addition of 10 or 20 pg of UAS:ptf1a plasmid.
Blastomere transplantation.
To follow single progenitors and their progeny we transplanted 10–50 cells from blastula stage embryos (GFP transgenic injected with H2B:RFP mRNA to obtain a general nuclei labeling) into the animal poles of unlabeled blastula stage embryos. Briefly, embryos were embedded in 2% methylcellulose on a coverslip, and cells were transferred from one donor to up to four hosts with a glass micropipette as described previously (Ho and Kane, 1990).
Bromo-deoxyuridine birthdating.
Sustained bromo-deoxyuridine (BrdU) labeling of transgenic embryos was performed to determine the birthdates of retinal cells. A minimum of 20 embryos was injected starting at 30 hpf, 42 hpf, 48 hpf, 54 hpf, 60 hpf, or 66 hpf. Anesthetized embryos were injected with 3 nl of 10 mm BrdU (Sigma) into the brain ventricle every 12 h to maintain BrdU availability. All embryos were fixed in 4% paraformaldehyde (PFA) in 0.1 m PB (pH 7.4) at 4°C overnight at 75 hpf.
Immunohistochemistry.
Primary antibodies used were diluted in blocking solution, as follows: mouse anti-Zn5 (University of Oregon, Portland, OR; 1:500), mouse anti-zpr1 (University of Oregon, 1:200), goat anti-GFP–FITC conjugated (Abcam, ab6662; 1:500), rabbit anti-PKCβ1 (Santa Cruz Biotechnology s.c.-209 1:100), rabbit anti-calretinin (Millipore Bioscience Research Reagents AB5054, 1:1000), rabbit anti-Sox2 (Millipore Bioscience Research Reagents AB5603, 1:200), mouse anti-5E11 (kind gift from Associate Professor James M. Fadool, Florida State University, Tallahassee, FL; 1:50), mouse anti-parvalbumin (Millipore Bioscience Research Reagents MAB1572, 1:1000), rabbit anti-Hermes (kind gift from Associate Professor Malgorzata Kloc, University of Texas, Austin, TX; 1:400), rabbit anti-prox1 (Millipore Bioscience Research Reagents AB5475, 1:200), rabbit anti-GABA (Sigma A2052, 1:500), rabbit anti-glycine (Millipore Bioscience Research Reagents, AB137, 1:200), rat anti-BrdU (abcam6326, 1:100), and rabbit anti-activated caspase 3 (BD Biosciences, 559565 clone C92–605, 1:500).
Secondary antibodies used were goat or donkey anti-mouse, anti-rabbit, or anti-goat IgG conjugated to Alexa 488, 594, or 647 fluorophores (1:1000–1:2000 dilution in blocking solution, Invitrogen). For one birthdating experiment, BrdU was visualized using anti-rat biotin (1:200) diluted in PBS followed by Neutravidin Alexa 350 (1:200) diluted in PBS.
For most antibodies, wholemount zebrafish embryos were fixed with 4% PFA in 0.1 m PB overnight at 4°C, rinsed, cryoprotected in 30% sucrose, embedded in OCT Tissue-Tek medium, and cryosectioned at 14 μm thickness. For GABA and glycine immunohistochemistry, embryos were anesthetized with 0.4 mg/ml MS222 and aligned onto a slide. The head was cut off using a razor blade to allow better fixative penetration and embryo heads were immediately immersion fixed in 2% paraformaldehyde/2% glutaraldehyde in 0.1 m PB for 2 d. These embryos were embedded in LRW resin (Skepper, 2000). Sections were cut at 0.5–1 μm thickness on an Ultracut E microtome (Reichert Microscope Service) and dried on a heatblock.
For wholemount antibody staining, embryos were permeabilized by incubation in 0.25% trypsin-EDTA in Hanks balanced salt solution for 15–25 min on ice.
All immunohistochemistry-staining steps are performed at room temperature unless stated otherwise. For BrdU experiments, sections were either treated with 100% methanol for 10 min and 2N HCl for 10 min, or antigen retrieval was performed by immersing sections in 0.01 m sodium citrate buffer, pH6.0 at 95°C for 10 min before blocking. For Sox2 immunohistochemistry, antigen retrieval was similarly performed. For GABA and glycine immunohistochemistry, sections were treated with 0.1% NaBH4 in PBST for 10 min before blocking.
For immunolabeling, sections were incubated in blocking solution (10% heat-inactivated goat serum, 1% bovine serum albumin, 0.2% Triton X-100 in PBS) for 30 min (sections) or 60 min (wholemounts). Sections were incubated in primary antibodies overnight and secondary antibodies for 60 min. Wholemounts were incubated in primary antibodies for 4–7 d at 4°C and secondary antibodies overnight. Nuclei were counterstained with 4′,6-diamidino-2-phenylindole (DAPI). Sections were mounted with Fluorosave (Calbiochem, Merck Chemicals).
Wholemount in situ hybridization.
In situ RNA hybridization was performed as previously described (Lin et al., 2004).
A trypsin zebrafish gene IMAGE clone (ID 8811391) in a pExpress1 vector was obtained from Geneservice. After sequencing to confirm the gene sequence, antisense and sense control digoxigenin-labeled riboprobes were generated directly from the image clone. For antisense, plasmid was linearized with NotI and transcribed with SP6; for sense probe, plasmid was linearized with EcoR1 and transcribed with T7.
Embryos underwent a stepwise dehydration series into 100% methanol and subsequent rehydration into 0.1% Tween in PBS. Permeabilization was achieved using age-dependent concentrations of proteinase K treatment for 25 min at room temperature, followed by postfixation in 4% PFA in PBS. After prehybridization, riboprobe hybridization was performed overnight at 68°C. Hybridized probes were detected with nitroblue tetrazolium chloride/5-bromo-4-chloro-3-indolyl-phosphate, toluidine salt (NBT/BCIP BM Purple, Roche Products).
Imaging of fixed samples and live wholemount embryos.
Whole or partial embryo images were acquired on a dissecting stereo microscope equipped with epi-fluorescence (Leica MZ FLIII). Photomicrography of wholemount eyes or sections was performed with either a laser confocal system [Leica TCS-NT confocal laser-scanning microscope using a Leica 40×, 1.2 numerical aperture (NA) or Leica 63×, 1.2 NA water-immersion objectives] or with Nikon fluorescence microscopes, equipped with cooled charge-coupled device Hamamatsu Orca cameras and automated z-drive and fluorescence shutters. At the confocal microscope a 405 nm laser line (DAPI), a 488 nm argon laser line (GFP or Alexa 488 fluorophore), a 568 nm laser line (RFP or DsRed), a 594 nm laser line (Alexa 594 fluorophore), and a 633 nm laser line (Alexa 647 fluorophore) were used. Images were taken through wholemount fixed embryos and 4D live embryos as described previously (Poggi et al., 2005). Briefly, emission was detected using individual descanned photomultiplier tube detectors. Optical sections (40 μm in timelapse and up to 100 μm in fixed embryos) of 1 μm thickness were taken through the eye and Kalmann averaged two or four times. Stacks in the timelapse were taken every 6 or 10 min on average for 24–42 h. For this laser power was minimized to avoid bleaching and phototoxicity. Image data were acquired using Leica confocal software and processed and analyzed using Volocity (Improvision). Brightness and contrast were adjusted with Adobe Photoshop.
Analysis.
Number of embryos used for each analysis has been indicated in the relevant Results sections.
Total cell number progression was quantified in sections of different staged embryos (36 hpf, 42 hpf, 48 hpf, 55 hpf, 60 hpf, 66 hpf, 72 hpf) by counting DAPI-positive somas of sections adjacent to the section containing the optic nerve. Individual photoreceptors could no longer be distinguished after 55 hpf and were not counted in older embryos.
Apoptosis was quantified using caspase 3 immunohistochemistry (cells per embryo). Embryos in which individual sections were lost during processing were excluded.
Neuronal types were categorized according to cell location and morphology. The region was defined by drawing a straight line through the center of the lens just central to the ciliary margin as described previously (Holt et al., 1988). The half covering the retina was further subdivided with three rays from the center of the lens extending at 45° angles to each other. Cells in the central two of the resulting four sectors were quantified manually.
Immunohistochemical counts were similarly performed manually in the central sectors of the retina.
Quantification of changes in the number of cells marked by Vsx1:GFP or Ath5:GFP transgenes in morphants were analyzed in 62 μm wide strips with 1–7 analyzed sections from central retinal regions averaged per eye to provide one value per embryo.
Subtypes of amacrine cells were classified using morphological features. The stratification (depth and breadth) and extent of dendritic arbor (width) was used to distinguish different amacrine cell subtypes as described previously (Jusuf and Harris, 2009). Cells were only analyzed if they were separated unambiguously in x, y, and/or z dimension from other labeled cells.
Statistical analysis.
A number of different statistical tests were chosen to minimize assumptions (two-tailed and no assumptions about distribution) and performed using Instat software. The Kruskal–Wallis test with Dunn pairwise comparison was used to compare the number of apoptotic cells and total number of cells in wild type (WT) versus MO2 knockdown. The Mann-–Whitney test was used to compare the frequency of subtypes of neurons in the WT versus MO1 knockdown, for comparing the immunohistochemically labeled amacrine subtype losses in WT versus MO2 knockdown, for comparing the frequency of cell types in WT versus MO2 transplantations, as well as for comparing Vsx1- or Ath5-labeled excitatory neurons in WT versus MO2. The binomial test was used for experiments in which the number of cells analyzed per eye were too few, for meaningful comparison of mean frequency, as follows: (1) comparing cell fate changes in overexpression experiments; (2) comparing each subtype frequency between wild type, Ath5-positive (Ath5+) lineage, and ptf1a misexpression in the Ath5+ lineage; (3) and comparing the effect of the extrinsic environment on ptf1a expression and amacrine subtype composition in WT cells transplanted into Ptf1a morphant hosts. The population of subtypes arising from wild type, Ath5+ lineage, and ptf1a misexpression in the Ath5+ lineage were also compared using the Fisher's exact test (run 10× and p values averaged).
Results
Lineage origins of inhibitory cells in the retina
In the zebrafish retina, Ptf1a is briefly expressed just after the terminal mitosis of progenitor cells in all developing inhibitory neurons including all the subtypes of horizontal and amacrine cells (Jusuf and Harris, 2009). To begin to investigate whether lineage plays a role in inhibitory cell subtype specification, we first asked whether Ptf1a is turned on in the daughters of progenitors with distinct lineage restrictions, such as Ath5+ and Ath5-negative (Ath5−) progenitors. Initially all progenitors express Vsx2, but then most of these cells turn off Vsx2 and express other transcription factors such as Vsx1 and Ath5 (Vitorino et al., 2009). Thus, many of the Ath5− progenitors express Vsx2, and no Vsx2-expressing progenitor is strongly Ath5+. Ath5+ progenitors in zebrafish are known to give rise to all retinal ganglion cells (RGCs), some amacrine cells, at least some horizontal cells, and most if not all photoreceptors (Poggi et al., 2005), whereas progenitors that express Vsx1+ or Vsx2+ and are Ath5− give rise to bipolar cells, Müller cells, and some amacrine cells (Vitorino et al., 2009). Therefore, we separately crossed ath5:gapRFP and vsx2:dsRed transgenic lines with a ptf1a:GFP transgenic line. Four-dimensional time-lapse movies of Tg(ath5:gapRFP/ptf1a:GFP) or Tg(vsx2:dsRed/ptf1a:GFP) lines showed that 70.75 ± 13.45% SD of Ptf1a:GFP cells originate from Ath5:gapRFP progenitors (Fig. 1B) (n = 9 embryos, 531 cells), while 39.83 ± 8.61% SD of Ptf1a:GFP cells originate directly from progenitors that still express Vsx2:dsRed (Fig. 1A) (n = 7 embryos, 310 cells), showing that Ptf1a is expressed in the daughters of each of these two distinct lineages (Fig. 1A,B; supplemental Movies 1, 2, available at www.jneurosci.org as supplemental material).
Figure 1.

Lineage origin of inhibitory cell types. Relationship of ptf1a expression in cells from different lineages expressing either vsx2 or ath5. A, B, Micrographs from time-lapse movies (see supplemental Movies 1 and 2, available at www.jneurosci.org as supplemental material) of double transgenic zebrafish lines Tg(vsx2:dsRed/ptf1a:GFP) or Tg(ath5:gapRFP/ptf1a:GFP). Green channel shown in left panels, red in middle, and merged images in right panels. Ptf1a:GFP cells either coexpress (asterisks) Vsx2:dsRed (A) or Ath5:gapRFP (B) or turn on in cells that do not express the red reporter protein (blue circles). C–E, Micrographs of fixed 120 hpf retinas, showing that horizontal cells derive exclusively from the Ath5+ lineage. Ptf1a:GFP horizontal cells colabel with the membrane marker Ath5:gapRFP cells (C–C″, asterisks). The pan-horizontal marker Prox1 colabels (asterisks) with Ptf1a:GFP (D–D″) and Ath5:gapGFP (E–E″). Scale bars: (in B″) A–B″, 10 μm; (in E″) C–E″, 5 μm.
Even though ath5 mRNA is only transiently expressed, Ath5:gapRFP remains visible in both postmitotic daughters of Ath5+ progenitors until these cells begin to differentiate as specific cell types. The fact that Ptf1a is turned on in cells arising from both Ath5+ and Vsx2+/Ath5− progenitors presented us with the opportunity to ask whether Ptf1a drives distinct inhibitory subtype fates in these two lineage-restricted progenitors. We first looked at horizontal cells in double transgenic Tg(ath5:gapRFP/pf1a:GFP) embryos. We were amazed to find that virtually all (98.4 ± 2.0% SD, n = 7 embryos, 221 cells) GFP horizontal cells were also positive for the membrane RFP, which labels the somas as well as dendrites (Fig. 1C, bright staining above the row of horizontal cell somas). Consistent with this observation, 99.0 ± 1.6% SD (n = 6 embryos, 280 cells) of Ptf1a:GFP cells in the horizontal cell layer can also be labeled with the horizontal cell marker, Prox1 (Fig. 1D), and 95.4 ± 3.5% SD (n = 13 embryos, 554 cells) of Prox1+ horizontal cells are also Ath5:gapGFP+ (Fig. 1E). This result is in agreement with previous data in mouse using Cre-LoxP system to turn on a permanent lineage tracer in Math5+ progenitors (Yang et al., 2003), showing that virtually all horizontal cells can come from Ath5+ progenitors.
Although all horizontal cells were Ath5+, the converse is not the case, i.e., not all double labeled cells are horizontal cells. Many Ath5:gapRFP/Ptf1a:GFP cells became amacrine cells. Therefore, we asked whether distinct subtypes of amacrine cells arise from Ath5− versus Ath5+ progenitors. Using amacrine subtype markers, we found that 41.7% of calretinin (n = 14 embryos) positive amacrine cells were strongly Ath5+. In contrast, only 4.5% of parvalbumin (PV; n = 8 embryos) expressing amacrines and only 5.7% of Sox2 (n = 7 embryos) expressing amacrine cells in the inner nuclear layer (INL) came from Ath5+ progenitors. Similarly in the ganglion cell layer, only 5.8% of PV (n = 8 embryos) or 14.8% of Sox2 (n = 7 embryos) labeled displaced amacrine cells showed strong Ath5:GFP expression (data not shown). These results suggest that certain subtypes of amacrine cells are biased to arise from Ath5+ progenitors, whereas others preferentially arise from Ath5− progenitors.
To break down the amacrine subtypes that arise from Ath5+ versus Ath5− lineages more comprehensively, a morphometric analysis was performed on the subtypes of amacrine cells that arose from the Ath5+ lineage (Jusuf and Harris, 2009). ath5:GFP or ath5:Gal4VP16_UAS:gapGFP DNA was injected into one- or two-cell stage embryos to create mosaic retinas, in which single amacrine cells derived from Ath5+ progenitors could be viewed in isolation. In retinas with few GFP-expressing cells, it was sometimes possible to find an amacrine cell whose dendritic arbours were unobscured by other GFP-expressing cells. The frequency of displaced amacrine cells is biased against in this sample, as it is more difficult to find isolated examples due to the presence of intermingled ganglion cells, and these were thus not compared here. Using this morphological classification strategy, we were able to classify a total of 124 individual amacrine cells. Many of the 25 morphologically identified zebrafish subtypes of amacrine cells in the INL were encountered in this sample (Fig. 2; supplemental Fig. 1, available at www.jneurosci.org as supplemental material). The frequency of each subtype arising from Ath5+ progenitors was compared with the expected frequency of this subtype when considering all of the amacrine subtypes (Jusuf and Harris, 2009), and the two populations were significantly different (p = 0.006) For these and other experiments where we compare frequencies of subtypes of amacrine cells, we used the Fisher exact test, which reaches statistical significance if there are experimentally relevant differences among several subtypes within the compared populations. Eight amacrine subtypes were under-represented (Fig. 2, red somas; Table 1) (one significantly at p < 0.05, binomial test) and five were overrepresented (Fig. 2, green somas; Table 1) (two significantly, p < 0.05, binomial test) by at least a factor of two. Thus, the morphometric and the immunohistochemical data independently suggest that certain subtypes of amacrine cells preferentially arise from Ath5+ progenitors.
Figure 2.

Amacrine cell subtypes arising from the Ath5+ lineage. Cells arising from the Ath5+ lineage give rise to distinct subtypes. A, B, Examples of individual amacrine cells arising from the Ath5+ lineage. C–E, Schematic comparison of frequencies of different subtypes of amacrine cells arising from the Ath5+ lineage compared with the frequency of all amacrine subtypes found in the wild type. Frequencies that occurred at more than double than expected are color coded green and those occurring at less than half of the expected frequency are color coded in red. Asterisks show significant difference in frequency. GCL, Ganglion cell layer; NF, narrow-field; WF, wide-field; S, stratum. Scale bars: (in A) A, B, 20 μm; (in E) C–E, 10 μm.
Table 1.
Amacrine subtypes from Ath5 + and Ath5 + lineage misexpressing Ptf1a
| No. (%) of cells |
|||
|---|---|---|---|
| All amacrine types | Ath5 + lineage | Ath5 + with Ptf1a | |
| Narrow-field amacrine cell type | |||
| Smooth 1 | 7 (5.0%) | 5 (4.0%) | 5 (3.6%) |
| Smooth 2 | 13 (9.2%) | 0 (0%)*a | 2 (1.4%)*a |
| Smooth OFF | 11 (7.8%) | 8 (6.5%) | 13 (9.4%) |
| Smooth ON/OFF | 11 (7.8%) | 6 (4.8%) | 19 (13.8%) |
| Varicose 1 | 8 (5.7%) | 18 (14.5%)*b | 7 (5.1%) |
| Varicose 2 | 9 (6.4%) | 10 (8.1%) | 3 (2.2%)*a |
| Varicose 3 | 8 (5.7%) | 3 (2.4%)a | 1 (0.7%)*a |
| Varicose 4 | 4 (2.8%) | 1 (0.8%)a | 1 (0.7%)a |
| Varicose OFF | 11 (7.8%) | 23 (18.5%)*b | 17 (12.3%) |
| Varicose ON/OFF | 6 (4.3%) | 7 (5.6%) | 13 (9.4%)*b |
| Varicose spidery OFF | 7 (5.0%) | 5 (4.0%) | 6 (4.3%) |
| Varicose spidery ON/OFF | 8 (5.7%) | 6 (4.8%) | 7 (5.1%) |
| Total narrow-field cells | 103 | 92 | 94 |
| Medium-field amacrine cell type | |||
| Smooth 1 | 2 (1.4%) | 2 (1.6%) | 0 (0.0%)a |
| Smooth 3/4 | 4 (2.8%) | 1 (0.8%)a | 3 (2.2%) |
| Varicose 1 | 4 (2.8%) | 6 (4.8%) | 5 (3.6%) |
| Varicose OFF | 2 (1.4%) | 6 (4.8%)b | 5 (3.6%)b |
| Varicose ON | 2 (1.4%) | 2 (1.6%) | 5 (3.6%)b |
| Total medium-field cells | 14 | 17 | 18 |
| Wide-field amacrine cell type | |||
| Smooth 2 | 3 (2.1%) | 2 (1.6%) | 7 (5.1%)b |
| Smooth 3/4 | 2 (1.4%) | 4 (3.2%)b | 2 (1.4%) |
| Smooth OFF | 2 (1.4%) | 4 (3.2%)b | 2 (1.4%)b |
| Varicose 2 | 4 (2.8%) | 1 (0.8%)a | 1 (0.7%)a |
| Varicose 3 | 3 (2.1%) | 0 (0%)a | 7 (5.1%)b |
| Varicose OFF | 5 (3.5%) | 2 (1.6%)a | 2 (1.4%)a |
| Varicose ON | 3 (2.1%) | 0 (0.0%)a | 3 (2.2%) |
| Varicose ON/OFF bistratified | 2 (1.4%) | 2 (1.6%) | 2 (1.4%) |
| Total wide-field cells | 24 | 15 | 26 |
| Total inner nuclear layer amacrine cells | 141 | 124 | 138 |
Number and percentage of each subtype is shown. WT data are from the study by Jusuf and Harris (2009). No., Number. Statistically significant at *p < 0.005.
aSubtypes that are underrepresented by at least a factor of two. Bold represents the five subtypes that are underrepresented in both lineages.
bSubtypes that are overrepresented by at least a factor of two.
Lineage-specific fate switches when the inhibitory cell fate is abolished
Using the Tg(ptf1a:GFP) line, we studied how the lineage relationship we uncovered in the wild-type retina would contribute to fate decisions if we removed inhibitory neurons. In other words, would the cells that normally express Ptf1a to become specific types of inhibitory neurons, depending on their lineage, revert to the lineage-restricted excitatory fate in the absence of Ptf1a? We used antisense morpholinos to deplete Ptf1a. Two previously published morpholinos (Lin et al., 2004) were used to inhibit the translation of Ptf1a protein either by blocking at the initiation codon (MO1) or upstream from the translational start site (MO2). Since MO1 blocks Ptf1a, but not the ptf1a:GFP transgene translation, it was used to follow the fates of cells that could no longer generate Ptf1a protein. While injections of control MOs had no effect on the morphology or location of Ptf1a:GFP cells (Fig. 3A), knockdown using 12 ng of ptf1a MO1 resulted in a loss of GFP+ cells from the expected horizontal and amacrine cell layers (Fig. 3B). By 120 hpf, GFP+ cells in these inhibitory layers were found next to the ciliary margin, suggesting that by these later stages, the morpholino was too dilute to block Ptf1a expression, and that new inhibitory cells could be generated from the ciliary margins. Therefore, in this and subsequent experiments using morpholinos, we restricted our quantification of fate changes to the central half of the retina.
Figure 3.

Loss of inhibitory neurons by cell-autonomous Ptf1a MO knockdown causes specific fate respecification phenotype. A–D, Micrographs through sections of 120 hpf Tg(ptf1a:GFP) embryos injected with control MO (A, D) or Ptf1a translation MO1 (B, C) with insets magnified (A′, B′). A, B, Counterstained with DAPI. As in wild type, Ptf1a:GFP is expressed exclusively in the horizontal and amacrine cells in control MO-injected embryos (A). In the knockdown, some Ptf1a:GFP cells take on the location and morphology of photoreceptors, bipolar cells and ganglion cells (B). C, D, In the knockdown (D), Ptf1a:GFP-labeled ganglion cell axons form part of the optic nerve and project out of the optic nerve head (arrow) and through the optic chiasm (arrowhead), whereas in control (C) injected embryos, ganglion cells and their axons are never Ptf1a:GFP labeled. E, F, Percentage of cell types expressing Ptf1a:GFP in the wild-type versus knockdown condition. Immunohistochemical markers were used to distinguish displaced amacrine cells from ganglion cells in the ganglion cell layer (F). In Ptf1a morphants horizontal and amacrine cells are lost, while there is an increase in photoreceptor, bipolar, and ganglion cells. Error bars indicate SEM. *p < 0.05; ***p < 0.001. G, H, Loss of Ptf1a in the morphants results in an increased number of Ath5:GFP-labeled cells specifically in the ganglion cell layer (G) and Vsx1:GFP-labeled cells specifically in the bipolar layer (INL, H). Average number of cells per analyzed area is indicated. PR, Photoreceptor; HC, horizontal cell; BC, bipolar cell; AC, amacrine cell; GC, ganglion cell; ONL, outer nuclear layer; OPL, outer plexiform layer; INL, inner nuclear layer; IPL, inner plexiform layer; GCL, ganglion cell layer. Scale bars: (in B) A, B, 50 μm; (in B′) A′, B′, 25 μm; (in C) C, D, 50 μm, (in H) G, H, 25 μm.
If these cells had moved too far toward inhibitory fates, they may have lost their competence for alternate fates, and so undergone apoptosis. We therefore tested for contribution of cell death to the morphant phenotype, first by checking for apoptosis using caspase 3 labeling. The number of caspase-3-labeled cells was quantified at different ages between 36 hpf and 72 hpf (n = 6–11 embryos per condition). We found no significant differences between control and morphant embryos at any time point, indicating that Ptf1a morpholino does not cause increased apoptosis (supplemental Fig. 2A, available at www.jneurosci.org as supplemental material). Similarly, we quantified the total number of DAPI-labeled cell nuclei in the retinas of embryos at different ages between 36 hpf and 72 hpf (n = 6–12 embryos per condition). Consistently, these experiments also revealed no significant difference between control and morphant embryos (supplemental Fig. 2B, available at www.jneurosci.org as supplemental material). These analyses rule out cell death as a major cause for the loss of the horizontal and amacrine cells in Ptf1a morphants.
We found instead that the laminar location and general morphology of Ptf1a:GFP cells in the Ptf1a morphants, which would normally have become amacrine and horizontal cells, were respecified into excitatory cell types, such as photoreceptors, bipolar, and ganglion cells (Fig. 3B). Quantification of these fate changes (n = 68 control embryos and 201 morphant embryos) (Fig. 3E) revealed a statistically significant loss (p < 0.0001) of Ptf1a:GFP+ horizontal and amacrine cells, and a statistically significant increase in Ptf1a:GFP+ photoreceptors and bipolar cells (p < 0.0001) and ganglion cell layer (p = 0.032). Quantification of cell-type changes within the ganglion cell layer, which contains ganglion cells and displaced amacrine cells, showed a highly significant increase in the proportion of ganglion cells (Fig. 3F) (p < 0.0001 when using either Hermes or Sox2 to distinguish these populations, n = 31 control and 32 morphant embryos). Further evidence for the respecification of some Ptf1a:GFP cells into ganglion cells is demonstrated by the finding that in Ptf1a MO1, but not control embryos, Ptf1a:GFP-labeled ganglion cell axons are seen in the optic nerve, chiasm, and tract leading to the optic tectum (Fig. 3C,D).
As an additional confirmation of the cell-type identity of these respecified Ptf1a:GFP cells, we sought to see whether GFP+ cells in these ectopic layers expressed the appropriate excitatory cell markers. We have previously shown that in wild-type retinas, inhibitory Ptf1a:GFP cells do not colabel with any of the excitatory markers (Jusuf and Harris, 2009). In Ptf1a morphants, however, Ptf1a:GFP cells colabeled with Zpr1 (cone), PKC (bipolar cell), and Hermes (pan-ganglion cell) markers (Piri et al., 2006) (Figs. 3F, 4). Moreover, respecified Ptf1a:GFP cells no longer expressed the inhibitory markers Prox 1 (horizontal cells, data not shown) and 5E11 (amacrine cells, data not shown). Thus, there is clearly a switch in cellular fates of Ptf1a:GFP cells from inhibitory to excitatory cell types in the retinas of morphant embryos.
Figure 4.

Respecified Ptf1a:GFP cells in the knockdown are excitatory. The respecified Ptf1a:GFP cells found in ectopic layers in the morphants express the layer-appropriate immunohistochemical markers of different excitatory neuron types. A–C, Micrographs show Ptf1a:GFP cells that have taken up the morphology and location of excitatory neuron types in the knockdown condition. Insets (green and red channels shown separately and then as double) show cells that colabel (asterisks) with markers for double cones (Zpr1, A), bipolar cells (PKCβ, B), and ganglion cells (Hermes, C). ONL, Outer nuclear layer; OPL, outer plexiform layer; IPL, inner plexiform layer; GCL, ganglion cell layer. Scale bars: 10 μm; insets, 10 μm.
In the central retinas of MO1 morphants, there was not a complete loss of horizontal and amacrine cells. A limited number of Ptf1a:GFP cells remained in the horizontal and amacrine appropriate layers, and these cells, when examined, expressed markers appropriate for these cell types. The translation-blocking morpholino MO2 shows a stronger phenotype, and in the central retinas of MO2 morphants, Prox-1-labeled horizontal cells were completely absent from the central retina. In most MO2 morphants, however, we found at least a few cells remaining in the amacrine cell layer that colabeled with amacrine markers. The simplest explanation for the maintenance of some bonafide amacrine cells in these retinas is that even MO2 was not 100% efficient, as we found no evidence that MO2 spared any particular immunohistochemical type of amacrine cell or that the remaining cells were qualitatively different in terms of their anatomical features (see supplemental text and supplemental Fig. 3, available at www.jneurosci.org as supplemental material).
The results above show that Ptf1a is essential in all lineages to establish the full repertoire of inhibitory cell subtypes in the retina, but we would also like to know what happens in specific lineages when Ptf1a activity is reduced. Do cells in these lineages that normally express Ptf1a revert to the excitatory cell phenotypes within their lineages, or do they tend to become other types of excitatory cells? To answer this question, we used Ptf1a MO2 injections to knock down Ptf1a in embryos from Tg(ath5:GFP) or Tg(vsx1:GFP) and quantified the number of GFP+ cells. We found an increase in the number of Ath5:GFP-labeled cells specifically in the ganglion cell layer from 23.4 ± 1.42 SEM WT [n = 26 strips (62 μm) averaged for 11 eyes, 602 cells] to 26.5 ± 1.12 SEM morphant [n = 43 strips (62 μm) averaged for 22 eyes, 1259 cells, p = 0.026] (Fig. 3G). Similarly, in Tg(vsx1:GFP) embryos, there is a clear increase in the number of bipolar cells from 33.6 ± 0.4 SEM WT [n = 91 strips (62 μm) averaged for 18 eyes, 3093 cells] to 41.0 ± 1.2 SEM morphant [n = 67 strips (62 μm) averaged for 18 eyes, 2808 cells, p < 0.0001] (Fig. 3H). When combined with the results above, we can conclude that Pft1a normally acts to switch the excitatory fates to inhibitory cell types within particular lineages.
Ptf1a acts cell autonomously
As Ptf1a is a transcription factor and acts as a switch to toggle between specific subtypes of inhibitory and specific subtypes in Ath5+ or Ath5−/Vsx2+ descendants, the likelihood is that it acts cell-autonomously. To test whether normal autonomous expression of Ptf1a within neurons arising from the Ath5+ lineage is essential for horizontal fates, we transplanted cells from Ptf1a morphant embryos into wild-type hosts, resulting in a mosaic retina consisting mainly of wild-type cells.
Donor cells had fluorescent red nuclei (H2B:RFP RNA), and the subset of those that expressed Ath5 also had fluorescent green membranes. In the experimental condition, donor embryos were additionally injected with Ptf1a MO2. Cells from both control and experimental groups were transplanted into unlabeled WT host embryos at the blastula stage. Mosaic embryos were grown until 5 dpf, when differentiated cell types could be unambiguously identified by their somal shape and laminar location. The H2B:RFP+ transplanted cells in the control condition gave rise to all types of retinal neurons in approximately normal proportions (Fig. 5A). As expected, in clones transplanted from donors that were Ath5:GFP positive, the great majority of the transplanted ganglion cell and horizontal cells were additionally indeed positive for Ath5:GFP (Fig. 5A–A‴). When Ptf1a morphant cells were transplanted into the WT embryos, however, we found a drastic decrease (Fig. 5B–D) in the percentage of transplanted cells (H2B:RFP) that become horizontal cells (from 7.4 ± 0.9% SEM, WT donors, n = 44 embryos, to 0.8 ± 0.3% SEM, Ptf1a morphant donors, n = 43 embryos; p < 0.0001). There was also a significant decrease in amacrine cells (19.2 ± 1.1 SEM, WT donor vs 10.5 ± 2.7% SEM, Ptf1a morphant donor; p < 0.0001). Concomitantly, we observed a significant increase (Fig. 5D) in the proportion of transplanted cells that became excitatory photoreceptors, bipolar and ganglion cells (73.5 ± 1.26% SEM WT donor vs 88.6 ± 2.7% SEM Ptf1a morphant donor, p < 0.0001), with each main excitatory cell type showing a small increase (Fig. 5D). When we looked at those donor clones (H2B:RFP) that also clearly expressed Ath5:GFP, we observed primarily photoreceptors and ganglion cells but not bipolars, as expected (Fig. 5B). Since the host retina was full of normal Ptf1a-expressing cells, these experiments indicate that the normal expression of Ptf1a in cells of the Ath5+ lineage is autonomously essential for the generation of horizontal cells and amacrine cells.
Figure 5.
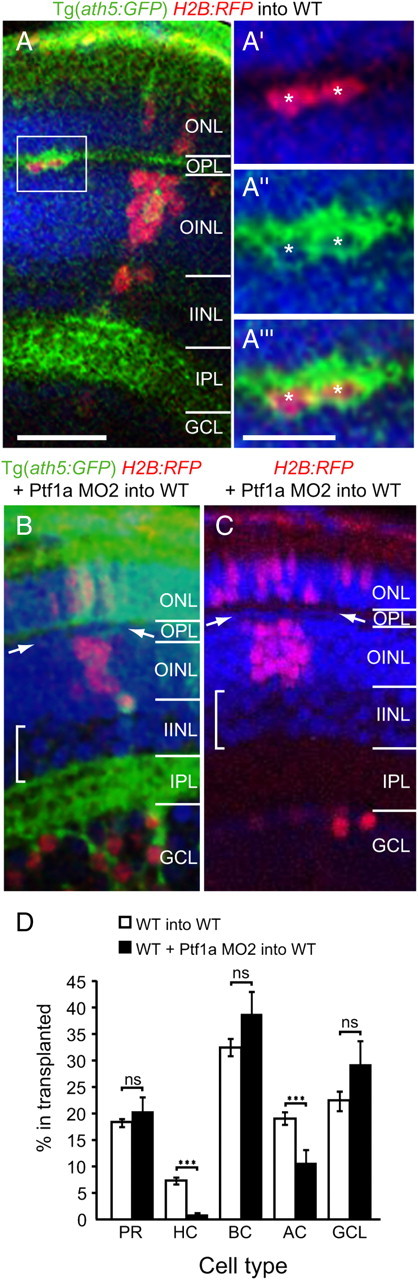
Cell-autonomous expression of Ptf1a is required for inhibitory cell fates. In addition to the necessity of cell-autonomous Ptf1a expression for all inhibitory fates, these transplantations of H2B:RFP cells from Ath5:GFP donor embryos into unlabeled WT hosts reveals the necessity of Ptf1a within the Ath5+ lineage to generate horizontal cells. A–A″, Micrographs of 120 hpf retinas shows that transplanted cells give rise to retinal cells in all layers. Those that become horizontal cells are also Ath5:GFP+ (A). Inset shows transplanted horizontal cells marked by asterisks. B, C, Transplanted cells (H2B:RFP) from Ptf1a MO2-coinjected donors no longer give rise to horizontal cells (DAPI+ row of cells between the two arrowheads) and only few amacrine cells (square bracket in inner INL). Cells from Ath5:GFP donors reveal that Ath5: GFP label primarily in transplanted photoreceptors and ganglion cells (C). D, Quantification of the percentage of transplanted cells giving rise to different cell types. Analysis includes embryos in which the Ath5:GFP transgene expressed in the chimera (B), as well as those from donors without the strong Ath5:GFP expression (C). There was a drastic loss in horizontal and amacrine cells from Ptf1a MO2-injected donors and a small gain in all excitatory cell types. ns, Not significant; PR, photoreceptor; HC, horizontal cell; BC, bipolar cell; AC, amacrine cell; GC, ganglion cell; ONL, outer nuclear layer; OPL, outer plexiform layer; OINL, outer half of inner nuclear layer; IINL, inner half of inner nuclear layer; IPL, inner plexiform layer; GCL, ganglion cell layer. Error bars indicate SEM. ***p < 0.001. Scale bars: (in A) A–C, 25 μm; (in A‴) A′–A‴, 5 μm.
Respecified cells are born in the normal temporal order
Having established that knocking down Ptf1a switches the fate of specific inhibitory neuron subtypes to their lineage-related excitatory neurons, we investigated the histogenetic consequences of this fate switch. Since Ptf1a is expressed only after terminal progenitor division (Jusuf and Harris, 2009), we asked whether the birthdates of the respecified excitatory Ptf1a:GFP were the same as those of the inhibitory Ptf1a:GFP cells in wild type. If so, this would imply that the respecification into alternate fates occurred after these cells were born; as opposed to the possibility, for example, that cells previously destined to become inhibitory, reenter the cell cycle when Ptf1a is knocked down and are respecified into excitatory fates with later birthdates. In either case, it is unclear whether the respecified excitatory cells in the Ptf1a morphants could be born in the appropriate histogenetic birthtime of the normal excitatory cell types that usually arise from these lineages (Nawrocki, 1985; Hu and Easter, 1999).
To investigate these issues, we compared the birthdates of the respecified Ptf1a:GFP cells in the morphants with respect to each other and with respect to the birthdates of the inhibitory Ptf1a:GFP cells in control retinas. BrdU injections (performed every 12 h until 66 hpf) were started at different developmental time points (from 30 hpf onwards) allowing us to distinguish BrdU- cells (born before the first BrdU injection) (Fig. 6A, white circles) or BrdU+ cells (born after the first BrdU injection) (Fig. 6A, black asterisks). These experiments revealed that GFP+ respecified cells in the morphants were born at similar developmental times and rates as GFP+ horizontal and amacrine in the controls (Fig. 6B) (n = 5 embryos per condition, WT: 538–858 cells, MO: 94–158 cells). This is consistent with the first hypothesis, and suggests that cells become respecified without reentering the cell cycle. What we found really interesting, however, was that our birthdating also demonstrated that respecified excitatory cells in the Ptf1a morphants were born in the appropriate histogenetic times described for the distinct excitatory cell types in the normal animals (Fig. 6C) (n = 6–12 embryos per condition, 30 hpf–1592 cells, 42 hpf–2932 cells, 54 hpf–3499 cells, 66 hpf–679 cells). As a control, we compared the birthdates of the GFP+ cells that undergo a fate switch to generate excitatory instead of inhibitory neurons with those of GFP- excitatory neurons in the same retinas that did not “try” to express Ptf1a in the first place (GFP- photoreceptors, bipolar cells and ganglion cells). Birthdates were equivalent, suggesting that respecified excitatory cells have the same birthdates as their counterparts (n = 5–6 embryos per condition, 30 hpf—2253 cells, 42 hpf—2441 cells, 54 hpf—2412 cells, 66 hpf—1694 cells) (Fig. 6C). We conclude that in the Ptf1a morphants, cells that can no longer express Ptf1a are still born when they usually would have been, but they become respecified into a cell fate appropriate for that developmental time. These results are consistent with a temporal model of progressive competence restriction influencing the fates of these respecified cells, but the clonal implications of these data should also be born in mind, i.e., that ganglion cells and horizontal cells might often be sisters, one of which express Ptf1a postmitotically and the other of which does not.
Figure 6.

Ptf1a knockdown causes a fate switch to distinct lineages, and histogenetic birthorder is preserved in respecified cells. Cells with changed fates in the Ptf1a morphants are born at the same time as the wild-type Ptf1a. Different Ptf1a:GFP-expressing types of cells (including respecified ones) in the morphant are born in the same histogenetic order as the equivalent types as described in wild types. A, BrdU immunolabel in 75 hpf Tg(ptf1a:GFP) retinas reveal cells that were born before (BrdU-, white dots) and cells that were born after (BrdU+, black dots) the first injection of BrdU (48 hpf in this example). B, Graph shows that the respecified cells combined (any Ptf1a:GFP labeled cells in the photoreceptor, bipolar, or ganglion cell layers) are born at the same time and rate as Ptf1a:GFP cells in the wild-type condition (horizontal and amacrine cells). C, Histogenetic graph showing that different Ptf1a:GFP+ cell types in the morphants are born at distinct, but overlapping temporal times, which follow the order described for wild type. Respecified Ptf1a:GFP labeled excitatory neurons (photoreceptors, bipolar, and ganglion cells) are born at equivalent birthdates as their WT counterparts (dotted lines) within the same sample. These represent birthdates of the excitatory cell types that never turned on ptf1a expression in the first place. PR, Photoreceptor; HC, horizontal cell; BC, bipolar cell; AC, amacrine cell; GC, ganglion cell; ONL, outer nuclear layer; INL, inner nuclear layer; IPL, inner plexiform layer; GCL, ganglion cell layer. Error bars indicate SEM. Scale bar: A, 20 μm.
The role of Ath5 transcription factor in specifying inhibitory cell subtypes
If the cells that usually express Ptf1a in the Ath5+ lineage are intrinsically biased in their competence to generate specific inhibitory cell types, this raises the question of whether Ath5 itself is the intrinsic factor involved in this bias. If so, then loss of Ath5 should inhibit the production of horizontal cells and those subtypes of amacrine cells that preferentially come from the Ath5+ lineage. It has been previously established that lakritz (ath5) mutants and Ath5 morphants have a complete loss of ganglion cells but an increase in other cell types including amacrine cells (Kay et al., 2001; Pittman et al., 2008). We therefore asked whether a loss of Ath5 would differentially affect the expression markers that are expressed in the amacrine and horizontal cells that normally arise from the Ath5+ lineage. What we found was surprising but clear. Instead of a decrease, there was a small but consistent increase in horizontal cells and all subsets of labeled amacrine subtypes (supplemental Fig. 4, available at www.jneurosci.org as supplemental material, shows a parvalbumin example) in lakritz mutants or Ath5 morphants, regardless of whether these markers primarily labeled subtypes arising from Ath5+ or Ath5− progenitors. Ath5 itself cannot, therefore, be crucial in determining the subtypes of inhibitory neurons. The fact that Ath5+ and Ath5− progenitors show distinct biases to generating particular inhibitory cell types must be due to other, yet to be determined intrinsic differences between these progenitor types.
If Ath5 itself is not necessary to generate any of the inhibitory cell subtypes that come from Ath5+ progenitors, it might nevertheless be the case that Ath5 progenitors are biased in their ability to generate particular subtypes of inhibitory cell subtypes. To address this question, we designed a misexpression system, in which the ath5 promoter was used to misexpress Ptf1a using the Gal4/UAS system, so that more Ath5+ cells, rather than only ∼20% of them, expressed Ptf1a and became respecified as inhibitory cell types. A control experiment using UAS:dsRed coinjected with ath5:Gal4VP16_UAS:GFP revealed that 51% of GFP cells express the UAS-driven construct (n = 43 embryos, 1080 cells). Thus, coinjection of UAS:ptf1a and ath5:Gal4VP16_UAS:GFP misexpresses UAS:ptf1a in approximately half of the GFP cells. In the control condition where we only injected ath5:Gal4VP16_UAS:GFP, many of the cells became ganglion cells as expected. As shown previously by Poggi et al. (2005), some of these cells also gave rise to other retinal types, which are presumed to only express low levels of Ath5 transiently. These include bipolar cells that usually have such low levels of Ath5 that they are only rarely detected, while the Gal4/UAS amplification allows all cells with even minute levels of Ath5 to be labeled brightly in this experiment. Analysis of these reveals a significant fate shift toward inhibitory fates (p = 5.7 × 10⁻¹⁷), with more horizontal (p = 0.08), amacrine (p = 4.4 × 10⁻¹⁰), and displaced amacrine (p = 1.66 × 10⁻⁶) cells being made at the expense of excitatory cell types (photoreceptor p = 0.003, bipolar p = 0.003, and ganglion cells p = 2.44 × 10⁻⁶) that normally arise from the Ath5+ lineage (Fig. 7A—C; supplemental Movies 3, 4, available at www.jneurosci.org as supplemental material) (n = 46 control embryos and 73 misexpression embryos). Given these highly significant increases in inhibitory over excitatory cell fates obtained in our sample (which includes all GFP cells, some of which likely do not misexpress Ptf1a), we conclude that coexpression of ptf1a is sufficient to respecify excitatory fates to inhibitory ones within the Ath5+ lineage.
Figure 7.

Ptf1a misexpression in the Ath5+ lineage is sufficient for specific inhibitory subtype fates. Misexpression of ptf1a under the ath5 promoter drives horizontal and amacrine cell fates at the expense of excitatory neuron fates. A, B, Micrographs of 120 hpf retinas showing mosaic GFP expression. In the control (A) the Ath5+ lineage gives rise to the expected cell fates, with ganglion cells dominating, but cells of other types occurring as well. In the misexpression (UAS:ptf1a coinjection, B), many more inhibitory cells can be seen (horizontal and amacrine cells). C, Quantification of cell fates reveals a shift toward inhibitory cell types in the misexpression condition. ns, Not significant; ONL, outer nuclear layer; OPL, outer plexiform layer; OINL, outer half of the inner nuclear layer; IINL, inner half of the inner nuclear layer; IPL, inner plexiform layer; GCL, ganglion cell layer; PR, photoreceptor; HC, horizontal cell; BC, bipolar cell; AC, amacrine cell; GC, ganglion cell. Error bars indicate SEM. **p < 0.01, ***p < 0.001. Scale bar, (in B) A, B, 25 μm.
To examine the subtype specification of these extra ath5:Gal4VP16_UAS:Ptf1a inhibitory cells, we first looked at horizontal cell subtypes. In the adult zebrafish retina, these have previously been classified into H1/2 cells, H3 cells, and rod horizontal cells (Song et al., 2008) according to somal size and dendritic spread. In ath5:Gal4VP16_UAS:GFP control (103 cells), there were 60.2% H1/2, 38.8% H3, and 1.0% rod horizontal (one cell). Of the 191 ath5:Gal4VP16_UAS:gapGFP/UAS:Ptf1a misexpressing cells that we were able to analyze morphometrically, 53 cells were horizontal cells, and these showed a strikingly similar distribution of subtypes with 54.7% H1/2, 41.5% H3, 3.8% rod horizontal (two cells). Thus, at least with respect to their ability to make horizontal cells, we could not distinguish a difference in the Ath5+ cells that normally express Ptf1a from those that do not.
A total of 138 amacrine cells were similarly analyzed. Displaced amacrine cells were excluded because of the difficulty in visually isolating them from the remaining RGCs that expressed Ath5:GFP. Our analysis showed that the frequencies of occurrence of different morphologically identifiable amacrine subtypes differed significantly (p = 0.042, Fisher's exact test) from their frequencies in WT (n = 141 cells), suggesting that misexpression of Ptf1a in the Ath5 lineage cannot generate the normal complement of amacrine subtypes. Specific subtypes were underrepresented or overrepresented, and their frequencies and significant changes are indicated in Table 1 and supplemental Figure 5 (available at www.jneurosci.org as supplemental material). Five subtypes were underrepresented compared with WT in both the normal Ath5+ lineage and the Ptf1a misexpression in Ath5+ lineage (bold in Table 1, supplemental Fig. 5, available at www.jneurosci.org as supplemental material), suggesting that Ath5 progenitors show a bias against particular subtypes of amacrine cells. These five subtypes make up 24.1% of all amacrine subtypes in the INL in WT, but only 5.3% in the normal Ath5 lineage and 5.1% in the Ptf1a misexpressing Ath5 lineage. Interestingly, this proportion is consistent with our time-lapse data showing that 29% of inhibitory cells do not arise from the Ath5 lineage.
Unlike the case for horizontal cells, there was a significant difference between the amacrine subtype distribution generated from normal Ath5+ progenitors and Ath5+ progenitors that misexpressed Ptf1a (p = 0.009, Fisher's exact test). This result suggests that the Ath5 lineages may themselves be heterogeneous in the potential to generate different subtypes, i.e., that the cells which normally turn on Ptf1a within this lineage are already different from the cells which do not turn it on, although in the present experiments it is not possible for us to rule out potential effects of the timing or level of Ptf1a expression.
Extrinsic feedback regulates the balance of excitatory and inhibitory neurons in the retina
As Ptf1a acts as an excitatory to inhibitory switch after the terminal division of progenitor cells in lineages that also generate the main types of excitatory neurons, the regulation of Ptf1a expression is important in ensuring the appropriate balance of excitatory to inhibitory neurons in the retina. The generation of subtypes of amacrine cells has previously been described to be under negative feedback control from factors released by already differentiated cells of the same subtype (Negishi et al., 1982; Reh and Tully, 1986; Belliveau and Cepko, 1999). We thus wanted to know whether the overall number of inhibitory neurons, i.e., the number of retinal neurons expressing Ptf1a, was regulated by extrinsic factors that provide information about the number of existing Ptf1a-expressing cells. To address this question, H2B:RFP RNA was injected into the yolk of one-cell stage Tg(ptf1a:GFP) embryos, and cells from these injected embryos were transplanted into either wild-type embryos (n = 20 embryos) or Ptf1a MO2-injected embryos (n = 34 embryos), which are deficient in inhibitory cell types. In the wild-type hosts, the transplanted cells gave rise to all types of neurons in the appropriate proportions. Indeed, 31.5% of the transplanted cells express Ptf1a:GFP and become inhibitory horizontal and amacrine cells (Fig. 8A). In Ptf1a morphant hosts, however, a significantly higher proportion (42.6%, p = 1.2 × 10⁻¹³) of transplanted cells expressed Ptf1a:GFP and generated inhibitory horizontal and amacrine cells (Fig. 8B). This was particularly evident in images that contained smaller clones (<40) of transplanted WT cells (48.9%, p = 4.1 × 10⁻¹⁹), but it was also true for larger clusters (>40) of transplanted cells (36.0%, p = 0.01) (Fig. 8C), suggesting that the cells in larger transplanted clusters are sufficient to provide some local feedback within themselves.
Figure 8.

Ptf1a expression is regulated by negative extrinsic feedback from inhibitory cells. Extrinsic signals influence the expression of Ptf1a:GFP and generation of inhibitory subtypes. Tg(ptf1a:GFP) were injected with H2B:RFP to mark all nuclei red. A few cells were then transplanted into host embryos that were either WT or Ptf1a MO2 morphants. A, B, Micrographs showing examples of transplanted cells in the wild-type (A) or morphant embryos (B). Superimposed channels shown in first column, followed by red and green channels alone. Ptf1a:GFP-expressing cells were consistently found in layers corresponding to horizontal and amacrine cells. D, Quantification of percentage of transplanted cells that express Ptf1a:GFP cells and generate inhibitory neurons. The proportion of transplanted cells (red) that turned on Ptf1a:GFP expression (green) was significantly higher in the MO background, especially in retinas containing fewer transplanted cells. Numbers in bars indicate the number of analyzed cells arising from 20 (WT), 5 (large clones), or 29 (small clones) embryos. **p < 0.01, ***p < 0.001. D–F, Subtype composition of transplanted clones. Antibodies against calretinin, parvalbumin, or calbindin were used to determine the proportion of transplanted cells that would generate these subpopulations in WT versus morphant environments. ONL, Outer nuclear layer; OPL, outer plexiform layer; INL, inner nuclear layer; IPL, inner plexiform layer; GCL, ganglion cell layer. Scale bars: (in B) A, B, 50 μm; (in F) D–F, 10 μm.
Are all amacrine subtypes increased to the same extent in these experiments? We used antibodies against parvalbumin, calbindin, and calretinin (parvalbumin labels mutually exclusive populations compared with calbindin or calretinin, data not shown) and processed 40 embryos for each condition with each of these antibodies. The proportion of transplanted H2B:RFP+ cells in the amacrine layer staining for each marker in the WT (n = 44–58 pictures) and Ptf1a morphant (n = 47–57 pictures) hosts were compared (Fig. 8D–F). The total proportion of amacrine cells increased significantly by 13.7% (p = 1 × 10⁻⁵). The proportion of calretinin- and calbindin-labeled amacrine cells in transplanted clones in morphants increased by 13.8% and 18.3%, respectively. Interestingly, the proportion of parvalbumin-labeled cells compared with transplanted clones increased significantly by 51%. (p = 0.01). Given that parvalbumin+ cells label a population in the innermost layer of the INL closest to the inner plexiform layer, where earlier born cell types tend to reside (Voinescu et al., 2009), it is interesting to speculate that earlier generated amacrine cell subtypes are rescued to a greater extent than later generated amacrine cell subtypes, which have access to fewer of the remaining transplanted WT cells. These results suggest an interesting, though subtle complexity in extrinsic feedback signaling influencing subtype fates.
Discussion
In the vertebrate retina, where it is possible to study the origin of the main types of excitatory and inhibitory neurons as they arise from common progenitors, it appears that progenitors, at least those that are very close to their final cell cycle, are divided into pools with biased lineages marked by the expression of transcription factors that play a major cell fate determination role such as Vsx2, Vsx1, or Ath5 (Vitorino et al., 2009). Retinal cells that retain high expression levels of these three transcription factors differentiate into all of the major types of excitatory neurons. In several areas of the nervous system, where excitatory and inhibitory cells are both generated locally, Ptf1a is involved in the generation of inhibitory neurons (Sellick et al., 2004; Glasgow et al., 2005; Hoshino et al., 2005; Bröhl et al., 2008; Hori et al., 2008; Huang et al., 2008). In the retina, Ptf1a is necessary and sufficient for the generation of the two main types of inhibitory neurons, the horizontal and amacrine cells (Fujitani et al., 2006; Dullin et al., 2007; Nakhai et al., 2007; LeLievre et al., 2009).
By comparing the expression of Ptf1a and our previously studied transcription factors that drive excitatory cell fates, in individual cells throughout development, we reveal in this study new lineage relationships that explain the origin of all of the main types of retinal neurons. We found that the specification of inhibitory subtypes arises from the cell-autonomous expression of Ptf1a in descendants of distinct progenitors (Fig. 9). For example, distinct subtypes of inhibitory cells are linked to the Ath5+ lineage. However, we also show that Ath5 itself was not the essential factor that determines these subtypes, implicating other factors within the Ath5 lineage.
Figure 9.

Proposed model of lineages leading to the cell fate determination of all major types of retinal neurons. Our data supports a two-step determination model, in which multipotent progenitors are initially divided into parallel lineages to make up pools of progenitors that are restricted in their lineage and express high levels of either vsx1, vsx2, or ath5. Cells that maintain high expression levels of these three transcription factors give rise to all of the excitatory neuron cell types and glia cells. Inhibitory neurons do not arise from a completely separate parallel lineage, but are instead determined sequentially upon multiple of these fate-restricted lineages expressing vsx2 or ath5 or possibly also upon vsx1 progenitors (dashed hypothetical arrow) postmitotically by Ptf1a, which overrides the competence to form the standard excitatory cell types still present within these cells. Cells that turn on expression of ptf1a turn down expression of these transcription factors. Cells arising from a particular lineage, such as ath5, give rise preferentially to specific subtypes. The expression of Ptf1a is controlled in part through extrinsic feedback mechanisms.
The relationship between subtypes and lineage could also explain observations in Xenopus, in which blastomeres that contribute to the future retina may already be biased toward generating particular subtypes of amacrine cells (Huang and Moody, 1995, 1997; Moody et al., 2000), showing that such lineage biases may start at extraordinarily early stages of development. Several transcription factors known to influence retinal cell types (for review, see Ohsawa and Kageyama, 2008) might be expressed in a lineage-specific manner. Some of these, such as barhl2, Nr4a2 (also known as Nurr1), Rx1, and Pax6 may play specific roles in determining inhibitory subtypes (Mo et al., 2004; Zaghloul and Moody, 2007; Ding et al., 2009; Jiang and Xiang, 2009). Therefore, it will be interesting to know whether any of these are expressed specifically in the Ath5+ lineage, and if so, whether their coexpression with Ptf1a in this lineage will produce a more restricted population of inhibitory subtypes. As more candidate genes involved in subtype specificity are discovered (Avanesov et al., 2005; Pujic et al., 2006; Trimarchi et al., 2007; Cherry et al., 2009), one can ask whether these factors work alone or in combination with lineage biased or temporal patterning-based intrinsic factors or extrinsic cues, to define particular features of inhibitory cell subtypes.
Our results from misexpression of Ptf1a within the Ath5 lineage extends previous studies by Dullin et al. (2007), who used broad overexpression of Ptf1a in Xenopus to generate extra amacrine, horizontal, and even some GABA-expressing bipolar cells. Our results differ from Fujitani et al. (2006), who were unable to drive inhibitory fates by overexpressing Ptf1a in retinal progenitors in mouse. This could be due to a mismatch in timing, or level of expression, given the very brief temporal expression of ptf1a mRNA within individual cells in the zebrafish retina (Jusuf and Harris, 2009). Ptf1a expression might need to be turned on at high levels at the correct time (just after the last progenitor division) to cause the fate switch, ensuring that alternative fate signals such as excitatory promoting factors are antagonized at the exact time at which the final fate choice is made. In accordance with the lineage restriction model of inhibitory subtype specification, we found that certain amacrine cell subtypes do not arise in their normal frequencies in either the normal Ath5 lineage or from Ath5+ progenitors that misexpress Ptf1a. Thus, Ath5 progenitors may be biased against certain amacrine subtype fates. It is gratifying to note that the subtypes of amacrine cell that tend to be scarce both in the normal Ath5 lineage and from progenitors that misexpress Ptf1a under an Ath5 driver account for approximately a quarter of amacrine cells in the INL, and that this corresponds to the proportion of Ptf1a+ cells that our time-lapse studies revealed to arise from Ath5− progenitors.
By knocking down Ptf1a we could study how the different lineages respond to the lack of inhibitory neurons that usually arise from these lineages. Using immunohistochemical markers, we first showed directly that different subtypes of amacrine cells (including GABAergic and glycinergic types) are affected equally by the knockdown of Ptf1a, confirming its necessity for the inhibitory cell phenotype. In contrast to other studies (Nakhai et al., 2007), neither apoptosis is increased nor is the total cell number decreased in the Ptf1a knockdown, suggesting that inhibitory cells become respecified. We found that in Ptf1a morphants, ptf1a:GFP cells that would normally express Ptf1a become ganglion cells, bipolar cells, and photoreceptors. The transplantation experiments suggest that some of these cells may be activating the transgene due to the lack of negative feedback. Similarly, we find an increase of different excitatory cells in different lineages, i.e., additional bipolar in the Vsx1 lineage and additional RGCs in the Ath5 lineage, stressing that the fate changes that occur are consistent with the previous identity or fate-restricted potential of each progenitor. Consistent with these results, birthdating experiments also revealed that respecified cells are born at the same time as inhibitory cells are normally, and yet follow the histogenetic order described for the excitatory cell types (Schmitt and Dowling, 1999). This reinforces the suggestion that temporal patterning is important in specifying cell fates (Cherry et al., 2009; Voinescu et al., 2009), but it also points to the fact that specific types of excitatory cells are lineage-related siblings of specific types of inhibitory cells.
If Ptf1a acts autonomously and postmitotically as a switch from excitatory to inhibitory cell fates within lineages, how is Ptf1a regulated? We assessed whether negative feedback from differentiating cells of the same type was important to control the final balance of excitatory and inhibitory cells. Such feedback control has been shown for ganglion cells (Waid and McLoon, 1998; González-Hoyuela et al., 2001; Mu et al., 2005; Poggi et al., 2005) and even distinct subtypes of amacrine cells showing a fine-grained specificity (Negishi et al., 1982; Reh and Tully, 1986; Belliveau and Cepko, 1999). Indeed, the observed increase in the proportion of cells expressing Ptf1a:GFP in clones of wild-type cells within Ptf1a morphant retinas suggests that an early stage in this specificity might be regulation of Ptf1a expression in newly postmitotic neurons, which in turn affects the balance of excitatory to inhibitory cells in the retina. Moreover, the effect was less pronounced in embryos with larger number of transplanted cells, suggesting that feedback from even a few inhibitory cells in the transplanted population is sufficient to influence the fates of subsequently differentiating cells, presumably by biasing the Ptf1a switch.
We hope that the experimental insights into the lineage-related origin of different subtypes of inhibitory neurons will provide a helpful framework for further investigation of the potential of progenitors that differentially express combinations of transcription factors. Together, these studies indicate a network of intrinsic and extrinsic factors that control the vast variety of retinal subtypes that are critical for the first stages of processing visual information.
Footnotes
This work was supported by a Wellcome Trust Programme grant (W.A.H.) and a CJ Martin National Health and Medical Research Council training fellowship award (ID454798, P.R.J.). We thank Professor Steven D. Leach (Johns Hopkins Medical Institute, Baltimore, MD) for providing the Ptf1a:GFP transgenic zebrafish line, constructs to inject ptf1a DNA, and generate ptf1a in situ riboprobes and protocols. We are grateful for the kind gifts of the 5E11 antibody by Associate Professor James M. Fadool (Florida State University, Tallahassee, FL) and the Hermes antibody by Associate Professor Malgorzata Kloc (University of Texas, Austin, TX). We thank Jeremy Skepper for plastic embedding of samples and support with confocal microscopy, Adrian McNabb and Tomasz Dyl for taking care of our animal stocks, and Helen Lynn and Grace Wong for technical assistance. We are grateful to Pat M.E. Altham and Yining Chen (Statistical Laboratory, University of Cambridge, Cambridge, UK) and Michalis Agathocleous and Marie-Laure Baudet for statistical advice and Michael Bate, Kate Lewis, Rick Livesey, Louis Leung, Caren Norden, and Joshua Sanes for comments on this manuscript. P.R.J. performed most of the experiments and wrote the initial manuscript. W.A.H. conceived of the study, supervised the work, which was done in his laboratory, and revised this manuscript. A.D.A. performed experiments to assess changes in excitatory lineages in Ptf1a morphants (Fig. 3). O.R. performed transplantation experiments for the cell-autonomous role (Fig. 5) and extrinsic influences (Fig. 8). K.J., L.P., and O.R. generated and tested the ath5:Gal4VP16_UAS:gapGFP construct.
References
- Avanesov A, Dahm R, Sewell WF, Malicki JJ. Mutations that affect the survival of selected amacrine cell subpopulations define a new class of genetic defects in the vertebrate retina. Dev Biol. 2005;285:138–155. doi: 10.1016/j.ydbio.2005.06.009. [DOI] [PubMed] [Google Scholar]
- Belliveau MJ, Cepko CL. Extrinsic and intrinsic factors control the genesis of amacrine and cone cells in the rat retina. Development. 1999;126:555–566. doi: 10.1242/dev.126.3.555. [DOI] [PubMed] [Google Scholar]
- Bröhl D, Strehle M, Wende H, Hori K, Bormuth I, Nave KA, Müller T, Birchmeier C. A transcriptional network coordinately determines transmitter and peptidergic fate in the dorsal spinal cord. Dev Biol. 2008;322:381–393. doi: 10.1016/j.ydbio.2008.08.002. [DOI] [PubMed] [Google Scholar]
- Cherry TJ, Trimarchi JM, Stadler MB, Cepko CL. Development and diversification of retinal amacrine interneurons at single cell resolution. Proc Natl Acad Sci. 2009;106:9495–9500. doi: 10.1073/pnas.0903264106. [DOI] [PMC free article] [PubMed] [Google Scholar]
- Ding Q, Chen H, Xie X, Libby RT, Tian N, Gan L. BARHL2 differentially regulates the development of retinal amacrine and ganglion neurons. J Neurosci. 2009;29:3992–4003. doi: 10.1523/JNEUROSCI.5237-08.2009. [DOI] [PMC free article] [PubMed] [Google Scholar]
- Dullin JP, Locker M, Robach M, Henningfeld KA, Parain K, Afelik S, Pieler T, Perron M. Ptf1a triggers GABAergic neuronal cell fates in the retina. BMC Dev Biol. 2007;7:110. doi: 10.1186/1471-213X-7-110. [DOI] [PMC free article] [PubMed] [Google Scholar]
- Fujitani Y, Fujitani S, Luo H, Qiu F, Burlison J, Long Q, Kawaguchi Y, Edlund H, MacDonald RJ, Furukawa T, Fujikado T, Magnuson MA, Xiang M, Wright CV. Ptf1a determines horizontal and amacrine cell fates during mouse retinal development. Development. 2006;133:4439–4450. doi: 10.1242/dev.02598. [DOI] [PubMed] [Google Scholar]
- Glasgow SM, Henke RM, Macdonald RJ, Wright CV, Johnson JE. Ptf1a determines GABAergic over glutamatergic neuronal cell fate in the spinal cord dorsal horn. Development. 2005;132:5461–5469. doi: 10.1242/dev.02167. [DOI] [PubMed] [Google Scholar]
- Godinho L, Mumm JS, Williams PR, Schroeter EH, Koerber A, Park SW, Leach SD, Wong RO. Targeting of amacrine cell neurites to appropriate synaptic laminae in the developing zebrafish retina. Development. 2005;132:5069–5079. doi: 10.1242/dev.02075. [DOI] [PubMed] [Google Scholar]
- González-Hoyuela M, Barbas JA, Rodríguez-Tébar A. The autoregulation of retinal ganglion cell number. Development. 2001;128:117–124. doi: 10.1242/dev.128.1.117. [DOI] [PubMed] [Google Scholar]
- Ho RK, Kane DA. Cell-autonomous action of zebrafish spt-1 mutation in specific mesodermal precursors. Nature. 1990;348:728–730. doi: 10.1038/348728a0. [DOI] [PubMed] [Google Scholar]
- Holt CE, Bertsch TW, Ellis HM, Harris WA. Cellular determination in the Xenopus retina is independent of lineage and birth date. Neuron. 1988;1:15–26. doi: 10.1016/0896-6273(88)90205-x. [DOI] [PubMed] [Google Scholar]
- Hori K, Cholewa-Waclaw J, Nakada Y, Glasgow SM, Masui T, Henke RM, Wildner H, Martarelli B, Beres TM, Epstein JA, Magnuson MA, Macdonald RJ, Birchmeier C, Johnson JE. A nonclassical bHLH Rbpj transcription factor complex is required for specification of GABAergic neurons independent of Notch signaling. Genes Dev. 2008;22:166–178. doi: 10.1101/gad.1628008. [DOI] [PMC free article] [PubMed] [Google Scholar]
- Hoshino M, Nakamura S, Mori K, Kawauchi T, Terao M, Nishimura YV, Fukuda A, Fuse T, Matsuo N, Sone M, Watanabe M, Bito H, Terashima T, Wright CV, Kawaguchi Y, Nakao K, Nabeshima Y. Ptf1a, a bHLH transcriptional gene, defines GABAergic neuronal fates in cerebellum. Neuron. 2005;47:201–213. doi: 10.1016/j.neuron.2005.06.007. [DOI] [PubMed] [Google Scholar]
- Hu M, Easter SS. Retinal neurogenesis: the formation of the initial central patch of postmitotic cells. Dev Biol. 1999;207:309–321. doi: 10.1006/dbio.1998.9031. [DOI] [PubMed] [Google Scholar]
- Huang M, Huang T, Xiang Y, Xie Z, Chen Y, Yan R, Xu J, Cheng L. Ptf1a, Lbx1 and Pax2 coordinate glycinergic and peptidergic transmitter phenotypes in dorsal spinal inhibitory neurons. Dev Biol. 2008;322:394–405. doi: 10.1016/j.ydbio.2008.06.031. [DOI] [PubMed] [Google Scholar]
- Huang S, Moody SA. Asymmetrical blastomere origin and spatial domains of dopamine and neuropeptide Y amacrine subtypes in Xenopus tadpole retina. J Comp Neurol. 1995;360:442–453. doi: 10.1002/cne.903600306. [DOI] [PubMed] [Google Scholar]
- Huang S, Moody SA. Three types of serotonin-containing amacrine cells in tadpole retina have distinct clonal origins. J Comp Neurol. 1997;387:42–52. [PubMed] [Google Scholar]
- Jiang H, Xiang M. Subtype specification of GABAergic amacrine cells by the orphan nuclear receptor Nr4a2/Nurr1. J Neurosci. 2009;29:10449–10459. doi: 10.1523/JNEUROSCI.3048-09.2009. [DOI] [PMC free article] [PubMed] [Google Scholar]
- Jusuf PR, Harris WA. Ptf1a is expressed transiently in all types of amacrine cells in the embryonic zebrafish retina. Neural Dev. 2009;4:34. doi: 10.1186/1749-8104-4-34. [DOI] [PMC free article] [PubMed] [Google Scholar]
- Kay JN, Finger-Baier KC, Roeser T, Staub W, Baier H. Retinal ganglion cell genesis requires lakritz, a Zebrafish atonal Homolog. Neuron. 2001;30:725–736. doi: 10.1016/s0896-6273(01)00312-9. [DOI] [PubMed] [Google Scholar]
- Kimmel CB, Ballard WW, Kimmel SR, Ullmann B, Schilling TF. Stages of embryonic development of the zebrafish. Dev Dyn. 1995;203:253–310. doi: 10.1002/aja.1002030302. [DOI] [PubMed] [Google Scholar]
- Kimura Y, Okamura Y, Higashijima S. alx, a zebrafish homolog of Chx10, marks ipsilateral descending excitatory interneurons that participate in the regulation of spinal locomotor circuits. J Neurosci. 2006;26:5684–5697. doi: 10.1523/JNEUROSCI.4993-05.2006. [DOI] [PMC free article] [PubMed] [Google Scholar]
- Kimura Y, Satou C, Higashijima S. V2a and V2b neurons are generated by the final divisions of pair-producing progenitors in the zebrafish spinal cord. Development. 2008;135:3001–3005. doi: 10.1242/dev.024802. [DOI] [PubMed] [Google Scholar]
- Köster RW, Fraser SE. Tracing transgene expression in living zebrafish embryos. Dev Biol. 2001;233:329–346. doi: 10.1006/dbio.2001.0242. [DOI] [PubMed] [Google Scholar]
- LeLievre E, Houille L, Brajeul V, Slembrouck A, Thomasseau S, Sahel JA, Goureau O, Guillonneau X. Role of Ptf1a and modulation of its activity by cofactors during cell differentiation in the chick neural retina. Soc Neurosci Abstr. 2009;35:505.7/A7. [Google Scholar]
- Lin JW, Biankin AV, Horb ME, Ghosh B, Prasad NB, Yee NS, Pack MA, Leach SD. Differential requirement for ptf1a in endocrine and exocrine lineages of developing zebrafish pancreas. Dev Biol. 2004;270:474–486. doi: 10.1016/j.ydbio.2004.02.023. [DOI] [PubMed] [Google Scholar]
- Mo Z, Li S, Yang X, Xiang M. Role of the Barhl2 homeobox gene in the specification of glycinergic amacrine cells. Development. 2004;131:1607–1618. doi: 10.1242/dev.01071. [DOI] [PubMed] [Google Scholar]
- Moody SA, Chow I, Huang S. Intrinsic bias and lineage restriction in the phenotype determination of dopamine and neuropeptide Y amacrine cells. J Neurosci. 2000;20:3244–3253. doi: 10.1523/JNEUROSCI.20-09-03244.2000. [DOI] [PMC free article] [PubMed] [Google Scholar]
- Mu X, Fu X, Sun H, Liang S, Maeda H, Frishman LJ, Klein WH. Ganglion cells are required for normal progenitor- cell proliferation but not cell-fate determination or patterning in the developing mouse retina. Curr Biol. 2005;15:525–530. doi: 10.1016/j.cub.2005.01.043. [DOI] [PubMed] [Google Scholar]
- Nakhai H, Sel S, Favor J, Mendoza-Torres L, Paulsen F, Duncker GI, Schmid RM. Ptf1a is essential for the differentiation of GABAergic and glycinergic amacrine cells and horizontal cells in the mouse retina. Development. 2007;134:1151–1160. doi: 10.1242/dev.02781. [DOI] [PubMed] [Google Scholar]
- Nawrocki LW. Biology. Portland, OR: University of Oregon; 1985. Development of the neural retina in the zebrafish, Brachydanio rerio; p. 146. [Google Scholar]
- Negishi K, Teranishi T, Kato S. New dopaminergic and indoleamine-accumulating cells in the growth zone of goldfish retinas after neurotoxic destruction. Science. 1982;216:747–749. doi: 10.1126/science.7079736. [DOI] [PubMed] [Google Scholar]
- Ohsawa R, Kageyama R. Regulation of retinal cell fate specification by multiple transcription factors. Brain Res. 2008;1192:90–98. doi: 10.1016/j.brainres.2007.04.014. [DOI] [PubMed] [Google Scholar]
- Piri N, Kwong JM, Song M, Caprioli J. Expression of hermes gene is restricted to the ganglion cells in the retina. Neurosci Lett. 2006;405:40–45. doi: 10.1016/j.neulet.2006.06.049. [DOI] [PubMed] [Google Scholar]
- Pittman AJ, Law MY, Chien CB. Pathfinding in a large vertebrate axon tract: isotypic interactions guide retinotectal axons at multiple choice points. Development. 2008;135:2865–2871. doi: 10.1242/dev.025049. [DOI] [PMC free article] [PubMed] [Google Scholar]
- Poggi L, Vitorino M, Masai I, Harris WA. Influences on neural lineage and mode of division in the zebrafish retina in vivo. J Cell Biol. 2005;171:991–999. doi: 10.1083/jcb.200509098. [DOI] [PMC free article] [PubMed] [Google Scholar]
- Pujic Z, Omori Y, Tsujikawa M, Thisse B, Thisse C, Malicki J. Reverse genetic analysis of neurogenesis in the zebrafish retina. Dev Biol. 2006;293:330–347. doi: 10.1016/j.ydbio.2005.12.056. [DOI] [PubMed] [Google Scholar]
- Reh TA, Tully T. Regulation of tyrosine hydroxylase-containing amacrine cell number in larval frog retina. Dev Biol. 1986;114:463–469. doi: 10.1016/0012-1606(86)90210-1. [DOI] [PubMed] [Google Scholar]
- Schmitt EA, Dowling JE. Early retinal development in the zebrafish, Danio rerio: light and electron microscopic analyses. J Comp Neurol. 1999;404:515–536. [PubMed] [Google Scholar]
- Sellick GS, Barker KT, Stolte-Dijkstra I, Fleischmann C, Coleman RJ, Garrett C, Gloyn AL, Edghill EL, Hattersley AT, Wellauer PK, Goodwin G, Houlston RS. Mutations in PTF1A cause pancreatic and cerebellar agenesis. Nat Genet. 2004;36:1301–1305. doi: 10.1038/ng1475. [DOI] [PubMed] [Google Scholar]
- Skepper JN. Immunocytochemical strategies for electron microscopy: choice or compromise. J Microsc. 2000;199:1–36. doi: 10.1046/j.1365-2818.2000.00704.x. [DOI] [PubMed] [Google Scholar]
- Song PI, Matsui JI, Dowling JE. Morphological types and connectivity of horizontal cells found in the adult zebrafish (Danio rerio) retina. J Comp Neurol. 2008;506:328–338. doi: 10.1002/cne.21549. [DOI] [PMC free article] [PubMed] [Google Scholar]
- Trimarchi JM, Stadler MB, Roska B, Billings N, Sun B, Bartch B, Cepko CL. Molecular heterogeneity of developing retinal ganglion and amacrine cells revealed through single cell gene expression profiling. J Comp Neurol. 2007;502:1047–1065. doi: 10.1002/cne.21368. [DOI] [PubMed] [Google Scholar]
- Trimarchi JM, Stadler MB, Cepko CL. Individual retinal progenitor cells display extensive heterogeneity of gene expression. PloS One. 2008;3:e1588. doi: 10.1371/journal.pone.0001588. [DOI] [PMC free article] [PubMed] [Google Scholar]
- Turner DL, Cepko CL. A common progenitor for neurons and glia persists in rat retina late in development. Nature. 1987;328:131–136. doi: 10.1038/328131a0. [DOI] [PubMed] [Google Scholar]
- Vitorino M, Jusuf PR, Maurus D, Kimura Y, Higashijima S, Harris WA. Vsx2 in the zebrafish retina: restricted lineages through derepression. Neural development. 2009;4:14. doi: 10.1186/1749-8104-4-14. [DOI] [PMC free article] [PubMed] [Google Scholar]
- Voinescu PE, Emanuela P, Kay JN, Sanes JR. Birthdays of retinal amacrine cell subtypes are systematically related to their molecular identity and soma position. J Comp Neurol. 2009;517:737–750. doi: 10.1002/cne.22200. [DOI] [PMC free article] [PubMed] [Google Scholar]
- Waid DK, McLoon SC. Ganglion cells influence the fate of dividing retinal cells in culture. Development. 1998;125:1059–1066. doi: 10.1242/dev.125.6.1059. [DOI] [PubMed] [Google Scholar]
- Wetts R, Fraser SE. Multipotent precursors can give rise to all major cell types of the frog retina. Science. 1988;239:1142–1145. doi: 10.1126/science.2449732. [DOI] [PubMed] [Google Scholar]
- Yang Z, Ding K, Pan L, Deng M, Gan L. Math5 determines the competence state of retinal ganglion cell progenitors. Dev Biol. 2003;264:240–254. doi: 10.1016/j.ydbio.2003.08.005. [DOI] [PubMed] [Google Scholar]
- Zaghloul NA, Moody SA. Changes in Rx1 and Pax6 activity at eye field stages differentially alter the production of amacrine neurotransmitter subtypes in Xenopus. Mol Vis. 2007;13:86–95. [PMC free article] [PubMed] [Google Scholar]
- Zolessi FR, Poggi L, Wilkinson CJ, Chien CB, Harris WA. Polarization and orientation of retinal ganglion cells in vivo. Neural Dev. 2006;1:2. doi: 10.1186/1749-8104-1-2. [DOI] [PMC free article] [PubMed] [Google Scholar]