

Abstract
Incidence of whooping cough, unlike many other childhood diseases for which there is an efficacious vaccine, has been increasing over the past twenty years despite high levels of vaccine coverage. Its reemergence has been particularly noticeable among teenagers and adults. Many hypotheses have been put forward to explain these two patterns, but parsimonious reconciliation of clinical data on the limited duration of immunity with both pre- and postvaccine era age-specific incidence remains a challenge. We consider the immunologically relevant, yet epidemiologically largely neglected, possibility that a primed immune system can respond to a lower dose of antigen than a naive one. We hypothesize that during the prevaccine era teenagers’ and adults’ primed immunity was frequently boosted by reexposure, so maintaining herd immunity in the face of potentially eroding individual immunity. In contrast, low pathogen circulation in the current era, except during epidemic outbreaks, allows immunity to be lost before reexposure occurs. We develop and analyze an age-structured model that encapsulates this hypothesis. We find that immune boosting must be more easily triggered than primary infection to account for age-incidence data. We make age-specific and dynamical predictions through bifurcation analysis and simulation. The boosting model proposed here parsimoniously captures four key features of pertussis data from highly vaccinated countries: (i) the shift in age-specific incidence, (ii) reemergence with high vaccine coverage, (iii) the possibility for cyclic dynamics in the pre- and postvaccine eras, and (iv) the apparent shift from susceptible-infectious-recovered (SIR)-like to susceptible-infectious-recovered-susceptible (SIRS)-like phenomenology of infection and immunity to Bordetella pertussis.
Keywords: infectious disease, mathematical model, reemerging infections
Whooping cough was historically viewed as an acute, immunizing disease (1). As with many of the other classic childhood infections, the development of candidate vaccines was early and promising. Within three decades of the isolation of the dominant etiological agent, Bordetella pertussis, an international effort produced a whole-cell vaccine that could successfully prevent large-scale outbreaks (2, 3). In the United States, for the first forty years after the introduction of the vaccine, whooping cough incidence steadily declined until, by the 1970s, it was all but eradicated (4). Since the 1980s, there has been an increase in whooping cough cases in teenagers and adults, even among those previously vaccinated, with a concurrent unforeseen rise in incidence (5, 6) (Fig. 1). The US patterns are mirrored in most other countries for which control through mass-vaccination had initially appeared to be very successful, including Canada, most European countries, Australia, and Taiwan (7–12). The epidemiological patterns differ in low vaccine uptake regions, such as Africa and South East Asia where disease burden remains high (13, 14). One estimate suggests that these areas each experience over 12 million pertussis cases and there are 170,000 deaths due to pertussis in Africa alone each year (15). The recent reemergence in highly vaccinated regions is evidence that vaccine-induced immunity is not as protective as had been hoped. Somehow, herd-immunity has steadily eroded during the past three decades despite continuous immunization efforts. Some public health agencies are introducing a teenage booster vaccine in an effort to restore population-level immunity (16). This is a new strategy that has only been implemented in a few regions and it is important to understand how the underlying biology and ecology of pertussis may impact the success of this booster vaccination campaign (17).
Fig. 1.

(A) The number of reported pertussis cases in Massachusetts. The main plot shows cases aggregated yearly from 1910 to 2008. (Inset) Cases aggregated monthly from 1990 to 2008. (B) The distribution of ages of reported infections in Massachusetts. (Left Cases identified between 1918 and 1921, with cases aggregated into twelve age groups (year long from 0 to 10 years of age, then 10–15, and > 15). (Right) Cases identified between January 1988 and December 2008, with all cases aggregated into year-long age intervals.
Three broad classes of hypothesis have been put forward to explain the shifts in total and age-specific incidence. (i) Better diagnostic techniques and increased awareness in the medical community of the possibility of infections of B. pertussis in adults have led to a rise in diagnoses but not true disease incidence. However, the frequent, pronounced, and highly symptomatic outbreaks within high schools over the past two decades have established this phenomenon as a change in infection patterns, not merely diagnostics (5). (ii) Another hypothesis is that the changes in incidence are caused by antigenic evolution of B. pertussis away from the original vaccine-targeted strain (18, 19). The evidence for this is inconclusive, with one study finding that B. pertussis has not exhibited accelerated evolutionary rates that would be indicative of positive selection (20) and others finding that there is evidence of high levels of polymorphism in antigenic sites, suggestive of positive selection driven by interactions with host immunity (18). Whereas vaccine-driven evolution may help to explain the increase in total incidence, it can not explain the shift in age-specific incidence (Fig. 1B). (iii) A third class of explanations involves changing population-level immunity, via some mixture of loss of immunity and reexposure (4, 21).
There is ample evidence that immunity to whooping cough wanes after both vaccination and natural infection (22, 23, 24). Serological surveys suggest that people who are reexposed to B. pertussis can exhibit boosting of antibody titers, without developing clinical symptoms (9, 25–27). In addition, studies on vaccine efficacy have shown that the pertussis booster vaccine (Adacel) elicits a significantly stronger immune response than the primary vaccine (Daptacel) despite containing five times less pertussis toxin (28). This is to be expected because immune memory cells respond more quickly and to lower doses of antigen when primed than when naive (29, 30). Recent advances in imaging technologies have made it possible to observe the kinetics of primed, tolerized and naive T cells in response to antigenic stimulation in vivo and demonstrated that primed T cells are more efficient at identifying and responding to antigen presenting cells than naive ones (31, 32). This suggests that a brief exposure to a small amount of antigen can restimulate B. pertussis immunity, extending its efficacy without causing symptomatic or transmissible infection. We herein refer to this phenomenon as “immune boosting.” Previous work has explored the effects of immune boosting on disease dynamics in general, and pertussis in particular (33, 34). However, in previous models of disease transmission, this phenomenon has generally been presumed to be no more likely than primary infection (21, 35–37). The model analyzed here incorporates immunological evidence on the sensitivity and speed of primed B and T cells by allowing individuals who are reexposed to B. pertussis antigens to generate an immune response to a more casual contact than would be necessary to cause a primary infection. This allows our model to capture the age-specific incidence in both the pre- and postvaccine eras using estimates of the immune duration that are in accord with clinical evidence.
There have been many models that incorporate loss of immunity and reexposure in an attempt to understand the pre- or postvaccine era data. One model has predicted the recent rise in cases as a consequence of a contrast between permanent infection-induced immunity and shorter-lived vaccine-induced immunity (4). However, it is becoming increasingly clear that immunity to both natural infection and vaccination wanes with time (22). A second model allowed for some loss of infection-induced immunity, but found that it would have to last for more than thirty years on average to explain the observed dynamical patterns (35). A third model explained the shift in age distribution as a result of loss of immunity combined with the probability of being observed clinically as a function of time since last exposure (21). All of these models share one common feature: they assume that, given equal levels of contact with the pathogen, secondary exposure is less likely to boost immunity than primary exposure is to generate symptomatic infection and an immune response. In this paper we show that loss of immunity and high rates of immune boosting when circulation is high, consistent with immunological evidence on the effects of priming on immune response kinetics (29, 30), can account for the observed epidemic reemergence and age shift. Additionally we predict the outcome of instituting high coverage of a teenage booster vaccine, which has recently been recommended in a number of regions, including Massachusetts (16, 38).
We develop and analyze a susceptible-infectious-recovered-susceptible (SIRS)-type model with immune boosting in which antigenic stimulation before immunity has been fully lost can lead to increased immunity without symptomatic or transmissible infection, and compare its predictions to historical and recent age-incidence data from Massachusetts. Our model predicts repeated boosting after priming by initial infection in the prevaccine era, thereby reducing adolescent and adult cases and generating the observed shift in age distribution and the pathogen’s epidemic reemergence with increasing vaccine coverage in the decades after the vaccine’s introduction. The model is moreover a parsimonious explanation of the increasing apparency of waning immunity as vaccine coverage causes a shift from a more susceptible-infectious-recovered (SIR)-like to more SIRS-like system. Additionally, the model allows for a suite of complex dynamical behaviors even in the prevaccine era, a period for which preexisting models do not parsimoniously explain the dynamics observed in pertussis globally.
1. Results
1.1. The Model.
Whooping cough incidence in Massachusetts began to decline after the introduction of the whole-cell pertussis vaccine in the 1930s and steeply declined after the inception of routine vaccination in 1950 (Fig. 1A). As in other high-vaccine coverage populations, however, the disease made a surprise reemergence in the 1980s. The reemergence was accompanied by a dramatic shift in age-specific incidence, with the majority of cases moving from young children to teenagers resulting in a U-shaped age-incidence curve (Fig. 1B).
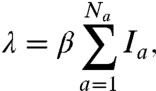
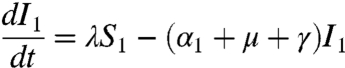
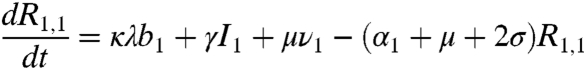
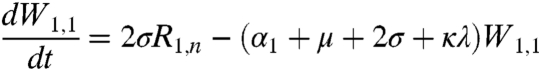
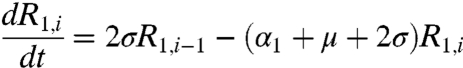
To understand the reemergence and age shift we developed an SIRS-type model that allows for boosting of immunity proportional to, and potentially greater than, the force of infection (Fig. 2). To accommodate the notion of immune boosting we divided recovered individuals into two classes: R (recovered) and W (waning). R contains recently recovered or boosted, highly immune individuals. W contains individuals who are still immune to infection but can have their immunity boosted upon reexposure. In the absence of exposure, people in W will eventually lose immunity altogether and return to the susceptible class. When the force of infection is high, boosting is frequent and recovered individuals rarely revert to the susceptible class. The mathematical model derivation is as follows. The force of infection (i.e., the per susceptible rate of infection), λ, is given by
 |
[1] |
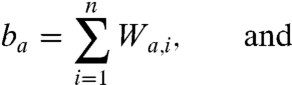
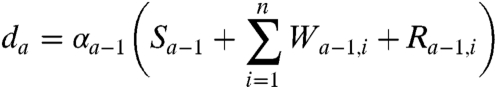
where a is the age group, Na is the total number of age classes tracked, Ia is the proportion infected in each age group, and β is the transmission coefficient. The proportion of the population susceptible to boosting (ba) and receiving a dose of vaccine (da) at any given age are
 |
[2] |
 |
[3] |
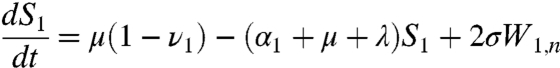
respectively. In the above equations, i is the stage of the gamma-chain and n is the number of gamma stages, allowing for nonexponential waiting times between events (e.g., ref. 39). When n = 1 the model collapses to the case of exponentially distributed waiting times between classes. For simplicity all figures in the main text except 3a and 5 show results from the exponential model, but we show in the supplementary materials that all conclusions remain for the more realistic but less tractable nonexponential model. The differential equations for the first age class, a = 1 (corresponding to 0–0.5 years), which includes births into the population are:
 |
[4] |
 |
[5] |
 |
[6] |
 |
[7] |
 |
[8] |
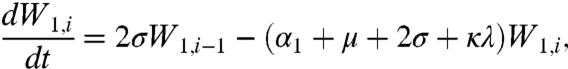 |
[9] |
where μ is the birth (and death) rate, σ is the rate of loss of immunity in the absence of boosting, γ is the recovery rate, κ is the boosting coefficient, and ν are the age-specific vaccination probabilities. We use half-year age classes because the high-risk age group is the 0–6 mo old prevaccination infants. For all other age classes, a = 2,3,4, ...,Na, the equations are given in the SI Text.
Fig. 2.

A flow-diagram of the basic model. Individuals in class R (recovered) are resistant to infection and immune boosting. Those in W (waning) are resistant to infection but their immunity can be boosted at a rate determined by the force of infection, λ, and the value of the boosting coefficient, κ. The duration of immunity to infection is determined by the length of time spent in the circled loop, which depends on the relative magnitude of the competing rates κλ and σ.
Simulation and analysis of the model shows that weak boosting [κ ≤ 1 (i.e., boosting requires comparable dose as primary infection)], would result in (i) a short duration of immunity and many teenage and adult cases even in the prevaccine era, and (ii) a monotonic decline in total incidence as vaccine coverage (pvacc) increases (Fig. 3). Neither of these patterns are consistent with the data. In contrast, for moderate boosting [κ≫1 (i.e., boosting requires substantially lower exposure than infection)] the model predicts both the observed shift in age-specific incidence (Fig. 3 A and C) and a threshold vaccine coverage (pvacc), above which increasing coverage leads to epidemic outbreaks and increased incidence (Fig. 3B). This suggests the possibility of vaccine failure in the presence of high vaccine coverage (pvacc > 1 - 1/R0) even in the absence of vaccine-driven antigenic evolution.
Fig. 3.

(A) The model-predicted age distribution at different levels of vaccine coverage for κ = 0.5 and κ = 20 and n = 10. The y-axes indicate the proportion of the total population infected at age a, averaged over time. (Top) Predicted age distributions for κ = 0.5, with pvacc = 0 (black) or pvacc = 0.8 (red). The only age group whose incidence significantly changes from the pre- to postvaccine era is young children who are directly protected by the vaccine. (Bottom) The same results, but for κ = 20. Vaccination results in a decrease in infant cases and an increase in teenage and adult cases, consistent with the data. (B) Mean asymptotic incidence as vaccine coverage increases for κ = 0.5 (red), κ = 20 (black), and κ = 5,000 (green). For low κ disease incidence monotonically decreases as vaccine coverage increases. For the moderate value of κ incidence decreases until a critical vaccine coverage threshold (pvacc ≈ 0.55 with these parameters), at which point it begins increasing again, thereby predicting failure to control disease in the presence of high vaccine coverage. For extremely high κ, herd immunity is restored and incidence decreases monotonically again. (C) Contour plot of the ratio of secondary to primary cases across vaccine coverage (pvacc) and varying values of the boosting coefficient (κ). The area of parameter space in which there are more primary than secondary cases is in shades of blue. Areas in which more secondary cases are expected are in shades of purple to red. For low values of κ, the model predicts more secondary than primary cases even in the absence of vaccine coverage (purple in the bottom left corner). For values of κ > 1 the model allows for predominantly primary cases in the prevaccine era (blue on the left), shifting to predominantly secondary cases with higher vaccine coverage (purples and reds on the right). For areas of parameter space in which there are coexisting cyclic and equilibrial attractors, the results from the fluctuating regimes are shown.
1.2. Model Parametrization.
We parametrized the model using simple or commonly cited parameter values for everything but κ, the boosting coefficient, which we estimated from the prevaccine era data (see SI Text). The recovery rate, γ, was fixed at 17 y-1, corresponding to a mean infectious period of 21 d (21, 35, 40–42). The transmission parameter, β, is not well identified (see discussion in ref. 44). We chose a value that corresponds to a basic reproductive ratio of 15, which is in the middle of the estimated range (43). The loss of immunity rate, σ, was fixed at 1/10 y-1, corresponding to a mean duration of immunity of 10 years. This rate is near the middle of recent estimates for natural infection-induced immunity, and on the high end for vaccine-induced immunity (22) (see Fig. S1 for bifurcation diagram with σ = 1/20). The birth and death rate, μ, was fixed at 1/50 y-1 (see Fig. S2 for bifurcation diagram at other values of μ). For simplicity of analysis, we fixed the population size at 1 so we work on proportions rather than absolute numbers. For the age-specific model, we incorporated a few additional parameters that allowed us to vaccinate in the model at the age classes at which vaccines are actually given in Massachusetts: 0.5, 2, and 5 years of age.
Using the age-specific incidence in the prevaccine era and profile likelihood (45), we estimated a lower bound on the 99% confidence interval for κ at around 10. We assumed that mean duration of immunity is at most 20 years (data from ref. 1 and Fig. S3). See SI Text for assumptions and details of the fitting procedure. For values of κ less than 10, the model predicts that immunity would be lost before most people die and therefore would result in more adult cases in the prevaccine era than are consistent with the data. The profile likelihood is flat for large κ: there is no upper bound to the confidence interval. We chose to use a value of κ = 20 for most of the simulations, though we have explored the system’s behavior over a wide range of κ values. Table 1 shows all parameters.
Table 1.
Parameter values, corresponding to elements presented in Fig. 2 and section 1.1
| Parameter | Biological meaning | Default value |
| β | Transmission coefficient | 260 |
| μ | Birth and death rate | 1/50 |
| σ | Loss of immunity rate | 1/10 |
| γ | Recovery rate | 17 |
| κ | Boosting coefficient | 20 |
| α | Aging rates | αa = 2 for a ≠ Na; αa = 0 for a = Na |
| ν | Vaccination probabilities | νy = 0.8 for y = 0.5,2,5 yrs; νy = 0 otherwise |
| Na | Number of age classes tracked | 50 (corresponds to 25 years) |
| n | Gamma shape parameter | 1 |
All rates have units of y-1.
1.3. Model Predictions.
We examined the effects of increasing vaccine coverage on the predicted age distribution of cases over a range of κ. Because the equilibrium level of infection is predicted to be unstable in the current era (see dynamics below), we could not analytically compute the distribution of ages at infection, and instead simulated from the model. Vaccination was modeled according to the protocol in Massachusetts, which recommends that the first three doses be administered by 6 mo of age, followed by boosters at the ages of two and five years.
For low values of κ, the model predicts (i) extremely high incidence in all age groups with and without vaccination, (ii) an equally large number of teenage and adult cases in the pre- and postvaccine eras, and (iii) a high ratio of infant to teenage cases in the current era due to extremely high levels of infection in the whole population (Fig. 3A). For extremely high values of κ, herd immunity is maintained and the model again predicts monotonically decreasing incidence with increasing vaccine coverage (Fig. 3B). However, for moderately high κ the model parsimoniously predicts the observed shifts in age-specific incidence from the pre- to postvaccine eras; (i) the emergence of a second mode in teenagers, (ii) a decrease in infant cases, and (iii) an increase in teenage and adult cases (Fig. 3 A and C). The shift from predominantly primary to predominantly secondary cases is a direct result of the change in dynamics, and is expected to occur at some time after vaccine coverage is above its threshold level and the system has entered a cyclic regime (Fig. 3C). Here, we define “secondary cases” as cases in individuals who have previously been immune, whether naturally or through vaccination.
The threshold vaccine coverage that predicts entrance into the cyclic regime leads to a concurrent rise in total yearly incidence (Fig. 3B), suggesting a possible mechanism for the recent resurgence of pertussis in highly vaccinated populations such as Massachusetts. The precise timing of the shift is unpredictable because there is a period of increasing vaccine coverage during which the low-incidence equilibrium and high-amplitude cycles coexist (Fig. 4A).
Fig. 4.

(A) Curves indicating the location of bifurcation: supercritical Hopf (dashed line), subcritical Hopf (solid line), and fold of limit cycles (dotted line). (B) Simulated trajectories in each dynamical regime with κ set to 20, and three vaccine coverages. (Top) Coexisting cycle and equilibrium. A sample trajectory from the region with only a stable equilibrium is shown in the middle, and only a limit cycle on the bottom. (C) One-dimensional bifurcation diagram over pvacc. The maximum and minimum infected proportions of the population are shown from simulations over increasing and decreasing vaccine coverage, thereby capturing both attractors in the area in which they coexist (0.4 ≲ pvacc ≲ 0.5). (D) Same as (C) but varying κ instead of pvacc.
Additionally, we examined the impact of 80% coverage with a teenage booster vaccine on incidence and age distribution of pertussis cases. The model predicts that the booster would have a moderate effect on total incidence, reducing it by approximately 14%. Most of this reduction would be due to direct protection for people between the ages of approximately 15 and 25 (Fig. 5), which could help to prevent outbreaks in high schools. However, the model predicts only a modest reduction of cases in infants and most adults of parenting age in developed countries, who are thought to be the main reservoir for infant pertussis. Therefore, whereas a teenage booster campaign could have a significant benefit for preventing outbreaks in high schools, cocooning infants by vaccinating family members may be a better use of the pertussis booster vaccine in terms of protecting the highest-risk age group.
Fig. 5.

Effect of 80% coverage with a teenage booster vaccine given at age 15. The arrows indicate ages at which vaccination can occur (0.5, 2, 5, and 15 years). The white bars show the age distribution without the booster dose at 15 years; the black bars show the distribution with the booster. The y-axis is normalized by the total number of cases in the no-booster regime. Simulations carried out with n = 10.
1.4. Dynamical Predictions: From SIR to SIRS-Like Behavior.
Pertussis dynamics are unusual in that their regime is not predictable based on demographic characteristics, such as birth rate or vaccine coverage, yet when multiannual cycles are present they consistently have a three to four year period (46). The boosting model proposed here suggests the existence and duration of cycles in pertussis dynamics are due in large part to the recruitment of susceptible individuals through loss of immunity. It additionally allows for a wide range of dynamical behaviors (Fig. 4), including the aforementioned coexisting equilibrial and cyclic attractors. This may help to explain the variable dynamics exhibited by pertussis.
For extreme values of κ (0 or ∞), the model collapses to a simple SIRS or SIR model respectively. In the absence of boosting (κ = 0), the model exhibits SIRS dynamics with a single stable fixed-point attractor. However, for κ > 0 more complex dynamical regimes are present. A supercritical Hopf bifurcation exists at κHopf and produces limit cycles across all levels of vaccine coverage for low but appreciable levels of boosting, with the cycle amplitude increasing initially in proportion to  . In addition, a subcritical Hopf bifurcation exists such that for higher values of κ, low birth rates, and low vaccine coverage, large-amplitude stable limit cycles coexist with a fixed-point attractor (Fig. 4A). As vaccine coverage ramps up (i.e., with the advent of mass vaccination), the fixed point loses stability, and only large-amplitude multiannual cycles are present. With higher κ still, the large-amplitude limit cycle loses stability via a saddle node bifurcation (or folding) of limit cycles and the dynamics become similar to those of a simple SIR model—a fixed-point attractor reached through damped oscillations. The specific locations of these bifurcations are sensitive not only to birth rate and vaccine coverage, which can be well identified by data, but also the transmission rate, β, each of which shifts and stretches the Hopf bifurcation along the pvacc-axis (analogous to ref. 47; Fig. 4).
2. Discussion
The severity, prevalence, complexity, and recent reemergence of pertussis has sparked much scientific inquiry. Explanations have been proposed for various aspects of its dynamics and age-structure in the pre- and postvaccine eras: stochastic effects (48), disease severity as a function of time since vaccination (21, 49), and different distributions of waiting times (36) to name a few. Each of these considerations has helped to explain certain aspects of pertussis dynamics: dynamic variability in the prevaccine era, the change in age distribution with its reemergence, and its cyclicity, respectively. However none of these can account for all the complex facets of pertussis epidemiology. Despite the fact that immunologists and vaccine manufacturers have long been aware that there are differences between the kinetics of initial and primed immune responses, population-level models have generally assumed that susceptibility to boosting, as well as symptomatic infection, decreases after initial exposure.
The boosting model proposed here parsimoniously captures three key features of the pertussis data from highly vaccinated countries despite the fact that it is deterministic and autonomous, and assumes homogeneous mixing and no observation bias. It provides a potential mechanism for the shift in age-specific incidence, reemergence with high vaccine coverage, and dynamic variability. The key element that allows this model to produce all three patterns is the simple immunological consideration that a primed immune system can respond to a lower dose of antigen than a naive one (κ > 1). Immunological priming is a general phenomenon in vertebrate immune systems and is neither limited to human hosts nor Bordetella pathogens.
There are, of course, many factors we did not consider, which certainly impact pertussis epidemiology and may improve the quantitative agreement of model and data. In particular, the simple model presented here does not accurately predict the relative heights of the observed infant and teen modes. It is likely that age-specific transmission rates, with assortative teenage mixing and disassortative infant mixing, will heighten the teenage peak and decrease the number of cases in older adults and infants. These mixing patterns will also have an effect on the outcome of a teenage booster campaign. On the one hand, the booster will remove much of the transmission from the high-contact rate teenage group; on the other hand it may push the outbreaks farther toward parenting age, which has been identified as the main source for the severe infant pertussis cases (38, 50, 51). In addition, there is almost certainly age-specific bias in reporting rates, with adults generally being underdiagnosed and often only getting tested if a child with whom they had contact was diagnosed (52).
These complexities notwithstanding, our estimate of κ gives four insights into both the ease with which pertussis immunity may be boosted and the potential population-level mechanisms of observed disease dynamics. First, our range for the boosting coefficient, κ > 10, implies that the probability of a partially recovered person’s immunity being boosted is much greater than that of a susceptible becoming infected, in accord with experimental immunological studies on immune priming. Second, boosting is predicted to have been common in the prevaccine era when there was a high force of infection, and may have been the mechanism responsible for the very low adult incidence. Third, pertussis reemergence in areas with good vaccine policy, such as Massachusetts, is predicted to have been caused by the crossing of a threshold in vaccine coverage, above which the force of infection is low most of the time, resulting in low boosting rates and relatively rapid loss of immunity, thus giving rise to recurrent epidemic outbreaks. Fourth, this model suggests the existence and periodicity of epidemic pertussis outbreaks may be critically shaped by loss and boosting of immunity.
3. Materials and Methods
3.1. Ethics Statement.
The Biomedical Institutional Review Board at Penn State University reviewed and approved our proposal for use of human participants in our research. Because we never had access to names or other uniquely identifying information associated with the data, informed consent was not required.
3.2. The Data.
The data from the current era included all 16,620 clinical B. pertussis cases in Massachusetts between 1988 and 2008 (Fig. 1B). The data were collected and maintained by the Massachusetts Virtual Epidemiological Network and provided by the Massachusetts Department of Public Health. The data from the prevaccine era were taken from ref. 1.
3.3. The Model.
In the absence of vaccination, the model predicted stable, equilibrial dynamics, so the age distribution could be computed analytically. However, to calculate age-specific incidence in the cyclic regime, we simulated the age-structured ordinary differential equation model from which we could track the ages at infection during dynamic simulations. The parameters were held constant at the values given in Table 1 unless noted otherwise in the text.
The non-age-specified model is a special case of the age-structured model, with Na = 1 and α1 = 0. In this simplified version, vaccination is modeled as a proportion of births, pvacc, moving directly to the recovered class. We simulated from this simplified model to generate Figs. 3 B and C and 4 B, C, and D, and analyzed it to generate Fig. 4A. We additionally showed that including n > 1, thereby allowing for a more normal distribution of durations of immunity as was used to generate Figs. 3A and 5, results in qualitatively the same bifurcation structure (Fig. S4). More details on the model are available in the SI Text.
Supplementary Material
Acknowledgments.
We thank Noelle Cocoros and the Massachusetts Department of Public Health for providing the data. We had many valuable conversations, and in particular would like to thank Sourya Shrestha and Helene Broutin. A.K. and O.B. acknowledge the support of the Research and Policy for Infectious Disease Dynamics program of the Science and Technology Directorate, Department of Homeland Security, and the Fogarty International Center, National Institutes of Health. O.B. additionally acknowledges support from the Bill and Melinda Gates Foundation.
Footnotes
The authors declare no conflict of interest.
This article is a PNAS Direct Submission.
Data deposition: The data used in this analysis are available from the Massachusetts Department of Public Health. However, it is protected by Health Insurance Portability and Accountability Act regulations, and therefore cannot be accessed without Institutional Review Board approval.
This article contains supporting information online at www.pnas.org/lookup/suppl/doi:10.1073/pnas.1014394108/-/DCSupplemental.
References
- 1.Gordon JE, Hood RI. Whooping cough and its epidemiological anomalies. Am J Med Sci. 1951;222:333–361. doi: 10.1097/00000441-195109000-00011. [DOI] [PubMed] [Google Scholar]
- 2.Geier D, Geier M. The true story of pertussis vaccination: A sordid legacy? J Hist Med All Sci. 2002;57:249–284. doi: 10.1093/jhmas/57.3.249. [DOI] [PubMed] [Google Scholar]
- 3.Madsen T. Vaccination against whooping cough. J Am Med Assoc. 1933;101:187–188. [Google Scholar]
- 4.Bass JW, Wittler RR. Return of epidemic pertussis in the United States. Pediatr Infect Dis J. 1994;13:343–345. doi: 10.1097/00006454-199405000-00002. [DOI] [PubMed] [Google Scholar]
- 5.Yih WK, et al. The increasing incidence of pertussis in Massachusetts adolescents and adults, 1989-1998. J Infect Dis. 2000;182:1409–1416. doi: 10.1086/315863. [DOI] [PubMed] [Google Scholar]
- 6.Guris D, et al. Changing epidemiology of pertussis in the United States: Increasing reported incidence among adolescents and adults, 1990-1996. Clin Infect Dis. 1999;28:1230–1237. doi: 10.1086/514776. [DOI] [PubMed] [Google Scholar]
- 7.de Melker HE, et al. Reemergence of pertussis in the highly vaccinated population of the Netherlands: Observations on surveillance data. Emerg Infect Dis. 2000;6:348–357. doi: 10.3201/eid0604.000404. [DOI] [PMC free article] [PubMed] [Google Scholar]
- 8.Skowronski DM, et al. The changing age and seasonal profile of pertussis in Canada. J Infect Dis. 2002;185:1448–1453. doi: 10.1086/340280. [DOI] [PubMed] [Google Scholar]
- 9.Pebody RG, et al. The seroepidemiology of Bordetella pertussis infection in western Europe. Epidemiol Infect. 2005;133:159–171. doi: 10.1017/s0950268804003012. [DOI] [PMC free article] [PubMed] [Google Scholar]
- 10.Celentano LP, Massari M, Paramatti D, Salmaso S, Tozzi AE. Resurgence of pertussis in Europe. Pediatr Infect Dis J. 2005;24:761–765. doi: 10.1097/01.inf.0000177282.53500.77. [DOI] [PubMed] [Google Scholar]
- 11.Forsyth K. Pertussis, still a formidable foe. Clin Infect Dis. 2007;45:1487–1491. [Google Scholar]
- 12.Lin YC, et al. Epidemiological shift in the prevalence of pertussis in Taiwan: Implications for pertussis vaccination. J Med Microbiol. 2007;56:533–537. doi: 10.1099/jmm.0.46741-0. [DOI] [PubMed] [Google Scholar]
- 13.Tan T, Trindade E, Skowronski D. Epidemiology of pertussis. Pediatr Infect Dis J. 2005;24:S10–S18. doi: 10.1097/01.inf.0000160708.43944.99. [DOI] [PubMed] [Google Scholar]
- 14.World Health Organization. Immunization surveillance, assessment, and monitoring: Pertussis. 2010. Available at http://www.who.int/immunization_monitoring/diseases/pertussis/en/index.html.
- 15.Crowcroft NS, Stein C, Duclos P, Birmingham M. How best to estimate the global burden of pertussis? Lancet Infect Dis. 2003;3:413–418. doi: 10.1016/s1473-3099(03)00669-8. [DOI] [PubMed] [Google Scholar]
- 16.Halperin SA. The control of pertussis-2007 and beyond. N Engl J Med. 2007;356:110–113. doi: 10.1056/NEJMp068288. [DOI] [PubMed] [Google Scholar]
- 17.de Vries R, et al. Cost-effectiveness of adolescent pertussis vaccination for the Netherlands: Using an individual-based dynamic model. PLoS One. 2010;5:e13392. doi: 10.1371/journal.pone.0013392. [DOI] [PMC free article] [PubMed] [Google Scholar]
- 18.Mooi FR, van Loo IH, King AJ. Adaptation of Bordetella pertussisto vaccination: A cause for its reemergence? Emerg Infect Dis. 2001;7:526–528. doi: 10.3201/eid0707.017708. [DOI] [PMC free article] [PubMed] [Google Scholar]
- 19.Mooi FR, et al. Bordetella pertussis strains with increased toxin production associated with pertussis resurgence. Emerg Infect Dis. 2009;15:1206–1213. doi: 10.3201/eid1508.081511. [DOI] [PMC free article] [PubMed] [Google Scholar]
- 20.Weber C, Boursaux-Eude C, Coralie G, Caro V, Guiso N. Polymorphism of Bordetella pertussis isolates circulating for the last 10 years in France, where a single effective whole-cell vaccine has been used for more than 30 years. J Clin Microbiol. 2001;39:4396–4403. doi: 10.1128/JCM.39.12.4396-4403.2001. [DOI] [PMC free article] [PubMed] [Google Scholar]
- 21.Aguas R, Goncalves G, Gomes M. Pertussis: Increasing disease as a consequence of reducing transmission. Lancet Infect Dis. 2006;6:112–117. doi: 10.1016/S1473-3099(06)70384-X. [DOI] [PubMed] [Google Scholar]
- 22.Wendelboe AM, Van Rie A, Salmaso S, Englund JA. Duration of immunity against pertussis after natural infection or vaccination. Pediatr Infect Dis J. 2005;24:S58–S61. doi: 10.1097/01.inf.0000160914.59160.41. [DOI] [PubMed] [Google Scholar]
- 23.Broutin H, Simondon F, Rohani P, Guegan JF, Grenfell B. Loss of immunity to pertussis in a rural community in Senegal. Vaccine. 2004;22:594–596. doi: 10.1016/j.vaccine.2003.07.018. [DOI] [PubMed] [Google Scholar]
- 24.Versteegh FGA, Schellekens JFP, Nagelkerke AF, Roord JJ. Laboratory-confirmed reinfections with Bordetella pertussis. Acta Paediatr. 2002;91:95–97. doi: 10.1080/080352502753458030. [DOI] [PubMed] [Google Scholar]
- 25.Saemann-Ischenko G, Tillmanns B, Kösters K, Riffelmann M, Wirsing von König CH. Stability of antibodies to bordetella antigens in German adults. Eur J Clin Microbiol. 2001;20:850–853. doi: 10.1007/s10096-001-0639-3. [DOI] [PubMed] [Google Scholar]
- 26.Cattaneo LA, Reed GW, Haase DH, Wills MJ, Edwards KM. The seroepidemiology of Bordetella pertussis infections: A study of persons ages 1–65 years. J Infect Dis. 1996;173:1256–1259. doi: 10.1093/infdis/173.5.1256. [DOI] [PubMed] [Google Scholar]
- 27.Teunis PFM, et al. Kinetics of the igg antibody response to pertussis toxin after infection with B. pertussis. Epidemiol Infect. 2002;129:479–489. doi: 10.1017/s0950268802007896. [DOI] [PMC free article] [PubMed] [Google Scholar]
- 28.Kretsinger K, et al. Preventing tetanus, diphtheria, and pertussis among adults: Use of tetanus toxoid, reduced diphtheria toxoid and acellular pertussis vaccine recommendations of the advisory committee on immunization practices (acip) and recommendation of acip, supported by the healthcare infection control practices advisory committee (hicpac), for use of tdap among health-care personnel. MMWR Morb Mortal Wkly Rep. 2006;55:1–37. [PubMed] [Google Scholar]
- 29.Janeway C. Immunobiology: The Immune System in Health and Disease. 4th Ed. London: Current Biology Publications; 1999. [Google Scholar]
- 30.Tew JG, Kosco MH, Szakal AK. The alternative antigen pathway. Immunol Today. 1989;10:229–232. doi: 10.1016/0167-5699(89)90258-2. [DOI] [PubMed] [Google Scholar]
- 31.Rush CM, et al. Characterization of cd4+ t-cell-dendritic cell interactions during secondary antigen exposure in tolerance and priming. Immunology. 2009;128:463–471. doi: 10.1111/j.1365-2567.2009.03124.x. [DOI] [PMC free article] [PubMed] [Google Scholar]
- 32.Zinkernagel RM, Hengartner H. Regulation of the immune response by antigen. Science. 2001;293:251–253. doi: 10.1126/science.1063005. [DOI] [PubMed] [Google Scholar]
- 33.Coleman PG, Perry BD, Woolhouse ME. Endemic stability-a veterinary idea applied to human public health. Lancet. 2001;357:1284–1286. doi: 10.1016/s0140-6736(00)04410-x. [DOI] [PubMed] [Google Scholar]
- 34.Ghani AC, et al. Loss of population levels of immunity to malaria as a result of exposure-reducing interventions: Consequences for interpretation of disease trends. PLoS One. 2009;4:e4383. doi: 10.1371/journal.pone.0004383. [DOI] [PMC free article] [PubMed] [Google Scholar]
- 35.Wearing HJ, Rohani P. Estimating the duration of pertussis immunity using epidemiological signatures. PLoS Pathog. 2009;5:e1000647. doi: 10.1371/journal.ppat.1000647. [DOI] [PMC free article] [PubMed] [Google Scholar]
- 36.Hethcote HW. Hopf bifurcation in models for pertussis epiemiology. Math Comput Model. 1999;30:29–45. [Google Scholar]
- 37.Reluga TC, Medlock J, Perelson AS. Backward bifurcations and multiple equilibria in epidemic models with structured immunity. J Theor Biol. 2008;252:155–165. doi: 10.1016/j.jtbi.2008.01.014. [DOI] [PMC free article] [PubMed] [Google Scholar]
- 38.Lavine J, Broutin H, Harvill ET, Bjørnstad ON. Imperfect vaccine-induced immunity and whooping cough transmission to infants. Vaccine. 2010;29:11–16. doi: 10.1016/j.vaccine.2010.10.029. [DOI] [PMC free article] [PubMed] [Google Scholar]
- 39.Conlan AJK, Rohani P, Lloyd AL, Keeling M, Grenfell BT. Resolving the impact of waiting time distributions on the persistence of measles. J R Soc Interface. 2010;7:623–640. doi: 10.1098/rsif.2009.0284. [DOI] [PMC free article] [PubMed] [Google Scholar]
- 40.Grenfell BT, Anderson RM. Pertussis in England and Wales: An investigation of transmission dynamics and control by mass vaccination. P Roy Soc Lond B Bio. 1989;236:213–252. doi: 10.1098/rspb.1989.0022. [DOI] [PubMed] [Google Scholar]
- 41.Hethcote HW. Simulations of pertussis epidemiology in the United States: Effects of adult booster vaccinations. Math Biosci. 1999;158:47–73. doi: 10.1016/s0025-5564(99)00004-8. [DOI] [PubMed] [Google Scholar]
- 42.Gomes MGM, White LJ, Medley GF. Infection, reinfection, and vaccination under suboptimal immune protection: Epidemiological perspectives. J Theor Biol. 2004;228:539–549. doi: 10.1016/j.jtbi.2004.02.015. [DOI] [PubMed] [Google Scholar]
- 43.Fine PE. Herd immunity: History, theory, practice. Epidemiol Rev. 1993;15:265–302. doi: 10.1093/oxfordjournals.epirev.a036121. [DOI] [PubMed] [Google Scholar]
- 44.van Boven M, de Melker HE, Schellekens JF, Kretzschmar M. Waning immunity and sub-clinical infection in an epidemic model: implications for pertussis in the Netherlands. Math Biosci. 2000;164:161–182. doi: 10.1016/s0025-5564(00)00009-2. [DOI] [PubMed] [Google Scholar]
- 45.Bolker BM. Ecological Models and Data in R. Princeton, NJ: Princeton University Press; 2008. [Google Scholar]
- 46.Broutin H, Guegan JF, Elguero E, Simondon F, Cazelles B. Large-scale comparative analysis of pertussis population dynamics: periodicity, synchrony, and impact of vaccination. Am J Epidemiol. 2005;161:1159–1167. doi: 10.1093/aje/kwi141. [DOI] [PubMed] [Google Scholar]
- 47.Earn DJ, Rohani P, Bolker BM, Grenfell BT. A simple model for complex dynamical transitions in epidemics. Science. 2000;287:667–670. doi: 10.1126/science.287.5453.667. [DOI] [PubMed] [Google Scholar]
- 48.Rohani P, Keeling M, Grenfell B. The interplay between determinism and stochasticity in childhood diseases. Am Nat. 2002;159:469–481. doi: 10.1086/339467. [DOI] [PubMed] [Google Scholar]
- 49.Gomes MGM, White LJ, Medley GF. The reinfection threshold. J Theor Biol. 2005;236:111–113. doi: 10.1016/j.jtbi.2005.03.001. [DOI] [PubMed] [Google Scholar]
- 50.Bisgard KM, et al. Infant pertussis: Who was the source? . Pediatr Infect Dis J. 2004;23:985–989. doi: 10.1097/01.inf.0000145263.37198.2b. [DOI] [PubMed] [Google Scholar]
- 51.Cherry JD. Pertussis vaccines for adolescents and adults. Pediatrics. 2005;116:755–756. doi: 10.1542/peds.2005-0960. [DOI] [PubMed] [Google Scholar]
- 52.Mattoo S, Cherry JD. Molecular pathogenesis, epidemiology, and clinical manifestations of respiratory infections due to Bordetella pertussis and other Bordetella subspecies. Clin Microbiol Rev. 2005;18:326–382. doi: 10.1128/CMR.18.2.326-382.2005. [DOI] [PMC free article] [PubMed] [Google Scholar]
Associated Data
This section collects any data citations, data availability statements, or supplementary materials included in this article.