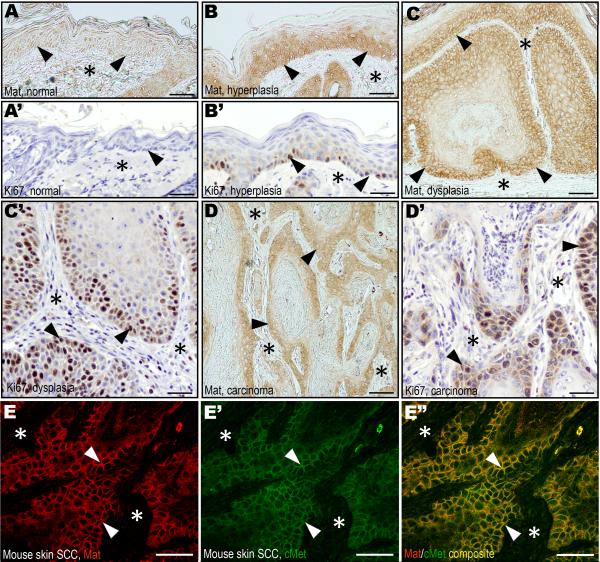
Figure 2. Matriptase and c-Met expression in mouse squamous cell carcinogenesis mirrors human HNSCC.
Matriptase (A–D) and Ki67 (A'–D') immunohistochemistry of normal epidermis (A and A'), hyperplasia (B and B'), dysplasia (C and C'), and squamous cell carcinoma (D and D') during murine chemical multi-stage carcinogenesis. Expression of matriptase in proliferating basal keratinocytes of hyperplastic and dysplastic lesions (examples with arrowheads in B and C) as well as in tumor cells at the invasive front (examples with arrowheads in D), but not in basal keratinocytes of normal epidermis (examples with arrowheads in A). The keratinocyte and tumor cell compartments expressing matriptase have high rates of proliferating cells as shown by expression of Ki67 (examples with arrowheads B', C', and D'). Stars in A–D' indicates the location of the dermis or the tumor stroma. E–E". Double immunofluorescence staining of squamous cell carcinoma for matriptase (E, red, examples with arrowheads) and c-Met (E', green, examples with arrowheads). Overlay in E" shows co-localization of matriptase and c-Met on the tumor cell surface (yellow, examples with arrowheads). Stars in E–E" shows location of the tumor stroma. Size bars: A–B', C, and D, 50 μm; C', D', E–E", 25 μm.

