

Abstract
We report a rapid method for the direct multicolor imaging of multiple subnuclear genetic sequences using novel quantum dot-based fluorescence in situ hybridization (FISH) probes (QD–FISH). Short DNA oligonucleotides were attached on QDs and used in a single hybridization/detection step of target sites in situ. QD–FISH probes penetrate both intact interphase nuclei and metaphase chromosomes and showed good targeting of dense chromatin domains with minimal steric hindrances. We further demonstrated that QD’s broad absorption spectra allowed different colored probes specific for distinct subnuclear genetic sequences to be simultaneously excited with a single excitation wavelength and imaged free of chromatic aberrations in a single exposure. Thus, these results demonstrate that QD–FISH probes are very effective in multicolor FISH applications. This work also documents new possibilities of using QD–FISH probes detection down to the single molecule level.
Index Entries: Quantum dots, FISH, DNA, heterochromatin, centromere, fluorescence, imaging, microscopy, hybridization, biomaterial, nanotechnology
INTRODUCTION
Fluorescence in situ hybridization (FISH) of nucleic acid-labeled probes provides a direct visualization of the spatial location of specific DNA or RNA sequences at a particular cellular or chromosomal site and in tissue sections. Such morphological and topological information about the localization of the target sequence has been invaluable for both fundamental and applied research, including studies of gene organization, function and regulation during embryo development, detection of viral infections, and chromosome rearrangements associated with genetic disorders (1). FISH has the capacity to simultaneously visualize different targets in multiple, distinct colors. However, because of the spectral overlap of commonly used organic fluorophores, the number of probes identifiable on the basis of a unique fluorescence color is typically limited. Also, the multiple wavelengths required to excite polychromatic specimens further introduce chromatic aberrations that can reduce the reliability of multicolor fluorescent probes co-localization measurements. Finally, rapid photobleaching of most organic dyes may further compromise imaging of the sample.
Nano-sized semiconductor crystals known as quantum dots (QDs) have emerged as new fluorescent labels that possess several optical properties that could fundamentally overcome these limitations (2). First, QD’s emission wavelength can be fine-tuned anywhere from the ultraviolet (UV) to the infrared by means of material composition and size from quantum confinement effects. Second, QDs have very narrow and symmetric emission bands (25–30 nm full width at half maximum) allowing multiple colors of QDs to be used with minimal spectral overlap. Third, QDs have a wide absorption band therefore allowing all of the possible QD colors to be simultaneously excited with a single narrow-band excitation source and distinguished in a single exposure, thus eliminating chromatic aberrations. Fourth, QDs are very photostable and emit many more photons per particle compared to dye molecules.
A recent study has shown that the superior in situ photostability of QD-labeled FISH probes compared with conventional organic dyes can improve quantitation of the FISH signals (3). However, QD usage in FISH has thus far been limited to single-color detection of single genetic targets (3,4). Current limitations to multiplexing include the paucity of robust chemistry to bioconjugate DNA probes directly to QDs (4) and the lack of availability of diverse hapten-functionalized QDs to allow multicolor secondary detection schemes (3). Finally, it has remained unclear whether the 10 to 20 times larger size (compared with the size of conventional organic dyes) of the QDs would limit their use in multicolor FISH applications.
Here, we report the preparation of novel QD–FISH probes based on the direct attachment of short DNA oligonucleotides onto QDs and their use in multicolor FISH analysis. We show in a proof-of-principal experiment that two QD–DNA probes with different emission spectra could be used in a one-step hybridization/detection experiment to visualize in situ two subchromosomal regions of highly condensed chromatin structure within the centromere. QD’s broad excitation spectrum allowed the two different color probes to be simultaneously excited by a single excitation wavelength and distinguished in a single exposure using standard far-field optics. These results demonstrate that QD–DNA probes are very effective in multicolor FISH applications and may offer the opportunity to achieve true multicolor identification and analysis of chromosomal structures at high resolution.
MATERIALS AND METHODS
Cell Culture and Fixation
The mouse mast cell line P815 and the human cervical epithelial cancer cell line HeLa (cat. no. TIB 64 and CCL-2, respectively, American Type Culture Collection, Manassas, VA) were maintained in complete Dulbecco’s modified Eagle’s medium (Gibco-Invitrogen, Carlsbad, CA) supplemented with 5% fetal calf serum, L-glutamine, and antibiotics. Cultures were kept at 37°C in 5% CO2 and maintained at 80% confluence. Metaphase spreads were prepared by hypotonic treatment of Colcemid-treated cell cultures (KaryoMax, Gibco-Invitrogen) and fixed in 3:1.5 (v/v) methanol/glacial acetic acid. Cells were then dropped on glass cover slips following standard procedures.
Reagents
All reagents were of analytical grade. Qdot Streptavidin Conjugates 525, 565, 585, 605, and 655 nm were purchased from Quantum Dot Corporation (Hayward, CA). Some early lots of 525, 592, 611, and 655 nm QDs were also provided from the same manufacturer for beta testing.
Preparation of QD–DNA Complexes
QD–DNA complexes were formed by incubation of biotinylated DNA oligonucleotides with QDs at various molar ratios at room temperature for 30 min. Remaining free streptavidin sites were further blocked with an excess of biotin. QD–DNA complexes were analyzed by electrophoresis on a 2% agarose gel in Tris-Borate-EDTA (TBE) 0.5% and characterized by electromobility shift assay. Single-stranded DNA was counterstained with SYBR Green II (Molecular Probes, Eugene, OR). The migration patterns of the QDs and the DNA were each spectrally determined with a MultiImager FX System (Bio-Rad, Hercules, CA) as follow: QDs (532 nm green laser excitation, 640-nm band pass (640 BP) red emission filter) and SYBR Green DNA (488-nm blue laser excitation, 530 BP green emission filter). Titration of the complexes were performed for each individual sequences. For most experiments a 1:12 molar ratio of QD–DNA was used. QD–DNA complexes were diluted in hybridization buffer (25% deionized formamide, 2X standard sodium chloride-sodium citrate [SSC], 200 ng/μL sheared salmon sperm DNA, 5X Denhardt’s, 50 mM sodium phosphate, pH 7.0, and 1 mM EDTA) at a final concentration of 1 to 5 ng/μL probe and either used directly or further purified over a S300 size exclusion spin column (Amersham Biosciences, Piscataway, NJ) to remove small amounts of unbound ligands (streptavidin, biotin, and oligonucleotides). The QD-probe mixture was stored at −20°C and the fluorescence was stable for several weeks.
Oligonucleotide Sequences
Oligonucleotides were synthesized on an Applied Biosystems 392 DNA/RNA synthesizer (Foster City, CA) or obtained from Invitrogen Corporation (Carlsbad, CA). Biotin or Texas Red was linked to the 5′ end of the oligonucleotide through a hexamethylene linker. Mouse sequences used in this study are the following: Major γ-satellites: 5′-ATT TAG AAA TGT CCA CTG TAG GAC-3′, 5′-CCT WCA GTG TGC ATT TCT CAT TTT TC-3′; minor satellites: 5′-TGA TAT ACA CTG TTC TAC AAA TCC CG-3′. An irrelevant oligonucleotide: 5′-GGG TGT GTC CTG TCG TAG GTA AAT AAC TGA-3′ specific to Lambda phage DNA was used as a negative hybridization control (a gift from J. Antelman, Department of Chemistry and Biochemistry, UCLA). Sense and anti-sense oligonucleotides used in the liquid hybridization assay described in Fig. 1 are: 5′-GGG TTA GGG TTA GGG TTA GGG TTA GGG TTA GGG TTA-3′ and 5′-TAA CCC TAA CCC TAA CCC TAA CCC TAA CCC TAA CCC-3′, respectively.
Fig. 1.
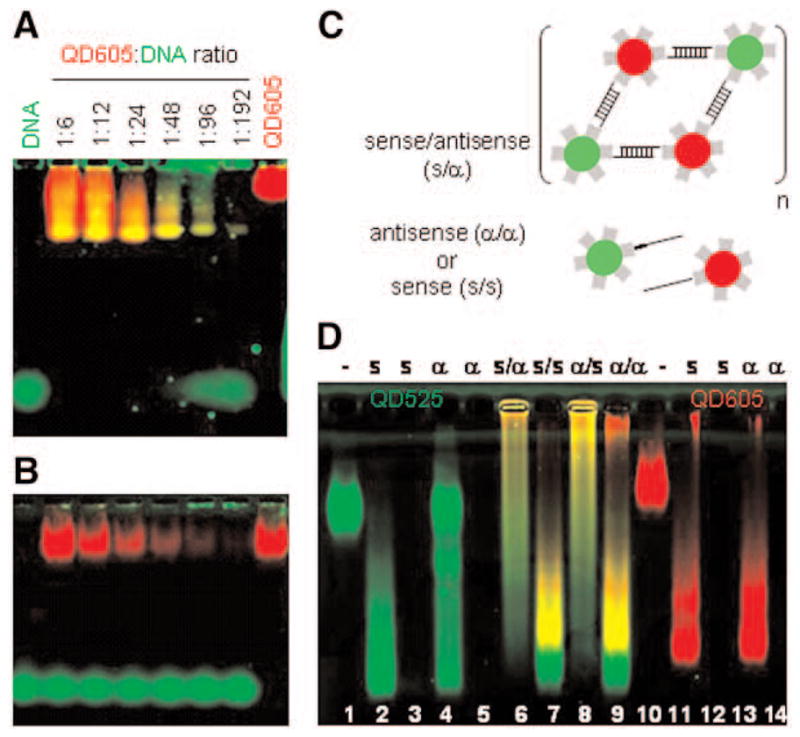
Preparation and characterization of QD–DNA complexes used in FISH. (A) Decreasing amounts of streptavidin-coated QD605 (red) incubated with biotinylated DNA oligonucleotides (green fluorescence originating from the SYBR green counterstaining) were electrophoresed on a 2% agarose gel in TBE 0.5%. Free DNA (left lane) migrates faster than QD–DNA conjugates (middle lanes) that migrate faster than QDs alone (right lane). Changes in mobility of the QD–DNA complexes correlate with yellow fluorescence color co-localization. (B) Control experiment with the same DNA sequence but unbiotinylated. (C) Schematic of liquid-phase hybridization with two color QDs functionalized with combinations of sense or antisense oligonucleotides. Recognition and hybridization of two self-complementary (S/α) sequences should results in the formation of large aggregates. (D) Gel electrophoresis of various combinations of one and two color sense or antisense QD–DNA probes after liquid-phase hybridization. Lanes 1 and 10: QDs alone (green 525 nm, red 605 nm, respectively), no DNA; Lanes 3, 5, 12, and 14: DNA alone, no QDs. Lanes 2 and 4: green QD525-DNA complexes (sense and anti-sense, respectively); Lanes 11 and 13: red QD605–DNA complexes (sense and antisense, respectively); Lanes 6 to 9: hybridization challenges with two colors of sense or antisense QD–DNA probes (green and red).
In Situ Hybridization Procedure
Slides were pretreated for hybridization by a 0.01% pepsin digestion in 0.01 M HCl for 5 min at 37°C followed by a short wash in 2X SSC, dehydrated in 70, 90, and 100% graded ethanol series and air-dried. Target sequences were denatured for 2 min in 70% formamide, 2X SSC, pH 7.0, at 70°C followed by 70, 90, and 100% ice-cold graded ethanol series and air-dried. Hybridization of the probe was done by pipetting 14 μL of the QD–DNA probe hybridization mixture onto the cells. The slides were then baked for 3 min at 85°C and incubated overnight at 37°C in a humidified closed chamber (humidifier is 25% formamide, 2X SSC). Successive posthybridization washes in 2X SSC (37°C for 10 min, four times), 0.1 M Tris-HCl, pH 7.4, 0.15 M NaCl, 0.05% Tween-20 (room temperature for 5 min, two times) were used to remove nonspecifically bound and unbound probe from the cell preparations. Stained cells were mounted on slides in 90% (v/v) glycerol-10% phosphate-buffered saline with coverslips. QD fluorescence was stable for several weeks at 4°C in the dark, but showed irreversible time-dependent decay. In control experiments, antibody detection of the biotin or digoxigenin labels was essentially as described by Dirks et al. (5) with three antibody detection steps. Mounting was in DAPI/DABCO: Vectashield (1:1) in 90% glycerol.
Fluorescent Confocal Microscopy
Samples were photobrightened with UV and imaged on a Leica TCS SP2 AOBS confocal microscope (Leica Microsystems Inc., Exton, PA) using a 405-nm diode laser (Coherent Inc., Santa Clara, CA) for excitation. The fluorescence spectrum of each QD–FISH probe, in the hybridization buffer, was first directly recorded in situ on the microscope and used to optimally set the detection range around the symmetric narrow-shape emission typical of each QD probe. Images were acquired with a 63X oil-immersion objective (HCX PL APO, NA 1.40) and analyzed with the Leica software. All QDs were excited with a single 405-nm diode laser, and multicolor images were acquired in a simultaneous scan. Unless otherwise specified, the QD’s fluorescence was detected in a 20-nm spectral window around their emission peaks. Scanning was performed at a line frequency of 200 Hz, averaged two to four times, and the image format was 512 × 512 or 256 × 256 pixels. Autofluorescence of the nuclei was collected through a band pass filter centered at 460 nm to assess nuclear and cellular morphology. Autofluorescence was used instead of the more conventional DAPI counterstaining because it interfered with QD fluorescence on 405 nm excitation. Images were further processed with Adobe Photoshop 5.0 (San Jose, CA).
RESULTS
For our studies, we prepared QD–DNA FISH probes by incubating streptavidin-coated QDs (Quantum Dot Corp.) with single-stranded biotinylated DNA oligonucleotides. Formation of the QD–DNA complexes was titrated by electromobility shift assay on agarose gels and analyzed by multicolor fluorescence analysis using a combination of 532-nm green laser excitation and 640 BP red emission filter to detect the red QDs (605-nm emission) and a 488-nm blue laser excitation and a 530 BP green emission filters to detect the single-stranded DNA after counter-staining with SYBR Green II gel stain (Molecular Probes) (Fig. 1). The conjugation of the DNA on the nanoparticles was demonstrated by faster mobility of the complexes (caused by a negative net charge increase) and by co-localization of both the QDs and the DNA fluorescent signals (Fig. 1A). The slight smearing of the QD–DNA complexes onto the agarose gel is likely to be the consequence of variations in the number of biotin sites (i.e., the number of streptavidin molecules) available on each QD that gives rise to particles with slightly different net charges after coating of the nanocrystals with the DNA. The size heterogeneity of the QDs themselves does not contribute to that phenomenon because bare QDs (without DNA) migrate homogeneously as a single band in the agarose gel (Fig. 1A, left lane; Fig. 1B). Moreover, no changes in gel mobility or color co-localization were observed when the same but unbiotinylated DNA sequence was used, which demonstrate that there is little nonspecific DNA adsorption onto the QDs (Fig. 1B).
We then asked if this geometry was optimal to preserve the availability of the DNA for hybridization to complementary sequences in solution by testing various combinations of sense and antisense oligonucleotide sequences. Only self-complementary sequences (i.e., a sense [S] with an antisense [α] sequence) should form hybridization aggregates as depicted in Fig. 1C. Indeed, Fig. 1D shows that two colors of QD–DNA probes hybridize to each other only when their sequences are complementary (lanes 6 and 8, S/α and α/S) but not when they are identical (lanes 7 and 9, S/S and α/α). The large hybridization aggregates that result run as a smear in the agarose gel owing to their great size heterogeneity.
All together, these results demonstrate that QD-DNA probes are fully functional and solely hybridize to self-complementary targets.
We first tested QD–DNA FISH probes against the major (γ) family of mouse satellite DNA. γ-Satellites are high-copy DNA repeats that localize to centromeric heterochromatin domains in mouse metaphase chromosomes (6). Figure 2A,B shows typical images of such domains visualized with a γ-satellite Texas Red probe on an interphase nucleus and a metaphase–chromosome spread, respectively. Large fluorescent foci tend to localize at the periphery of the interphase nucleus, whereas the same probe labels specifically every centromere in metaphase chromosomes.
Fig. 2.

Visualization of centromeric heterochromatin domains by QD–FISH. (A) A Texas Red γ-satellite repeat probe produces large fluorescent foci at the periphery of the interphase nucleus. (B) The same probe labels almost every centromere in metaphase chromosomes. DAPI counterstaining is shown in blue. (C,D) Labeling signals of a γ-satellite QD655 probe (405 nm Excitation, 655 ± 10 nm Emission) merged with autofluorescence (pseudo-colored in blue; 405 nm Excitation, 460 nm ± 30 nm Emission). (E,F) No γ-satellite hybridization signals are detected either when the same mouse P815 cells are hybridized with an irrelevant QD655-FISH probe (E) or when the human HeLa cells are hybridized with the γ-satellite QD655 probe (F). Scale bar: 4 μm.
Figure 2C,D shows that the same probe conjugated to QD655 generates qualitatively comparable hybridization patterns. The QD–FISH probe shows good signal-to-noise ratio and comparable penetration/efficiency to its Texas Red counterpart, which ranges from nearly 100% targeting efficiency in interphase nuclei to 93.5% on metaphase chromosomes (Table 1). The specificity of both the hybridization procedure and the γ-satellite QD-FISH probe were accessed by performing, in parallel, negative-control hybridizations either with an irrelevant oligonucleotide QD655-FISH probe against the same mouse P815 cell line (Fig. 2E) or by using the mouse γ-satellite QD655-FISH probe against the human HeLa cell line (Fig. 2F). Changing the oligonucleotide probe sequence and the endogenous target sequence both prevented proper targeting because no hybridization signals were detected (Figs. 2E,F, respectively). Both negative hybridization results demonstrated the specificity of the hybridization of the γ-satellite QD–FISH probe to its proper mouse target.
Table 1.
Summary of Hybridizations of Centromeric Heterochromatin Domains in P815 Mast Cells
| Type of probe | γ-Satellite hybridization signals
|
|
|---|---|---|
| Interphase nuclei (%) | Metaphase chromosomes (%) | |
| Texas Red labeled | 39/39 (100) | 187/200 (93.5) |
| QD655 labeled | 49/49 (100) | 196/210 (93.5) |
To further confirm proper targeting of the γ-satellite’s QD probe, we performed a sequential dual-color hybridization experiment with two oligonucleotides labeled with QD592 or with Texas Red. As shown in Figs. 3C and 3F, co-localization of the two color probes results in a yellow fluorescent signal for the merged images. We found that the majority of the chromosomes were doubly labeled in any metaphase examined.
Fig. 3.

Dual hybridization with two interspersed γ-satellite probes labeled with QDs and an organic fluorophore. (A,D) Texas Red: 543 nm Excitation, 655 ± 20 nm Emission; (B,E) QD592: 405 nm Excitation, 589 ± 5 nm Emission (C,F) Merge with autofluorescence (pseudo-colored in blue): 405 nm Excitation, 460 nm ± 30 nm Emission Image acquisition of double-stained samples was recorded in sequential order to minimize crosstalk between the different channels. Scale bar: 4 μm.
Taken together, these experiments demonstrate that oligonucleotide-based QD–FISH probes are able to penetrate intact interphase nuclei or metaphase chromosomes and detect subchromosomal genetic sequences with good specificity. They can also be used simultaneously with standard dyes.
We have successfully tested a number of other QD colors (565, 585, 592, 605, and 611 nm) that performed equally well in that assay, with the notable exception of QD525, which showed an irreversible spectral shift on hybridization that precluded its subsequent use in FISH (data not shown). We observed that the fluorescence intensity of the QD–FISH probes markedly decreases during the hybridization procedure but could be recovered on re-exposure to bright light. Figure 4 shows a typical photoactivation time course of QD655 fluorescence following γ-satellite FISH. On continuous exposure to a 405-nm violet diode laser delivering 10 nW at the sample (as measured with a Newport model 1830-C optical power meter), the fluorescence of the targeted QDs increased over several intervals before reaching a plateau after about 3 min (Fig. 4A–E). The fluorescence increase is extensive and not the result of changes in the intensity of the exciting light in the different pictures that were taken under the same illumination. An average photo-brightening time constant of about 66 s was obtained by fitting the observed intensity increase of the different QD images of two heterochromatin domains (Fig. 4E,F, areas 2 and 3) with a model function converging exponentially to its final intensity asymptotic value after approx 200 s.
Fig. 4.

Photoactivation of QD fluorescence following FISH. P815 cells were hybridized with a γ-satellite QD655 probe to visualize the centromeric heterochromatin domains. Cells were exposed to 10 nW of 405-nm laser light. Cells were imaged on the confocal microscope and scanned at a line frequency of 800 Hz with no averaging using a 655 ± 10 nm detection window. Time-lapse images were taken every second for 10 min. Selected images are shown at 0 s (A), 50 s (B), 100 s (C), 150 s (E), and 200 s (E). The white dotted circle indicates the border of the cell nucleus. (F) The integrated pixel intensities of two centromeric heterochromatin domains from the cell nucleus (areas 2 and 3) were plotted together with the total pixel intensity of a neighboring control area of equal size (area 1). Areas 2 and 3 point to nuclear QD patches that brighten after illumination, whereas the control area 1 shows no brightening but photobleaching of the background fluorescence. The photobrightening time constants were obtained by fitting the observed intensity increase of the time-lapse images with a model function converging exponentially to its asymptotic value (area 3: t1 = 70.7 ± 9.7 s; area 2: t1 = 62.4 ± 4.6 s). The background or autofluorescence bleaching time constants (t1 = 36.6 s and approx 25 min, amplitude ratio 5:1) were similarly obtained by fitting the observed intensity decay of a background spot with a sum of two exponential decays. Scale bar: 4 μm.
These results show that although the fluorescence of the QDs apparently dimmed after FISH, they are markedly photoactivable, increasing by approximately twofold within minutes after exposure to bright light.
Intermittence in emission (known as blinking) has been universally observed for single QDs (7,8) and was also readily visible within bright regions of hybridization at the centromere and in interphase nuclei in QD–FISH, whereas no such flickering was noted in control slides detected with Texas Red. Figure 5 shows intensity time traces recorded with a CCD camera at the periphery of centromeric heterochromatin domains that are typical of CdSe single-molecule QDs (red curves). No blinking was observed outside the hybridization signal areas (black curves). We further investigated conditions that had been described in the literature to help suppress QD blinking by using thiol-containing buffers such as 2β-mercaptoethanol (βME) (9). Figure 5B shows that blinking was slightly reduced but not totally suppressed in the presence of 140 mM βME.
Fig. 5.
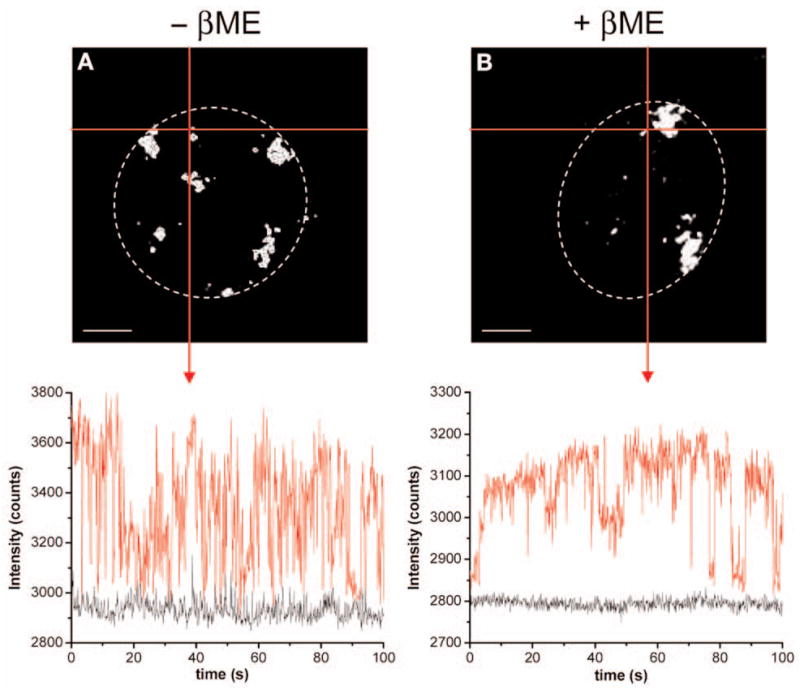
QD blinking on labeled centromeric heterochromatin domains in P815 cell nuclei. (A) γ-satellite hybridization signals were imaged with an inverted wide-field Zeiss Axiovert 100 TV microscope equipped with a PL APO 63x/1.4 aperture oil objective (Carl Zeiss MicroImaging Inc, Thornwood, NY) and a CCD camera (Photometrics Coolsnap HQ, Roper Scientific, Trenton, NJ). QD655 were excited using a 100 W mercury arc lamp and imaged with a combination of 530-nm long pass (LP) Excitation, 507-nm dichroic LP (DRLP), and 600-nm LP Emission filters (upper panel). The white dotted circle indicates the border of the cell nucleus. Images were acquired every 100 ms for 100 s in Metamorph 6.3 (Molecular Devices Corporation, Sunnyvale, CA) and intensity time traces were generated using Asterix software (Dr. Xavier Michalet, UCLA) written in LabVIEW 7.1 (National Instrument Corp., Austin, TX). The intersection of the two red lines (corresponding to an area of 5 × 5 pixels) points to the location for which the intensity time trace is shown (red curve, lower panel). It is plotted against the background fluorescence intensity measured in a dark area (5 × 5 pixels) of the nucleus (black curve, lower panel). (B) Same experiment following the addition of 140 mM 2β-mercaptoethanol (βME). Scale bar, 4 μm.
Having successfully detected one subnuclear target with one QD–FISH probe, we then asked if we could simultaneously detect multiple targets with distinct QD–FISH probes. To test this, we further investigated the fine structure of the centromere with two-color QD probes: a γ-satellite QD592 probe and a minor satellite QD655 probe that targets another but 10 to 20 times less abundant class of repetitive DNA sequences also associated within or close to the centromeres (10). The two-color probe hybridization mixture was first spectrally recorded directly on the confocal microscope on excitation with the 405-nm blue diode laser to characterize (and correct for) any spectral shifts in the hybridization buffer. The detection range was set to ± 10 nm around the maximum emission pick for each QD–DNA probe. Figures 6B and 6H show color images where both satellite-QD592 and -QD655 probes are readily distinguished in a single exposure after single-wavelength excitation at 405 nm. The two satellite probes are in close proximity, but are spatially independent in the interphase cell as co-localization appears randomly (Fig. 6B). They do, however, co-localize precisely at the centromeres of metaphase chromosomes (Fig. 6H). The minor satellite repeats appear as sharp doublet signals at the centromeres with the exception of one pair of large foci of more intense staining (Figs. 6G and 6H, double and single arrow, respectively) also seen with the Texas Red control (Fig. 6D,E). At the level of resolution afforded, both satellite repeats appear to be arranged as discrete blocks with little interspersion of the two satellite DNA sequences with the red minor satellite signal being located closer to the short arm of the acrocentric mouse chromosome than the major satellite green signal (Fig. 6F–H). Thus, a complex mixture of QD–FISH probes successfully resolved the structural domain organization of condensed pericentromeric chromatin regions with good spatial resolution despite their larger size compared with conventional organic dyes FISH probes. These experiments demonstrate that QD–DNA conjugates allow direct and simultaneous multicolor detection of subnuclear genetic targets on single wavelength excitation.
Fig. 6.

Double target detection using two colors QD probes and a single wavelength excitation at 405 nm. (A,C–E) Dual color hybridization with γ- and minor satellite probes (FITC and Texas Red, respectively). Minor satellites staining appear as a sharp doublet signal at the centromeres (double arrow) with the exception of one pair of large foci of more intense staining (single arrow). DAPI counterstaining is shown in blue. (B,F–H) Same experiment with a mixture of QD592 and QD655 probe γ- and minor satellites, respectively. Detection windows used: QD592 (592 ± 10 nm); QD655 (655 ± 10 nm); autofluorescence (460 nm ± 30 nm). Multicolor images were acquired simultaneously. Scale bar: 4 μm.
DISCUSSION
The present study reports a novel rapid and sensitive FISH method using site-specific DNA sequences directly conjugated to semiconductor QDs. We have used high and low repetitive satellite DNA probes involving high-resolution single and bicolor FISH. We have tested different types of cytological preparations, including metaphase and interphase lymphocytes with positive results.
The performance characteristics of QDs, which are significantly brighter and more photostable than those of analogous fluorescein and Texas Red dyes (3), allowed us to visualize the process of hybridization under a coverslip during the renaturation of the probe and target DNA in situ and therefore to control both the efficiency of hybridization before the termination of the experiment and the efficiency of the washing of slides by microscopic inspections; and analyze the specimens under the microscope for minutes to hours. The use of directly labeled QD–DNA probes offer several additional advantages for FISH studies because of the elimination of secondary detection steps and the visualization of hybridization results in a “one-step” procedure; the low background fluorescence; and the increased potential for multicolor probe detection. Indeed, our directly labeled QD–DNA probes approach provides the first exploration of QD–FISH multiplexing applicability. The only other published study that detects the hybridization sites in situ of biotinylated probes with QDs used them as a secondary reagent and thus is intrinsically limited to single-color detection (3) because it implies, as in conventional FISH, that multiple DNA probes must be detected in separate, nonoverlapping detection schemes to prevent their cross-detection. The same ligand–receptor binding pair (i.e., biotinylated probes and streptavidin-functionalized QDs) cannot easily allow the detection of multiple probes with multiple QD colors. Each new color in the detection scheme would require QDs functionalization with a new hapten. On the contrary, our approach, which relies on preformation of the QD–DNA probes (by direct attachment of the DNA onto the QDs), allows the same biotin–streptavidin interaction to be used to generate an infinite array of DNA FISH probes that can be used in a single step to detect multiple subnuclear genetic sequences with multiple colors. This strategy replaces the use of multiple haptens by one universal binding pair.
Despite being 10 to 20 times larger than dye-labeled probes, QD–DNA probes performed well in targeting dense and highly compact centromeric heterochromatin domains. FISH efficiency is high because virtually most interphase nuclei and metaphase chromosomes harbor satellite FISH signals (see Table 1). This is in sharp contrast with a previous study by Xiao et al. showing that most centromeric regions on human metaphase chromosomes could not be detected with QD labels (3). We would like to suggest that this unexpected difference in sensitivity/efficiency of signal distribution is likely caused by variable steric hindrance constraints operating at different time along the FISH procedure. Indeed, whereas heterochromatin-embedded probes might be sheltered from the QD labels during post-hybridization detection because of steric hindrance (3), QD–DNA probes have greater access to the unwinded double-stranded DNA target at the time of hybridization (i.e., this work). Taken together, our results support the notion that steric hindrances have little effect at the time of annealing of the QD–DNA probes to its target but may limit QD’s access at the time of detection.
Semiquantitative analysis of fluorescent images using a CCD camera showed that the number of QDs present at the hybridization sites varied from approx 10 to 250 QDs (Table 2 and data not shown) depending on the size polymorphism of the centromeric repeat arrays of the different mouse chromosomes. Despite the fact that the absolute length of these long, uninterrupted tandem arrays is not known (because of an inherent mapping/assembly problem after sequencing), the number of targeted QDs appears far less than the estimated several thousands of tandem repeats of satellite DNA monomers organized in discrete blocks at the centromere of mouse chromosomes (6,10). Three main factors might account for the apparent paucity of QDs seen at the FISH signals. First, it is possible that the bulky nature of the QDs prevent them from homogenously targeting the entire three-dimensional structure of the satellite array despite their overall great efficiency (see Table 1). Second, fluorescence correlation spectroscopy analysis in solution has revealed that up to 50% of all QDs are in a dark state and do not fluoresce (11). Last, the recorded total signal intensity can be affected by the stochastic QD blinking behavior within FISH signals and the power law distribution of on and off time that is characteristic of QDs (12). This means that long integration time will not increase the brightness of a given spot linearly with time, precluding any reliable probe quantification based solely on intensity measurements. In other words, two different FISH signals resulting from approximately the same number of QDs may still show variability in brightness in ensemble imaging.
Table 2.
Estimated Number of QDs Hybridized on Centromeric Heterochromatin Domains in P815 Mast Cells
| Nucleia | γ-Satellite Hybridization Signalsb |
||||||
|---|---|---|---|---|---|---|---|
| 1 | 2 | 3 | 4 | 5 | 6 | 7 | |
| Cell 1 | 9c | 39 | 42 | 14 | 15 | 26 | 49 |
| Cell 2 | 57 | 48 | NA | NA | NA | NA | NA |
Same as those displayed in Fig. 5.
Numbering starts at the intersection of the red cross in Fig. 5 and goes clockwise.
The estimated number of QDs was calculated by dividing the total intensity counts of a given centromeric heterochromatin domain by the averaged intensity count of a single QD (assumed here to be constant) extracted from the intensity time traces minus the total pixel intensity of a neighboring control area of equal size.
Addition of 140 mM βME did not overcome that intrinsic limitation of QD blinking similarly to what has been also recently observed in fixed, permeabilized cells that had endocytosed QDs (13). Yet, Hohng and Ha have shown that blinking suppression was already efficient at 1 mM βME on bare, spin-coated QDs and suggested that the reduction of blinking was a direct result of the thiol groups binding to the ZnS surface (9). This discrepancy might thus indicate some accessibility issues of small thiol molecules in fixed cytological materials.
In the course of these experiments, we observed a partial loss of fluorescence of the QD–FISH probes. However, bright fluorescence intensity can be fully recovered on re-exposure to UV light, similar to what has been observed for QDs in nonaqueous solvents (14) and, more recently, inside fixed mammalian cells after QD endocytosis (13). As expected, the photo-brightening time constant (approx 66 s) appears to be an intrinsic property of the QDs, independent of the size of the targeted heterochromatin domains and thus of the number of QDs at the hybridization site. By contrast, the fluorescence saturation intensity value is directly proportional to the size of the heterochromatin regions and reflects the number of QDs targeted in situ (Fig. 4F).
The ultimate resolution in cytogenetics is reached by wiping out nuclear organization altogether and conducting FISH on DNA fibers that have been affixed to glass (15–18). Although morphological information is lost, what was condensed in an interphase or metaphase FISH spot becomes a long fluorescent line in fiber-FISH. Because QD blinking demonstrates single QD detection bound to chromosomes, it should then be possible to apply QD–FISH probes in fiber-FISH to analyze the still poorly understood structural organization of long tandem repeat arrays or to detect small-scale rearrangements in chromosomes. Given that the same laser wavelength excites all QD probes, the effects of chromatic aberrations are minimized. Thus, in principle, the concomitant development of ultrasensitive microscope instrumentations will allow the use of QD–FISH probes for ultra-high-resolution co-localization of multicolor fluorescent probes with nanometer accuracy down to the single DNA molecule (19) or single QD detection level (20).
In summary, we have demonstrated simultaneous multicolor FISH imaging down to the subchromosomal level using QD-based probes. Coupling hybridization with detection without the need for laborious secondary amplification results in a faster, single-step FISH protocol. The biotin-streptavidin interaction can be used to generate an infinite array of QD–DNA FISH probes and the possibility of using them in a common hybridization mixture. Despite their larger size, QD probes show good targeting of dense chromatin structures and work well in conjunction with organic dyes under standard experimental FISH conditions. The results of this study indicate that QD–FISH probes may be applied as additional tools in molecular cytogenetics and may offer significant benefits in medical diagnostic. QD–FISH probes could be used in basic and clinical cytogenetic studies, both of which require high-resolution and multicolor FISH. Indeed, this new FISH method opens up new opportunities for the development of true color distinctive banding patterns for each chromosome and shows the proof-of-principle of multiplex FISH with spectrally distinguished QDs, rather than complex probe mixtures, which require sophisticated digital imaging analysis and pseudo-coloring (21–23). Further work with these new types of FISH probes will be needed to extend the potential of QDs to RNA detection of specific mRNA transcripts as well.
Acknowledgments
The authors would like to thank Dr. Xavier Michalet, for his critical reading of this manuscript as well as help with data analysis, and Tal Paley for editorial assistance. Fluorescent microscopy was performed at the CNSI Advanced Light Microscopy/Spectroscopy Shared Facility at UCLA. This work was funded by the National Institute of Health, grant no. R01 EB000312-04.
Footnotes
NOTE ADDED IN PROOF
As this manuscript went to press, Chan et al. published a similar QD–FISH method for the multiplex detection of mRNAs (24). Recent results by Xiao et al. suggest that pH effects on fluorescence of QD-detected hybridization signals could account for the absence of QD centromeric hybridization signals on human metaphase chromosomes in their FISH experiments (25).
References
- 1.Nederlof PM, van der Flier S, Wiegant J, et al. Multiple fluorescence in situ hybridization. Cytometry. 1990;11:126–131. doi: 10.1002/cyto.990110115. [DOI] [PubMed] [Google Scholar]
- 2.Michalet X, Pinaud FF, Bentolila LA, et al. Quantum dots for live cells and in vivo imaging, diagnostics and beyond. Science. 2005;307:538–544. doi: 10.1126/science.1104274. [DOI] [PMC free article] [PubMed] [Google Scholar]
- 3.Xiao Y, Barker PE. Semiconductor nanocrystal probes for human metaphase chromosomes. Nucleic Acids Res. 2004;32:e28. doi: 10.1093/nar/gnh024. [DOI] [PMC free article] [PubMed] [Google Scholar]
- 4.Pathak S, Choi SK, Arnheim N, Thompson ME. Hydroxylated quantum dots as luminescent probes for in situ hybridization. J Am Chem Soc. 2001;123:4103–4104. doi: 10.1021/ja0058334. [DOI] [PubMed] [Google Scholar]
- 5.Dirks RW, van de Rijke FM, Fujishita S, van der Ploeg M, Raap AK. Methodologies for specific intron and exon RNA localization in cultured cells by haptenized and fluorochromized probes. J Cell Sci. 1993;104:1187–1197. doi: 10.1242/jcs.104.4.1187. [DOI] [PubMed] [Google Scholar]
- 6.Vissel B, Choo KH. Mouse major (gamma) satellite DNA is highly conserved and organized into extremely long tandem arrays: implications for recombination between nonhomologous chromosomes. Genomics. 1989;5:407–414. doi: 10.1016/0888-7543(89)90003-7. [DOI] [PubMed] [Google Scholar]
- 7.Nirmal M, Dabbousi BO, Bawendi MG, et al. Fluorescence intermittency in single cadmium selenide nanocrystals. Nature. 1996;383:802–804. [Google Scholar]
- 8.Banin U, Bruchez M, Alivisatos AP, Ha T, Weiss S, Chemla DSJ. Evidence for a thermal contribution to emission intermittency in single CdSe/CdS core/shell nanocrystals. Chem Phys. 1999;110:1195–1201. [Google Scholar]
- 9.Hohng S, Ha T. Near-complete suppression of quantum dot blinking in ambient conditions. J Am Chem Soc. 2004;126:1324–1325. doi: 10.1021/ja039686w. [DOI] [PubMed] [Google Scholar]
- 10.Joseph A, Mitchell AR, Miller OJ. The organization of the mouse satellite DNA at centromeres. Exp Cell Res. 1989;183:494–500. doi: 10.1016/0014-4827(89)90408-4. [DOI] [PubMed] [Google Scholar]
- 11.Doose S, Tsay JM, Pinaud F, Weiss S. Comparison of photophysical and colloidal properties of biocompatible semiconductor nanocrystals using fluorescence correlation spectroscopy. Anal Chem. 2005;77:2235–2242. doi: 10.1021/ac050035n. [DOI] [PubMed] [Google Scholar]
- 12.Kuno M, Fromm DP, Hamann HF, Gallagher A, Nesbitt DJ. No exponential “blinking” kinetics of single CdSe quantum dots: a universal power law behavior. J Chem Phys. 2000;112:3117–3120. [Google Scholar]
- 13.Silver J, Ou W. Photoactivation of quantum dot fluorescence following endocytosis. Nano Lett. 2005;5:1445–1449. doi: 10.1021/nl050808n. [DOI] [PubMed] [Google Scholar]
- 14.Hess BC, Okhrimenko IG, Davis RC, et al. Surface transformation and photoinduced recovery in CdSe nanocrystals. Phys Rev Lett. 2001;86:3132–3135. doi: 10.1103/PhysRevLett.86.3132. [DOI] [PubMed] [Google Scholar]
- 15.Heng HH, Squire J, Tsui LC. High-resolution mapping of mammalian genes by in situ hybridization to free chromatin. Proc Natl Acad Sci USA. 1992;89:9509–9513. doi: 10.1073/pnas.89.20.9509. [DOI] [PMC free article] [PubMed] [Google Scholar]
- 16.Wiegant J, Kalle W, Mullenders L, et al. High-resolution in situ hybridization using DNA halo preparations. Hum Mol Genet. 1992;1:587–591. doi: 10.1093/hmg/1.8.587. [DOI] [PubMed] [Google Scholar]
- 17.Parra I, Windle B. High-resolution visual mapping of stretched DNA by fluorescent hybridization. Nat Genet. 1993;5:17–21. doi: 10.1038/ng0993-17. [DOI] [PubMed] [Google Scholar]
- 18.Michalet X, Ekong R, Fougerousse F, et al. Dynamic molecular combing: stretching the whole human genome for high-resolution studies. Science. 1997;277:1518–1523. doi: 10.1126/science.277.5331.1518. [DOI] [PubMed] [Google Scholar]
- 19.Crut A, Geron-Landre B, Bonnet I, Bonneau S, Desbiolles P, Escude C. Detection of single DNA molecules by multicolor quantum-dot end-labeling. Nucleic Acids Res. 2005;33:e98. doi: 10.1093/nar/gni097. [DOI] [PMC free article] [PubMed] [Google Scholar]
- 20.Lacoste TD, Michalet X, Pinaud F, Chemla DS, Alivisatos AP, Weiss S. Ultrahigh-resolution multicolor colocalization of single fluorescent probes. Proc Natl Acad Sci USA. 2000;97:9461–9466. doi: 10.1073/pnas.170286097. [DOI] [PMC free article] [PubMed] [Google Scholar]
- 21.Schrock E, du Manoir S, Veldman T, et al. Multicolor spectral karyotyping of human chromosomes. Science. 1996;273:494–497. doi: 10.1126/science.273.5274.494. [DOI] [PubMed] [Google Scholar]
- 22.Speicher MR, Gwyn Ballard S, Ward DC. Karyotyping human chromosomes by combinatorial multifluor FISH. Nat Genet. 1996;12:368–375. doi: 10.1038/ng0496-368. [DOI] [PubMed] [Google Scholar]
- 23.Trask BJ. Human cytogenetics: 46 chromosomes, 46 years and counting. Nat Rev Genet. 2002;3:769–778. doi: 10.1038/nrg905. [DOI] [PubMed] [Google Scholar]
- 24.Chan P, Yuen T, Ruf F, et al. Method for multiplex cellular detection of mRNAs using quantum dot fluorescent in situ hybridization. Nucleic Acids Res. 2005;33:e161. doi: 10.1093/nar/gni162. [DOI] [PMC free article] [PubMed] [Google Scholar]
- 25.Xiao Y, Telford WG, Ball JC, et al. Semiconductor nanocrystal conjugates, FISH and pH. Nat Methods. 2005;2:723. doi: 10.1038/nmeth1005-723. [DOI] [PubMed] [Google Scholar]