

Abstract
New walking patterns can be learned over short timescales (i.e., adapted in minutes) using a split-belt treadmill that controls the speed of each leg independently. This leads to storage of a modified spatial and temporal motor pattern that is expressed as an aftereffect in regular walking conditions. Because split-belt walking is a novel task for adults and children alike, we used it to investigate how motor adaptation matures during human development. We also asked whether the immature pattern resembles that of people with cerebellar dysfunction, because we know that this adaptation depends on cerebellar integrity. Healthy children (3–18 years old) and adults, and individuals with cerebellar damage were adapted while walking on split belts (1:2 speed ratio). Adaptation and de-adaptation rates were quantified separately for temporal and spatial parameters. All healthy children and adults tested could learn the new timing at the same rate and showed significant aftereffects. However, children younger than 6 years old were unable to learn the new spatial coordination. Furthermore, children as old as age 11 years old showed slower rates of adaptation and de-adaptation of spatial parameters of walking. Young children showed patterns similar to cerebellar patients, with greater deficits in spatial versus temporal adaptation. Thus, although walking is a well-practiced, refined motor skill by late childhood (i.e., 11 years of age), the processes underlying learning new spatial relationships between the legs are still developing. The maturation of locomotor adaptation follows at least two time courses, which we propose is determined by the developmental state of the cerebellum.
Introduction
Children are often thought to have superior learning abilities compared with adults. This view extends to behaviors ranging from learning languages to acquiring complex motor skills such as skiing. Although it is well known that there are critical periods for rapid developmental learning early in life [e.g., visual stereopsis (Blake and Hirsch, 1975; Packwood and Gordon, 1975)], it is not clear how learning of more complex behaviors develops. Here, we consider whether children have a superior ability to acquire a new locomotor pattern via adaptation compared with adults.
Adaptation is a form of motor learning that occurs in virtually all movements, including walking, reaching, eye movements, and balancing (Horak and Diener, 1994; Shadmehr and Mussa-Ivaldi, 1994; Wallman and Fuchs, 1998; Reisman et al., 2005). Adaptive mechanisms are used to recalibrate movements in response to predictable perturbations over minutes to hours and lead to storage of a new motor pattern and aftereffects when the perturbation is removed (Martin et al., 1996b; Bastian, 2008). This requires the ability to use error feedback to predict and compensate for perturbations in movement (Shadmehr and Mussa-Ivaldi, 1994), which is essential for avoiding inaccuracies caused by reliance on delayed feedback. Because adaptation is fundamental for coordinating movement in the face of new demands, these mechanisms may mature early in life. Conversely, it is also possible that adaptive learning takes time to develop in children, because brain areas known to be essential to this process [e.g., cerebellum (Martin et al., 1996a; Baizer et al., 1999; Maschke et al., 2004; Smith and Shadmehr, 2005; Morton and Bastian, 2006; Rabe et al., 2009)] are known to have a protracted maturation process (Diamond, 2000; Tiemeier et al., 2010). Relatively few studies have investigated the development of adaptive ability. Pang et al. (2003) demonstrated that infants aged 9–12 months could adapt to a repeated tripping perturbation by increasing step height, but no comparison with adult learning was made. Children as young as 3 years old (yo) have shown adaptive abilities in arm movements to account for a predictable force (Jansen-Osmann et al., 2002; Konczak et al., 2003; Takahashi et al., 2003). However, differences in the rate of adaptation of children and adults were found to be minimal (Konczak et al., 2003) or nonexistent (Takahashi et al., 2003).
Here, we investigated how adaptive ability changes from age 3 years to adulthood in a split-belt walking task and whether the immature pattern resembles that seen in individuals with cerebellar damage. We studied walking adaptation for several reasons. First, our paradigm can be studied in very young children because, unlike reaching, it does not require sustained attention to the task. Second, we know that this split-belt adaptation is cerebellum dependent (Morton and Bastian, 2006; Reisman et al., 2007; Choi et al., 2009). Finally, this task is unique in that it allows us to assess adaptation rates of spatial and temporal parameters separately (i.e., “where” vs “when” the feet are placed during walking), which we have previously speculated are controlled by separate neural mechanisms (Malone and Bastian, 2010) and, if so, may develop at different rates.
Materials and Methods
Subjects.
Fifty healthy children (aged 3–17 years; mean ± SD, 10.4 ± 4.4 years; 27 females) and 10 adults (aged 18–40 years; mean ± SD, 27.5 ± 7.9 years; six females) participated in the first part of this study. These subjects were divided into six age groups (10 subjects in each): 3–5, 6–8, 9–11, 12–14, and 15–17 yo and adults (18–40 yo). Characteristics of these groups are listed in Table 1.
Table 1.
Age group characteristics
| Age group | Number of subjects | Average ± SD age (years) | Age range (years) | Number ± SD adaptation steps | Number ± SD post-adaptation steps |
|---|---|---|---|---|---|
| 3–5 yo | 10 | 4.5 ± 1.0 | 3.1–5.8 | 732 ± 112 | 547 ± 279 |
| 6–8 yo | 10 | 7.0 ± 0.8 | 6.2–8.3 | 753 ± 74 | 616 ± 121 |
| 9–11 yo | 10 | 10.6 ± 1.1 | 9.1–11.9 | 741 ± 96 | 643 ± 149 |
| 12–14 yo | 10 | 13.3 ± 0.7 | 12.3–14.9 | 684 ± 47 | 624 ± 44 |
| 15–17 yo | 10 | 16.7 ± 0.7 | 15.7–17.8 | 721 ± 33 | 660 ± 36 |
| Adults | 10 | 27.9 ± 8.3 | 18.0–40.9 | 692 ± 73 | 637 ± 58 |
In the second part of this study, data from 17 cerebellar subjects collected in a previous study (Morton and Bastian, 2006) were reanalyzed to examine specific deficits in adaption of spatial and temporal coordination. This was done to determine whether the adaptation pattern that we saw in children was similar to individuals with impaired cerebellar function. Cerebellar damage was confirmed by magnetic resonance imaging (MRI) or computed tomography scan, and all subjects underwent neurological testing before the experiment. Subjects who showed signs of damage beyond the cerebellum (either in radiological scans or in clinical examination, e.g., motor weakness, somatosensory loss, hyperreflexia, bradykinesia, rigidity) were excluded from the study. As part of the clinical exam, the International Cooperative Ataxia Rating Scale (ICARS) (Trouillas et al., 1997) was used to rate the severity of ataxia. This test is an ordinal-scale clinical measure that rates ataxia in four movement categories: posture and gait, limb kinetics, speech, and oculomotor. To ensure that cerebellar subjects had significant gait ataxia, our inclusion criteria required a score of 30 or higher on the total ICARS and 10 or higher on the posture and gait ICARS subscore. Thus, of the 17 subjects initially recruited, nine were included in this analysis. These subjects were compared with nine age-matched controls. For more information about the subjects with cerebellar damage, see Table 2 and Morton and Bastian (2006).
Table 2.
Cerebellar subject characteristics
| Subject | Age (years) | Gender | Diagnosis | Time since onset (years) | ICARS total | ICARS P&G |
|---|---|---|---|---|---|---|
| CB-1 | 52 | F | Idiopathic pancerebellar atrophy | 8.5 | 30 | 11 |
| CB-2 | 56 | F | Hereditary pancerebellar atrophy | 11 | 33 | 12 |
| CB-3 | 31 | M | SCA 8 | 5 | 35 | 12 |
| CB-4 | 35 | F | SCA 6 | 8 | 40 | 11 |
| CB-5 | 45 | M | Idiopathic pancerebellar atrophy | 25 | 40 | 13 |
| CB-6 | 48 | M | Idiopathic pancerebellar atrophy | 8 | 41 | 14 |
| CB-7 | 56 | M | Idiopathic pancerebellar atrophy | 5 | 42 | 14 |
| CB-8 | 45 | F | Static pancerebellar atrophy | 33 | 45 | 15 |
| CB-9 | 49 | F | Idiopathic pancerebellar atrophy | 14 | 56 | 24 |
| Mean | 46.3 ± 8.6 | 13.1 ± 9.7 | 40.2 ± 7.6 | 14.0 ± 4.0 |
ICARS total, ICARS total score (/100); ICARS P&G, ICARS posture and gait subsection score (/34); F, female; M, male; SCA 6/8, spinocerebellar ataxia type 6/8; means are shown ± 1 SD.
All participants and/or their parent or legal guardian gave informed written consent before participating, and the experimental protocols were approved by the Johns Hopkins Institutional Review Board.
Experimental setup and design.
Subjects walked on a custom-built split-belt treadmill (Woodway) with two separate belts driven by independent motors; these belts could be driven at same speed (“tied-belt”) or at different speeds (“split-belt”). Speed commands for each belt were sent to the treadmill via a computer interface written in Matlab (MathWorks). Subjects were positioned in the middle of the treadmill, with one foot on each belt. They held onto a front rail that was adjusted to elbow height and wore a safety harness around their chest, which was suspended from the ceiling. The safety harness did not support body weight during walking. At the beginning of each trial, the belts were stationary and subjects were not told whether the belts would be split or tied. Children and adults in this experiment were allowed to watch a television show while they walked.
The experimental protocol was similar to that used in previous experiments (Reisman et al., 2005). For the first part of the study examining adaptation in children, each experiment began with 4 min of tied-belt walking at a comfortable pace (baseline). Baseline speed was calculated for each subject using the measured leg length from greater trochanter to lateral malleolus, such that the baseline speed = leg length (m/s). Using this calculation, baseline speed ranged between 0.38 and 0.97 m/s. We normalized speeds using this method for two reasons: (1) to ensure the split-belt perturbation would be of comparable magnitude across ages, which it was (no significant differences) and (2) to ensure that step cadence was similar across subjects of different ages and heights, which it also was (compare number of steps taken during adaptation across age groups in Table 1; there were no significant differences). Subjects were then adapted to split-belts at a 1:2 speed ratio, where the slow belt was the same speed as baseline and the fast belt was twice that speed. The leg that was made to move faster was randomly assigned. For all subjects, short 30 s breaks were taken after every 2 min of walking. All subjects performed 14 min of split-belt walking, with the exception of three younger subjects (aged 3, 3, and 6 yo) who did between 10 and 12 min. After adaptation, aftereffects were washed out during 10–16 min of tied-belt walking at the baseline speed (i.e., post-adaptation phase).
The experimental protocol for subjects with cerebellar damage (part 2) and their controls was slightly different: subjects walked on tied belts at the slow speed (0.5 m/s), fast speed (1.0 m/s), and again at the slow speed (0.5 m/s) before 10 min of adaptation on split belts (0.5:1.0 m/s). After adaptation, belts were tied at 0.5 m/s for a period of 4–5 min. Three of the nine subjects included were unable to sustain the fast tied-belt walking speed (1.0 m/s) and thus were tested at 0.4 and 0.8 m/s instead. The matched controls for these three subjects were also tested at these speeds. For additional details, see Morton and Bastian (2006).
Data collection.
Kinematic data were collected using Optotrak (Northern Digital). Infrared-emitting markers were placed bilaterally over the fifth metatarsal head (toe), lateral malleolus (ankle), lateral femoral epicondyle (knee), greater trochanter (hip), iliac crest (pelvis), and acromion process (shoulder). The onset of stance (heel strike) and swing (toe off) were determined by maximum and minimum limb angle excursions and confirmed with foot switches. Limb angle was calculated as the angle between a vertical axis from the greater trochanter and a vector drawn from the greater trochanter to fifth metatarsal (see Fig. 1A): a 0° limb angle means that the leg was positioned vertically under the body, positive angles denote flexion (i.e., limb positioned in front of the vertical axis), and negative angles denote extension (i.e., limb positioned behind the vertical axis). Voltages reflecting treadmill belt speeds were recorded directly from treadmill motor output. Marker position and analog data (treadmill belt speeds) were synchronized and sampled simultaneously using Optotrak software at 100 and 1000 Hz, respectively.
Figure 1.
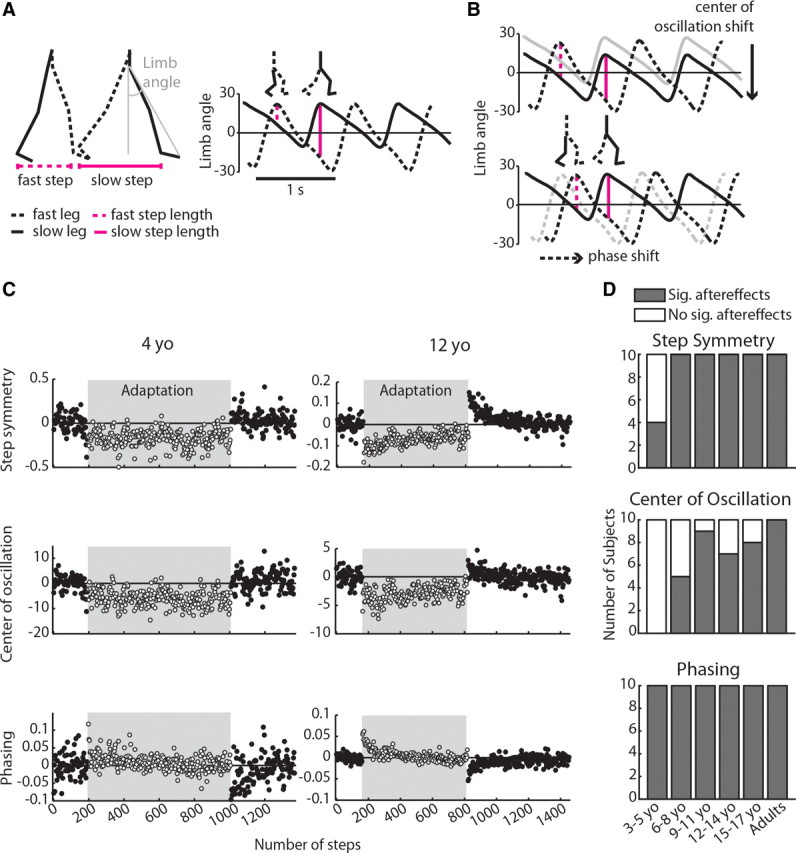
A, Calculations of step length and limb angle. Step length was measured as the distance between malleolus markers at heel strike and was defined as slow or fast depending on which leg was leading. Limb angle was calculated as the angle between a vertical axis from the greater trochanter and a vector drawn from the greater trochanter to fifth metatarsal (shown in gray); positive limb angles indicate flexion. The right plot shows limb angle plotted over 2.5 strides at the beginning of adaptation, with heel strike occurring at the maximums. A zero line, representing a neutral limb position directly under the body, is drawn for reference. Step length is directly proportional to limb angle and is represented by vertical magenta lines; stick figures above plot show limb positions at fast and slow heel strike, respectively. Note that, in early adaptation, the fast step is shorter than the slow step. B, Spatial strategy (top) and temporal strategy (bottom) for equalizing step length during adaptation. Using the spatial strategy, subjects can shift center of oscillation—the midpoint around which the limb oscillates—to lengthen the fast step and shorten the slow step (compare size of vertical lines with those in A). Using the temporal strategy, subjects can shift the phasing of limb angles to similarly equalize step lengths on the two sides. C, Adaptation to the split-belt treadmill for an example 4 year old (left column) and a 12 year old (right column). Each point represents an average of three steps; steps taken during adaptation on split belts are shown in the shaded region. For each interlimb coordination parameter shown, zero represents baseline symmetry and deviations from zero represent asymmetric coordination. Note that, although the 12 year old adapted and showed significant aftereffects in all three measures of interlimb coordination, the 4 year old only showed significant aftereffects in the temporal measure (phasing). These plots are scaled separately for each subject because of the variability in the data of the 4 year old. D, Number of subjects within each age group with significant (gray bars) and nonsignificant (white bars) aftereffects in each of the three measures of interlimb coordination: step symmetry, center of oscillation, and phasing.
Data analysis.
By convention, we refer to the leg that is adapted on the slow belt as the “slow leg” and the leg on the fast belt as the “fast leg,” even during tied-belt walking. In previous experiments, we measured interlimb coordination using step length, which was calculated as the anteroposterior distance between the malleolus markers of each leg at heel strike (see Fig. 1A) (Reisman et al., 2005). Slow step length (SLs) refers to the step length measured at heel strike of the slow leg; fast step length (SLf) refers to the step length measured at heel strike of the fast leg. The difference between fast step length and slow step length, normalized by the sum of fast and slow step length, was used to calculate step symmetry (SS). Normalization was done to allow comparison of subjects who have different leg lengths and thus take different sized steps:
Recently, we discovered that step symmetry could be altered by adapting spatial elements of coordination, temporal elements of coordination, or a combination of both (Malone and Bastian, 2010) (see Fig. 1B). In this experiment, we wanted to specifically examine the emergence and developmental time course of spatial and temporal adaptation; thus, we included two additional parameters to capture these in our analysis. The parameter that captured spatial coordination, “center of oscillation,” was based on our observation that subjects could change their step lengths by changing the angle about which the limb oscillates (see Fig. 1B, top). Center of oscillation was calculated on a stride-by-stride basis as the midpoint of the limb angle between heel strike and toe off for each leg: a positive value indicates that the limb was oscillating around a flexed angle, negative indicates oscillation around an extended angle, and zero indicates oscillation around a vertical axis at the hip (Malone and Bastian, 2010). The difference between center of oscillation on the two sides (i.e., fast leg − slow leg) was used to quantify the spatial element of coordination. To capture the temporal element, we examined limb angle phasing—the lag time at peak cross-correlation of limb angle trajectories over one stride cycle (Choi and Bastian, 2007)—because we also observed that subjects could change their step lengths by altering the relative timing between the legs (i.e., by shifting the limb angle trajectories horizontally, as in Fig. 1B, bottom). Possible phasing values ranged from 0 to 1 stride cycles, with symmetric walking having a value of 0.5 (i.e., out-of-phase walking). The slow leg was used as the reference leg for this analysis.
For all three parameters, mean values during baseline walking were subtracted from all data to remove any baseline offset in symmetry. Therefore, values of zero for all parameters correspond with the subject's baseline symmetry (this is referred to as “symmetric” walking). If the difference was positive or negative, the walking pattern deviated from baseline symmetry and was referred to as “asymmetric” (i.e., resembling a limp, as in early split-belt adaptation and post-adaptation).
For the first part of the study examining adaptation across age groups, we determined whether each subject was able to adapt and store aftereffects in the post-adaptation period. This was done for each individual subject by comparing the first three steps of post-adaptation with baseline data using t tests described below. We also compared variability during baseline stepping for center of oscillation and phasing across two year age groups to confirm that baseline variability was not the sole factor influencing the significance of aftereffects (see Fig. 2D). Variability was normalized across individuals of different age groups as a proportion of the variability during adult stepping.
Figure 2.

Step symmetry (A), center of oscillation (B), and phasing aftereffect sizes (C) relative to age. Subjects who did not show significant aftereffects are shown in gray dots; and subjects who had significant aftereffects are shown in black. For both step symmetry and center of oscillation, the mean aftereffect of subjects who did not adapt (gray) was significantly smaller than the mean aftereffect of those who did adapt (p < 0.001). D, Variability during baseline stepping across age groups (n = 10 for each group) for center of oscillation (black bars) and phasing (gray bars). Bars indicate mean SD ± SE during baseline as a proportion of the SD of adult stepping during baseline. For example, 3–5 yo stepping was approximately four times more variable than adult stepping for both center of oscillation and phasing. There was no significant difference between variability in center of oscillation and phasing data across age groups (p = 0.27).
For subsequent group analysis, we only included those subjects who showed significant aftereffects (see Fig. 1D). Our next step was to plot single-subject adaptation and post-adaptation data relative to age, to visualize how adaptation develops in our subjects (see Fig. 3). We averaged the first three steps of adaptation and post-adaptation to give the “starting point” of each curve, and then all subsequent steps were averaged in bins of 30 steps up to 510 steps for adaptation and 360 steps for post-adaptation. Polynomial three-dimensional surface fits were performed on each dataset (Curve Fitting Toolbox; Matlab).
Figure 3.

Single-subject adaptation (left column) and post-adaptation (right column) data for step symmetry (top), center of oscillation (middle), and phasing (bottom). To fairly compare rates of adaptation and post-adaptation, only subjects who were capable of adapting (i.e., showed significant aftereffects) are shown. The first point of each subject's data represents the average of the first three steps of adaptation or post-adaptation. Subsequent points were averaged each 30 steps, up to 510 steps for adaptation and 360 steps for post-adaptation. Subjects were plotted by age, except for adults who were grouped at the end of the y-axis (labeled Age). Surface fits using 3 × 3 order polynomial functions (i.e., 3 degrees of x and y; for details, see Materials and Methods) were applied to each dataset, and the color bars indicate the extent of adaptation or post-adaptation (r2 > 0.4 for all fits, except center of oscillation adaptation in which r2 = 0.3). Arrows beside each color bar show the direction of adaptation or post-adaptation for each measure of coordination.
We then continued with more detailed, quantitative comparisons on data averaged in two year age groups. To compare the time course of adaptation and post-adaptation, step-by-step data were smoothed within single subjects by averaging every three steps. The smoothed data were used to construct group adaptation and post-adaptation curves (see Figs. 4–6): we truncated all data down to the same length as the subjects with the shortest adaptation and post-adaptation periods (510 and 360 steps, respectively) and then averaged these data within each age group. Best-fit curves (linear, single exponential, or double exponential) were determined based on these averaged data (Curve Fitting Toolbox; Matlab).
Figure 4.
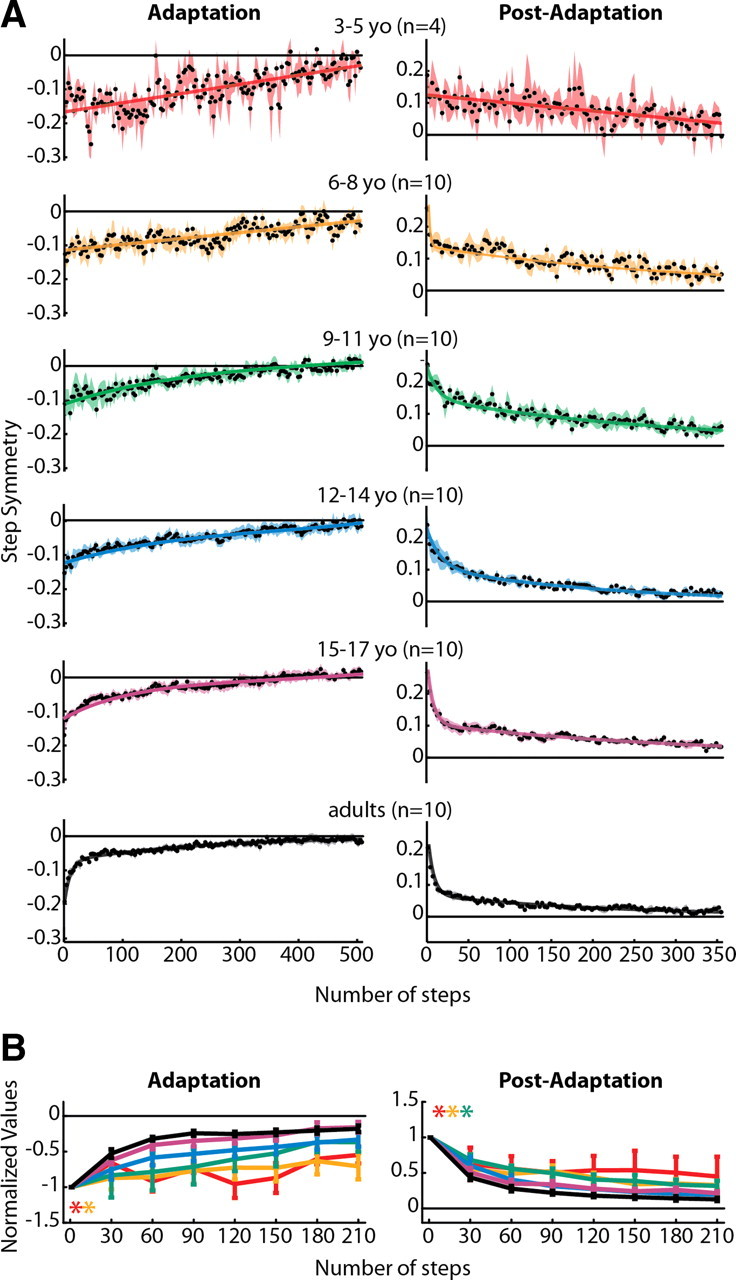
A, Averaged step symmetry adaptation (left column) and post-adaptation (right column) data for all subjects who showed significant aftereffects within each age group. Data were fit with linear, single-exponential, and double-exponential functions, and the one that resulted in the best fit (highest adjusted r2) is shown (all r2 values are listed in Table 3). Linear functions resulted in the best fit for 3–5 yo adaptation and post-adaptation and 6–8 yo adaptation. Double-exponential functions resulted in the best fit for all remaining data. B, Comparison of step symmetry adaptation and post-adaptation rates across all age groups. Means ± SE are shown for adaptation (left) and post-adaptation (right). Significant main effects for age were found for step symmetry adaptation and post-adaptation. Post hoc analyses were performed on the significant main effect for age, and age groups that were found to be significantly different from adults are shown by colored asterisks.
Figure 5.
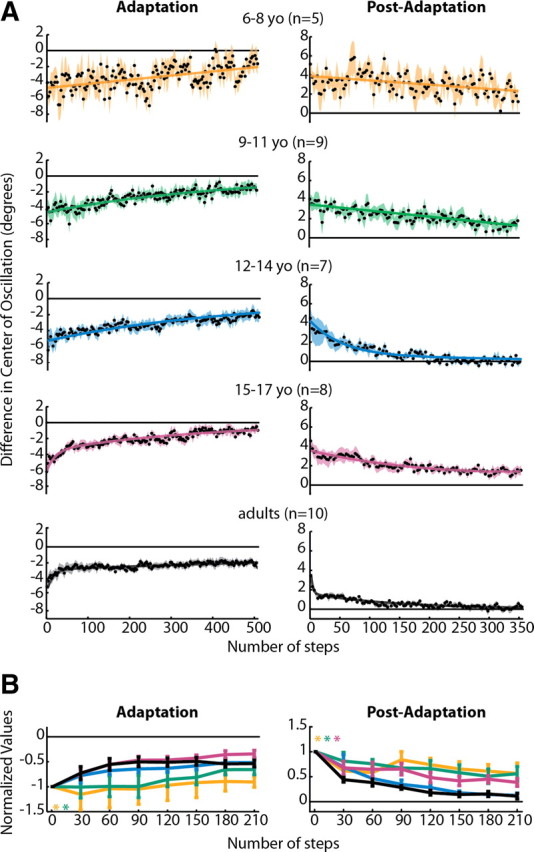
A, Averaged adaptation and post-adaptation center of oscillation data for all subjects who showed significant aftereffects. Data are displayed as in Figure 4. Note that data from 3–5 year olds is not shown, because none from this age group showed significant aftereffects. Linear functions resulted in the best fit for 6–8 yo adaptation and post-adaptation and 9–11 yo post-adaptation. Single-exponential functions resulted in the best fit for 9–11 and 12–14 yo adaptation. Double-exponential functions were the best fit for 12–14 yo post-adaptation, 15–17 yo adaptation and post-adaptation, and adult adaptation and post-adaptation. Adjusted r2 values are listed in Table 3. B, Comparison of center of oscillation adaptation and post-adaptation across age groups, as shown in Figure 4B. Significant main effects for age were found for adaptation and post-adaptation; age groups that were found to be significantly different from adults are shown by colored asterisks.
Figure 6.
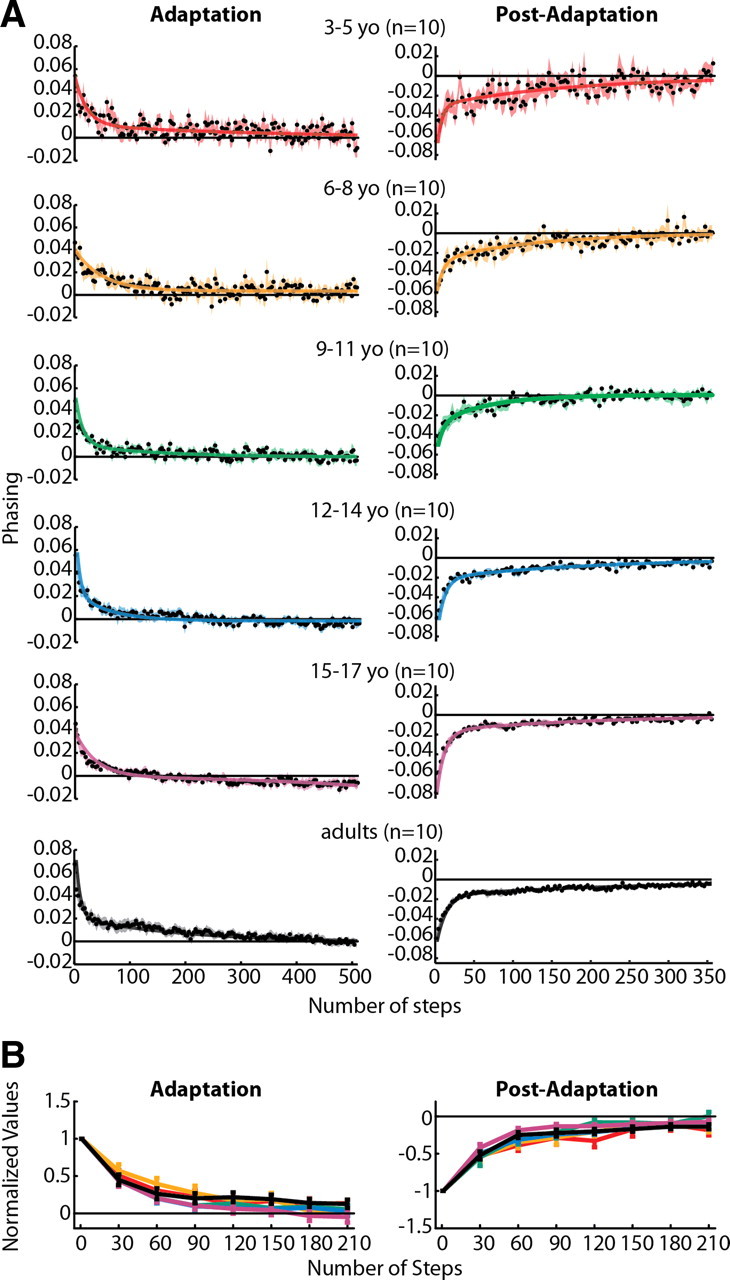
A, Phasing adaptation and post-adaptation data for all subjects who showed significant aftereffects (for phasing, this included all subjects tested). Data are displayed as in Figure 4. In contrast to step symmetry (Fig. 4) and center of oscillation (Fig. 5), adult-like double-exponential functions fit all data regardless of age (adjusted r2 values listed in Table 3). B, Comparison of phasing adaptation and post-adaptation across age groups, as shown in Figure 4B. No significant main effects for age were found for either phasing adaptation or post-adaptation.
To fairly compare rates of adaptation and de-adaptation across ages (see Figs. 4B, 5B, 6B), we first determined that the initial three steps of each were not significantly different across age groups for all parameters. We then normalized each subject's data by dividing all of the adaptation and de-adaptation values by their respective starting point (i.e., the average of the first three steps), thus rescaling the data to be a proportion of the initial perturbation (for adaptation data) or aftereffect (for post-adaptation data). Then, the first 210 steps of adaptation and post-adaptation were binned into groups of 30 steps and averaged, with the exception of the first bin, which did not include the first three steps used for normalization (i.e., first bin = steps 4–30, shown at step 30 in Figs. 4B, 5B, 6B). Within-subject averages of each 30 steps were then averaged across subjects for each age group.
In the second part of the study examining adaptation in adults with cerebellar damage, aftereffects were quantified as the mean of the first three steps of post-adaptation and averaged across subjects within each group (cerebellar ataxia group and controls).
Statistical analysis.
For the first part of the study examining adaptation in children and adults, a one-way ANOVA was used to compare numbers of steps taken during adaptation across age groups, to ensure that the exposure on the split-belt treadmill was equivalent. We identified which subjects showed significant aftereffects in each measure of interlimb coordination (step symmetry, center of oscillation, and phasing) by using two-sample t tests to compare the first three steps of the aftereffect with baseline data. We confirmed that the aftereffects identified as significant by this analysis were larger than the nonsignificant aftereffects by performing two-sample t tests comparing the aftereffect sizes between the two groups. A two-way ANOVA (age group × measure) was used to compare variance in center of oscillation and phasing across age groups (see Fig. 2D).
We then constructed three-dimensional plots of single-subject data to visually show the gradual maturation of adaptive processes with age (see Fig. 3). Surface fits were applied to these data using polynomial functions with three degrees of x (number of steps) and y (age). To more directly compare adaptation and de-adaptation rates across age groups, curves were fit to averaged data (see Figs. 4A–6A). We determined whether a linear [y = ax + b], single-exponential [y = (a × ebx) + c], or double-exponential [y = (a × ebx) + (c × edx) + f] function fit the data best by evaluating which resulted in the maximum coefficient of determination (adjusted r2; values listed in Table 3). The initial perturbation size (mean of first three steps of adaptation) and aftereffect size (mean of first three steps of post-adaptation) of each of the curves in Figures 4A–6A were compared across groups using one-way ANOVAs, with age group as a predictor variable. Repeated-measures ANOVAs were used to statistically compare adaptation and de-adaptation rates in data that were averaged every 30 steps (see Figs. 4B, 5B, 6B). Post hoc analysis of significant main effects was conducted using Fisher's least significant difference tests.
Table 3.
| Parameter | Age group | Adaptation |
Post-adaptation |
||||
|---|---|---|---|---|---|---|---|
| Linear | Exp 1 | Exp 2 | Linear | Exp 1 | Exp 2 | ||
| Step symmetry (Fig. 4) | 3–5 yo | 0.52 | 0.49 | 0.52 | 0.43 | 0.41 | 0.41 |
| 6–8 yo | 0.64 | 0.64 | 0.64 | 0.69 | 0.72 | 0.77 | |
| 9–11 yo | 0.81 | 0.82 | 0.86 | 0.76 | 0.84 | 0.89 | |
| 12–14 yo | 0.89 | 0.91 | 0.93 | 0.65 | 0.86 | 0.95 | |
| 15–17 yo | 0.83 | 0.88 | 0.92 | 0.66 | 0.78 | 0.96 | |
| Adults | 0.66 | 0.83 | 0.96 | 0.51 | 0.69 | 0.95 | |
| Center of oscillation (Fig. 5) | 6–8 yo | 0.32 | 0.32 | 0.26 | 0.24 | 0.26 | |
| 9–11 yo | 0.75 | 0.79 | 0.79 | 0.64 | 0.64 | 0.64 | |
| 12–14 yo | 0.85 | 0.86 | 0.86 | 0.63 | 0.89 | 0.90 | |
| 15–17 yo | 0.76 | 0.84 | 0.88 | 0.75 | 0.84 | 0.87 | |
| Adults | 0.56 | 0.59 | 0.77 | 0.58 | 0.78 | 0.86 | |
| Phasing (Fig. 6) | 3–5 yo | 0.29 | 0.40 | 0.54 | 0.42 | 0.53 | 0.58 |
| 6–8 yo | 0.35 | 0.56 | 0.62 | 0.52 | 0.68 | 0.73 | |
| 9–11 yo | 0.34 | 0.69 | 0.77 | 0.50 | 0.83 | 0.85 | |
| 12–14 yo | 0.46 | 0.79 | 0.82 | 0.42 | 0.63 | 0.88 | |
| 15–17 yo | 0.57 | 0.63 | 0.89 | 0.46 | 0.75 | 0.95 | |
| Adults | 0.60 | 0.75 | 0.95 | 0.42 | 0.61 | 0.96 | |
In part 2, we compared aftereffect sizes for subjects with cerebellar ataxia to age-matched control adults using one-way ANOVAs for each measure of interlimb coordination.
For all data, t tests and curve fitting were performed using Matlab (Statistics and Curve Fitting Toolboxes). ANOVAs and post hoc tests were calculated using Statistica (StatSoft). The α level was set at 0.05, except during post hoc tests, when it was adjusted accordingly.
Results
When subjects of all ages were first exposed to split belts (early in adaptation), they showed a pronounced limp, quantified as an asymmetry in all three measures of interlimb coordination: step symmetry (a global measure of interlimb coordination), center of oscillation (a spatial measure), and phasing (a temporal measure). For all of these measures, there were no significant differences in the initial perturbation across age groups (p > 0.29), indicating that all subjects were perturbed to a similar degree by the split belts. In an example 12-year-old subject (Fig. 1C, right column), gradual improvements toward symmetry in all three parameters were observed over the course of the 14 min adaptation period. In other words, this subject adapted in all parameters and also showed significant aftereffects with the reverse asymmetry when normal tied-belt walking conditions were restored. In contrast, although an example 4-year-old was initially perturbed by the split belts, showing asymmetry in all measures (Fig. 1C, left column), this subject did not adapt step symmetry and center of oscillation and these did not return to baseline symmetry after 14 min of adaptation (∼800 steps). When tied belts were re-encountered after adaptation, aftereffects were absent in center of oscillation and were subtle in step symmetry. Adaptation and aftereffects were evident in phasing for this subject (Fig. 1C, bottom left), suggesting that, although the spatial strategy for changing interlimb coordination was not used in a 4-year-old, the temporal strategy was intact.
We first identified which subjects showed significant aftereffects, indicating that they were able to adapt and store the modified walking pattern. The presence of aftereffects was determined by comparing the first three steps of post-adaptation with baseline symmetry for each measure (significance was set at p < 0.05). Figure 2A–C shows which subjects were identified as having significant aftereffects (black dots) using this criterion; subjects with nonsignificant aftereffects are shown in gray dots. Note that, for step symmetry (A), six children under 6 years of age did not show significant aftereffects. The mean ± SD step symmetry aftereffect in the significant aftereffect group (the “adapters”) was 0.24 ± 0.08, whereas the mean in the nonsignificant aftereffect group (the “non-adapters”) was 0.06 ± 0.08; this difference in aftereffect size between adapters and non-adapters was significant (p < 0.001). For center of oscillation (B), 21 children between 3 and 15 years of age did not have significant aftereffects (shown in gray dots). The mean center of oscillation aftereffect for the adapters (black dots) was 4.21 ± 1.95 and for the non-adapters (gray dots) was 0.63 ± 2.62 (p < 0.001). In contrast, all children and adults showed significant aftereffects in phasing; mean phasing aftereffect was −0.06 ± 0.02.
Figure 1D summarizes the numbers of subjects with (gray bars) and without (white bars) significant aftereffects by grouping these subjects into age groups spanning 3 years (i.e., 3–5 year olds, 6–8 year olds, and so on). As mentioned above, 6 of 10 of the 3–5 year olds did not show aftereffects in step symmetry (top), whereas all subjects 6 years and older did. This may be attributable to an inability of these younger subjects to use a spatial strategy to change step lengths: none of the children younger than 6 years showed significant aftereffects in center of oscillation, and many who were 6 years and older also lacked aftereffects (middle). Conversely, all subjects had aftereffects in phasing (bottom), indicating that the temporal strategy for adjusting step lengths was intact by age 3 years.
The lack of aftereffects in step symmetry and center of oscillation in younger subjects was not simply attributable to them experiencing a smaller “dose” of the split-belt treadmill, because there was no significant difference in the numbers of steps taken during adaptation across age groups (p = 0.29) (data shown in Table 1). Another possibility is that the increased variability in baseline stepping of younger subjects may have prevented the aftereffects from reaching significance. However, as mentioned above, for step symmetry and center of oscillation, the aftereffects identified as nonsignificant were smaller than those identified as significant (p < 0.001) (Fig. 2A,B); thus, variability in baseline stepping alone did not account for whether or not aftereffects were determined to be significant. Moreover, baseline variability increased similarly with decreasing age for both center of oscillation and phasing (Fig. 2D); therefore, baseline variability could also not explain why there were several subjects with nonsignificant aftereffects in center of oscillation, but none with nonsignificant aftereffects in phasing.
Next, we examined how rates of adaptation and de-adaptation changed with age. We excluded those subjects who did not show significant aftereffects because this finding demonstrates that they were unable to adapt. To visually compare rates of adaptation, single-subject data were plotted in three-dimensional plots of number of steps × age of subjects × coordination measure (i.e., step symmetry, center of oscillation, or phasing) (Fig. 3). Third-order polynomial surface fits were applied to each plot (r2 > 0.3 for all surface fits), and the color bar indicates the degree of asymmetry in each measure and how this changes with time. The plots of step symmetry (Fig. 3, top) and center of oscillation (Fig. 3, middle) show that the rates of adaptation and post-adaptation are faster in adults than in children. For example, children under ∼10 years of age take longer to adapt step symmetry (i.e., step symmetry = 0; shown in red). The time course of post-adaptation also appears to be longer in these children; note how the cyan region extends up to 300 steps in children under 10 years, whereas adults reach near-baseline values (shown in dark blue) before step 150 (Fig. 3). Similarly extended time courses of adaptation and post-adaptation are also seen in the center of oscillation data; for this measure, even children up to age 12–15 years still appear to be slower than adults in adaptation and post-adaptation. In contrast, subjects of all ages adapt phasing and similar rates; the cyan/blue region, indicating near-complete adaptation, begins around step 150 for all subjects. The time course of phasing post-adaptation is also similar across ages, with subjects returning to baseline symmetry (orange/red area) by step 150.
Because single-subject data can be variable, averaging across subjects was necessary for subsequent analysis. We grouped subjects by age into six groups: 3–5, 6–8, 9–11, 12–14, and 15–17 yo and adults (>17 yo). Based on the data shown in Figure 3, we were confident that this grouping in these intervals would capture the gradual development of adaptation from early childhood to age 10 years (for step symmetry) or 12 years (for center of oscillation) and would allow us to identify when the adult-like state was achieved, within a 1–2 year margin of error.
Averaged step symmetry adaptation and post-adaptation curves for each age group are shown in Figure 4A. Linear, single-exponential, or double-exponential functions were fit to the averaged data depending on which resulted in the greatest coefficient of determination (adjusted r2; specific values for each fit are listed in Table 3). Notice that, in adults (Fig. 4A, bottom, black curves), the data for both adaptation and post-adaptation are fit by a double-exponential function, with an initial fast component (approximately the first 20 steps) followed by a slower rate of decline. This resembles the two separate timescales observed in reaching adaptation (Smith et al., 2006) and is representative of the mature adaptation and de-adaptation pattern in split-belt walking as well (Reisman et al., 2005). In comparison, note that the rate of adaptation and de-adaptation is slower in younger children, particularly in the 3–5 year olds (red curves, top), whose data are best fit with linear functions (Table 3).
Adaptation of step symmetry is attributable to changes in two components: one that is spatial [center of oscillation (Fig. 5)] and one that is temporal [phasing (Fig. 6)]. Our analysis shows that the maturation of the processes underlying each of these components follows a different developmental time course. In Figure 5A, center of oscillation data from 3–5 year olds are not shown because there were no subjects in this group who had significant aftereffects (Fig. 1D, middle), that is, none adapted. Among subjects who did show significant aftereffects, adaptation and de-adaptation rates were slower in children than adults. Children younger than 12 years appeared to be slower to adapt and de-adapt, and their data were fit by linear and single-exponential functions (Table 3). A double-exponential rate of adaptation only started to emerge in the 12- to 14-year-old age group (double-exponential fit for 12- to 14-year-old post-adaptation in Fig. 5A) (Table 3). In contrast, phasing adaptation and de-adaptation rates were remarkably similar across all age groups (Fig. 6A). All phasing data were best fit by double-exponential functions (Table 3), and even the 3- to 5-year-old group showed rapid adaptation and de-adaptation (Fig. 6A, top).
To fairly compare the rates of adaptation and post-adaptation across age groups, we first determined that the starting point of the curves for each age group were not significantly different from one another (all p > 0.29). We then compared the different ages by grouping data in a series of 30 step bins. The results of this analysis are shown in Figures 4B (step symmetry), 5B (center of oscillation), and 6B (phasing). Significant main effects for age were found for adaptation and post-adaptation in both step symmetry and center of oscillation (Figs. 4B, 5B) but not for phasing (Fig. 6B). Post hoc analyses were performed on the significant main effect for age; groups that were found to be significantly different from adults are shown by colored asterisks. Note that children under the age of 9 years were significantly slower than adults in adapting step symmetry (Fig. 4B) and children under 12 were slower in adapting center of oscillation (Fig. 5B). Post-adaptation rates also were slower than adults in children under 12 for both step symmetry (Fig. 4B) and center of oscillation (Fig. 5B). Interestingly, 15–17 year olds were significantly slower to de-adapt center of oscillation compared with adults, whereas 12–14 year olds were not significantly different from adults (Fig. 5B). Altogether, these results mirror the trends observed in the single-subject plots (Fig. 3) and indicate that the ability to adapt spatial coordination (specifically, center of oscillation) emerges later than the ability to adapt temporal gait parameters (phasing).
It is possible that the differences that we see reflect development of brain region(s) required for adaptation of spatial control of walking. Although we cannot explicitly test this in these children, we know from our previous work that people with cerebellar damage are more impaired in adapting step length (i.e., a spatiotemporal measure of coordination) than phasing [i.e., temporal coordination (Morton and Bastian, 2006)]. Here, we wanted to determine whether this impairment in adapting step length was attributable to a specific impairment in spatial adaptation, similar to what we observed in children. When we reanalyzed the cerebellar patient data to assess aftereffects in center of oscillation (i.e., spatial coordination), we discovered that aftereffect size in people with cerebellar damage resembles that of 3- to 5-year-old children. Specifically, subjects with cerebellar damage and typically developing 3–5 year olds showed significantly smaller aftereffects in step symmetry (p = 0.03 for both) (Fig. 7, compare A, D) and center of oscillation (p = 0.02 and 0.01, respectively) (Fig. 7, compare B, E), whereas phasing aftereffects were not significantly different between cerebellar patients and controls, nor between 3–5 year olds and adults (p = 0.12 and p = 0.92) (Fig. 7C,F). Generally, aftereffects were larger in data from the current experiment (Fig. 7D–F) compared with the previous cerebellar study (Fig. 7A–C), which may be attributable to relatively faster speeds used for adaptation in the current study: in the current study, average adaptation speed for adults was ∼0.9:1.8 m/s, whereas the speeds used for controls and cerebellar patients in the previous study were 0.4:0.8 to 0.5:1.0 m/s (note that the belt speed ratio was kept constant at 1:2 for all subjects). However, the important comparisons in Figure 7 are between the cerebellar patients and their controls (Fig. 7A–C) and between the 3–5 year olds and adults (Fig. 7D–F); within each of these groups, belt speeds were matched appropriately.
Figure 7.

Average aftereffect size in step symmetry, center of oscillation, and phasing in nine subjects with cerebellar damage (gray) compared with age-matched controls (black) (A–C). Ten typically developing 3–5 year olds (white) are also shown compared with speed-matched adults (black) (D–F). Note that all 3–5 year olds were included in these averages and not just the subjects with significant aftereffects because many cerebellar subjects had no aftereffects. Aftereffects are shown as means ± SE. Error bars represent SE; *p < 0.05, significant differences between groups.
Discussion
Here we have shown a developmental trajectory of adaptive ability from early childhood to adulthood. Previous investigations of the development of adaptation using a reaching task have either shown no (Takahashi et al., 2003) or small (Konczak et al., 2003) differences in the rate at which adaptation occurs in children and adults. Moreover, to the best of our knowledge, all preceding work has indicated that 3-year-old children are capable of adapting and storing aftereffects in arm movements (Jansen-Osmann et al., 2002; Konczak et al., 2003; Takahashi et al., 2003). In contrast, we showed that there are specific elements of walking coordination, namely the spatial relationships between the limbs (i.e., center of oscillation), that do not adapt in children younger than 6 years. Even among those who did adapt, adaptation and de-adaptation progressed at a significantly slower rate in children younger than 12 years compared with adults. Interestingly, other elements of coordination—timing (i.e., phasing)—adapted and de-adapted in an adult-like manner, even in the youngest children tested.
Why did we see such large differences between spatial adaptation rates in children and adults compared with what has been reported previously? It may be attributable to differences in the complexity of the tasks tested. Walking involves coordinating multiple limbs, joints, and degrees of freedom, whereas other studies have investigated adaptation of a single joint or single direction reaching movement (Jansen-Osmann et al., 2002; Konczak et al., 2003; Takahashi et al., 2003). It is possible that, had a more complex reaching task been tested, differences in adaptation rates may have become more prominent. It is also plausible that adaptive control of walking is inherently different from that of reaching in development. Regardless, it is of note that we find elements of adaptation to be immature up to age 12 years, suggesting that this form of motor learning follows a substantially more protracted developmental time course than previously thought.
Our result showing separate time courses for the maturation of temporal and spatial elements of actions is consistent with our previous work showing distinct control for each. For example, in one study, subjects were instructed how to equalize step length during adaptation, distracted from the walking task, or neither instructed nor distracted (Malone and Bastian, 2010). Interestingly, only rates of spatial (center of oscillation) adaptation and de-adaptation were altered by instruction or distraction, whereas the temporal element (phasing) was unaffected. Therefore, the control of spatial and temporal patterns of walking may be accessible through different neural circuits. Control of spatial coordination was suggested to occur through projections from the intermediate/lateral cerebellum to the cerebrum via the thalamus, which could explain why spatial coordination was previously more affected by cognitive interventions. Conversely, the adaptation of timing may require projections from the midline cerebellum through the vestibulospinal and reticulospinal pathways to the spinal cord; these pathways and structures have been shown previously to have a role in changing temporal coordination during walking (Arshavsky et al., 1978a,b,c; Russell and Zajac, 1979).
If the maturation of these two putative systems controlling walking adaptation proceeds at different rates, this could explain the differences we observed in the emergence and maturation of spatial and temporal adaptation. Before we discuss this possibility in more detail, we consider alternative explanations for our findings. One possibility is that the gait of young children is more variable than that of adults, which might make it more difficult for children to adapt to the perturbation. We believe that this is unlikely for several reasons. First, we found that variability increased similarly with decreasing age in both center of oscillation and phasing (Fig. 2D), yet we only saw differences in adaptation rates in center of oscillation. Second, it has been shown that reaching adaptation in adults and children is robust to increases in external variability imposed by a variable force field (Scheidt et al., 2001; Takahashi et al., 2001, 2003). Therefore, we do not believe that variability in gait can account for our results.
Another possibility is that the neural structures underlying adaptation are mature, but children may lack experience with making spatial modifications to gait. Although we cannot rule this out, we again believe that it is unlikely to fully explain our results. Common childhood sports like soccer and unstructured play activities typically involve frequent and rapid changes in the direction of locomotion, interceptions with objects, and negotiations of obstacles, all of which require making spatiotemporal adjustments in coordination (Patla et al., 1999; Strike and Taylor, 2009). In fact, Vallis and McFadyen (2005) found that typically developing 5 year olds reduced step length as they approached an obstacle, indicating that they were capable of modifying their locomotor patterns. Considering this, we find it difficult to argue that children have enough experience with changing temporal elements of walking coordination to be proficient “adapters” by age 3 years, whereas it takes an additional 9 years (at age 12 years) to develop the same level of proficiency in making spatial adjustments.
We think a more likely explanation of our results is the differences in the maturational time courses of neural structures underlying temporal and spatial coordination. Our previous work showed that adaptation of spatial and temporal elements of walking requires the cerebellum (Morton and Bastian, 2006) but that different cerebellar regions and pathways may be involved. We have speculated that temporal adaptation may occur through midline cerebellar projections to the brainstem and spinal cord, whereas spatial adaptation may occur through intermediate/lateral cerebellar projections to motor cortex (Malone and Bastian, 2010). Consistent with this hypothesis, recent magnetic resonance imaging work shows that the midline cerebellum (i.e., vermis) has a mature volume earlier than the cerebellar hemispheres, which do not reach peak volume until age 11 years or later (Tiemeier et al., 2010). In addition, available evidence suggests that brainstem and spinal pathways, which are the targets of midline cerebellar output (specifically the reticulospinal and vestibulospinal pathways) mature before or shortly after birth. For example, Eyre et al. (2000) have shown that, except for the corticospinal tract, major tracts in the spinal cord have completed most of their growth by the 33rd gestational week. It is difficult to test the actual functionality of these pathways in human infants. Nonetheless, it is interesting that the brainstem undergoes its greatest maturation during fetal life (Dambska and Kuchna, 1996) and could suggest that the structures that we speculate could be involved with temporal adaptation likely mature early in development. Conversely, the structural maturation of corticospinal tracts that may participate in spatial adaptation continues through late childhood and adolescence (Müller and Hömberg, 1992; Paus et al., 1999; Fietzek et al., 2000; Lebel et al., 2008). The timeline of cerebellar development coupled with motor cortical versus brainstem and spinal cord maturation could explain why temporal adaptation is adult like in early childhood, whereas spatial adaption does not fully develop until adolescence.
Why did our 3- to 5-year-old group look so similar to the adult cerebellar patients? One possibility is that the cerebellar patients that were studied had more damage in the lateral hemispheres compared with the vermis. This is difficult to know in patients with degenerative diseases, so future work using quantitative MRIs will be needed to understand this. The alternative is that the cerebellum is only necessary for spatial adaptation, and that extra-cerebellar structures are important for temporal adaptation. This is plausible, although we think it less likely because there is a trend toward cerebellar damage impairing temporal adaptation (Fig. 7C), possibly as a result of partial vermal damage. We therefore think that the most parsimonious explanation of our results is that the pattern of cerebellar development, as well as development of its brainstem and motor cortical targets, is what leads to the developmental pattern that we observed.
In summary, we showed here that the development of spatial and temporal adaptation follows different time courses, with temporal adaptation maturing by age 3 years, whereas spatial adaptation matures through childhood (up to age 12 years). We believe that this could be attributable to immaturity in cerebellar and possibly cerebral circuits that have been proposed to coordinate spatial adaptation. In contrast, the brainstem and spinal cord circuits that have been proposed to have a role in coordinating temporal adaptation mature early in life, well before age 3 years. Therefore, in situations in which adaptive strategies are used as part of rehabilitation, it may be that all children under the age of 12 years should be trained longer than adults to achieve similar benefits.
Footnotes
This work was supported by National Institutes of Health Grants F32 NS063642 and R01 HD048741. We thank Ajay Gurbani, Laura Malone, and Paxson Trautman for assistance with data collection.
References
- Arshavsky YI, Gelfand IM, Orlovsky GN, Pavlova GA. Messages conveyed by spinocerebellar pathways during scratching in the cat. I. Activity of neurons of the lateral reticular nucleus. Brain Res. 1978a;151:479–491. doi: 10.1016/0006-8993(78)91081-8. [DOI] [PubMed] [Google Scholar]
- Arshavsky YI, Gelfand IM, Orlovsky GN, Pavlova GA. Messages conveyed by spinocerebellar pathways during scratching in the cat. II. Activity of neurons of the ventral spinocerebellar tract. Brain Res. 1978b;151:493–506. doi: 10.1016/0006-8993(78)91082-x. [DOI] [PubMed] [Google Scholar]
- Arshavsky YI, Gelfand IM, Orlovsky GN, Pavlova GA. Messages conveyed by descending tracts during scratching in the cat. I. Activity of vestibulospinal neurons. Brain Res. 1978c;159:99–110. doi: 10.1016/0006-8993(78)90112-9. [DOI] [PubMed] [Google Scholar]
- Baizer JS, Kralj-Hans I, Glickstein M. Cerebellar lesions and prism adaptation in macaque monkeys. J Neurophysiol. 1999;81:1960–1965. doi: 10.1152/jn.1999.81.4.1960. [DOI] [PubMed] [Google Scholar]
- Bastian AJ. Understanding sensorimotor adaptation and learning for rehabilitation. Curr Opin Neurol. 2008;21:628–633. doi: 10.1097/WCO.0b013e328315a293. [DOI] [PMC free article] [PubMed] [Google Scholar]
- Blake R, Hirsch HV. Deficits in binocular depth perception in cats after alternating monocular deprivation. Science. 1975;190:1114–1116. doi: 10.1126/science.1188391. [DOI] [PubMed] [Google Scholar]
- Choi JT, Bastian AJ. Adaptation reveals independent control networks for human walking. Nat Neurosci. 2007;10:1055–1062. doi: 10.1038/nn1930. [DOI] [PubMed] [Google Scholar]
- Choi JT, Vining EP, Reisman DS, Bastian AJ. Walking flexibility after hemispherectomy: split-belt treadmill adaptation and feedback control. Brain. 2009;132:722–733. doi: 10.1093/brain/awn333. [DOI] [PMC free article] [PubMed] [Google Scholar]
- Dambska M, Kuchna I. Different developmental rates of selected brain structures in humans. Acta Neurobiol Exp (Wars) 1996;56:83–93. doi: 10.55782/ane-1996-1107. [DOI] [PubMed] [Google Scholar]
- Diamond A. Close interrelation of motor development and cognitive development and of the cerebellum and prefrontal cortex. Child Dev. 2000;71:44–56. doi: 10.1111/1467-8624.00117. [DOI] [PubMed] [Google Scholar]
- Eyre JA, Miller S, Clowry GJ, Conway EA, Watts C. Functional corticospinal projections are established prenatally in the human foetus permitting involvement in the development of spinal motor centres. Brain. 2000;123:51–64. doi: 10.1093/brain/123.1.51. [DOI] [PubMed] [Google Scholar]
- Fietzek UM, Heinen F, Berweck S, Maute S, Hufschmidt A, Schulte-Mönting J, Lücking CH, Korinthenberg R. Development of the corticospinal system and hand motor function: central conduction times and motor performance tests. Dev Med Child Neurol. 2000;42:220–227. doi: 10.1017/s0012162200000384. [DOI] [PubMed] [Google Scholar]
- Horak FB, Diener HC. Cerebellar control of postural scaling and central set in stance. J Neurophysiol. 1994;72:479–493. doi: 10.1152/jn.1994.72.2.479. [DOI] [PubMed] [Google Scholar]
- Jansen-Osmann P, Richter S, Konczak J, Kalveram KT. Force adaptation transfers to untrained workspace regions in children: evidence for developing inverse dynamic motor models. Exp Brain Res. 2002;143:212–220. doi: 10.1007/s00221-001-0982-8. [DOI] [PubMed] [Google Scholar]
- Konczak J, Jansen-Osmann P, Kalveram KT. Development of force adaptation during childhood. J Mot Behav. 2003;35:41–52. doi: 10.1080/00222890309602120. [DOI] [PubMed] [Google Scholar]
- Lebel C, Walker L, Leemans A, Phillips L, Beaulieu C. Microstructural maturation of the human brain from childhood to adulthood. Neuroimage. 2008;40:1044–1055. doi: 10.1016/j.neuroimage.2007.12.053. [DOI] [PubMed] [Google Scholar]
- Malone LA, Bastian AJ. Thinking about walking: effects of conscious correction versus distraction on locomotor adaptation. J Neurophysiol. 2010;103:1954–1962. doi: 10.1152/jn.00832.2009. [DOI] [PMC free article] [PubMed] [Google Scholar]
- Martin TA, Keating JG, Goodkin HP, Bastian AJ, Thach WT. Throwing while looking through prisms. I. Focal olivocerebellar lesions impair adaptation. Brain. 1996a;119:1183–1198. doi: 10.1093/brain/119.4.1183. [DOI] [PubMed] [Google Scholar]
- Martin TA, Keating JG, Goodkin HP, Bastian AJ, Thach WT. Throwing while looking through prisms. II. Specificity and storage of multiple gaze-throw calibrations. Brain. 1996b;119:1199–1211. doi: 10.1093/brain/119.4.1199. [DOI] [PubMed] [Google Scholar]
- Maschke M, Gomez CM, Ebner TJ, Konczak J. Hereditary cerebellar ataxia progressively impairs force adaptation during goal-directed arm movements. J Neurophysiol. 2004;91:230–238. doi: 10.1152/jn.00557.2003. [DOI] [PubMed] [Google Scholar]
- Morton SM, Bastian AJ. Cerebellar contributions to locomotor adaptations during splitbelt treadmill walking. J Neurosci. 2006;26:9107–9116. doi: 10.1523/JNEUROSCI.2622-06.2006. [DOI] [PMC free article] [PubMed] [Google Scholar]
- Müller K, Hömberg V. Development of speed of repetitive movements in children is determined by structural changes in corticospinal efferents. Neurosci Lett. 1992;144:57–60. doi: 10.1016/0304-3940(92)90715-j. [DOI] [PubMed] [Google Scholar]
- Packwood J, Gordon B. Stereopsis in normal domestic cat, Siamese cat, and cat raised with alternating monocular occlusion. J Neurophysiol. 1975;38:1485–1499. doi: 10.1152/jn.1975.38.6.1485. [DOI] [PubMed] [Google Scholar]
- Pang MY, Lam T, Yang JF. Infants adapt their stepping to repeated trip-inducing stimuli. J Neurophysiol. 2003;90:2731–2740. doi: 10.1152/jn.00407.2003. [DOI] [PubMed] [Google Scholar]
- Patla AE, Prentice SD, Rietdyk S, Allard F, Martin C. What guides the selection of alternate foot placement during locomotion in humans. Exp Brain Res. 1999;128:441–450. doi: 10.1007/s002210050867. [DOI] [PubMed] [Google Scholar]
- Paus T, Zijdenbos A, Worsley K, Collins DL, Blumenthal J, Giedd JN, Rapoport JL, Evans AC. Structural maturation of neural pathways in children and adolescents: in vivo study. Science. 1999;283:1908–1911. doi: 10.1126/science.283.5409.1908. [DOI] [PubMed] [Google Scholar]
- Rabe K, Livne O, Gizewski ER, Aurich V, Beck A, Timmann D, Donchin O. Adaptation to visuomotor rotation and force field perturbation is correlated to different brain areas in patients with cerebellar degeneration. J Neurophysiol. 2009;101:1961–1971. doi: 10.1152/jn.91069.2008. [DOI] [PubMed] [Google Scholar]
- Reisman DS, Block HJ, Bastian AJ. Interlimb coordination during locomotion: what can be adapted and stored? J Neurophysiol. 2005;94:2403–2415. doi: 10.1152/jn.00089.2005. [DOI] [PubMed] [Google Scholar]
- Reisman DS, Wityk R, Silver K, Bastian AJ. Locomotor adaptation on a split-belt treadmill can improve walking symmetry post-stroke. Brain. 2007;130:1861–1872. doi: 10.1093/brain/awm035. [DOI] [PMC free article] [PubMed] [Google Scholar]
- Russell DF, Zajac FE. Effects of stimulating Deiters' nucleus and medial longitudinal fasciculus on the timing of the fictive locomotor rhythm induced in cats by DOPA. Brain Res. 1979;177:588–592. doi: 10.1016/0006-8993(79)90478-5. [DOI] [PubMed] [Google Scholar]
- Scheidt RA, Dingwell JB, Mussa-Ivaldi FA. Learning to move amid uncertainty. J Neurophysiol. 2001;86:971–985. doi: 10.1152/jn.2001.86.2.971. [DOI] [PubMed] [Google Scholar]
- Shadmehr R, Mussa-Ivaldi FA. Adaptive representation of dynamics during learning of a motor task. J Neurosci. 1994;14:3208–3224. doi: 10.1523/JNEUROSCI.14-05-03208.1994. [DOI] [PMC free article] [PubMed] [Google Scholar]
- Smith MA, Shadmehr R. Intact ability to learn internal models of arm dynamics in Huntington's disease but not cerebellar degeneration. J Neurophysiol. 2005;93:2809–2821. doi: 10.1152/jn.00943.2004. [DOI] [PubMed] [Google Scholar]
- Smith MA, Ghazizadeh A, Shadmehr R. Interacting adaptive processes with different timescales underlie short-term motor learning. PLoS Biol. 2006;4:e179. doi: 10.1371/journal.pbio.0040179. [DOI] [PMC free article] [PubMed] [Google Scholar]
- Strike SC, Taylor MJ. The temporal-spatial and ground reaction impulses of turning gait: is turning symmetrical? Gait Posture. 2009;29:597–602. doi: 10.1016/j.gaitpost.2008.12.015. [DOI] [PubMed] [Google Scholar]
- Takahashi CD, Scheidt RA, Reinkensmeyer DJ. Impedance control and internal model formation when reaching in a randomly varying dynamical environment. J Neurophysiol. 2001;86:1047–1051. doi: 10.1152/jn.2001.86.2.1047. [DOI] [PubMed] [Google Scholar]
- Takahashi CD, Nemet D, Rose-Gottron CM, Larson JK, Cooper DM, Reinkensmeyer DJ. Neuromotor noise limits motor performance, but not motor adaptation, in children. J Neurophysiol. 2003;90:703–711. doi: 10.1152/jn.01173.2002. [DOI] [PubMed] [Google Scholar]
- Tiemeier H, Lenroot RK, Greenstein DK, Tran L, Pierson R, Giedd JN. Cerebellum development during childhood and adolescence: a longitudinal morphometric MRI study. Neuroimage. 2010;49:63–70. doi: 10.1016/j.neuroimage.2009.08.016. [DOI] [PMC free article] [PubMed] [Google Scholar]
- Trouillas P, Takayanagi T, Hallett M, Currier RD, Subramony SH, Wessel K, Bryer A, Diener HC, Massaquoi S, Gomez CM, Coutinho P, Ben Hamida M, Campanella G, Filla A, Schut L, Timann D, Honnorat J, Nighoghossian N, Manyam B. International Cooperative Ataxia Rating Scale for pharmacological assessment of the cerebellar syndrome. The Ataxia Neuropharmacology Committee of the World Federation of Neurology. J Neurol Sci. 1997;145:205–211. doi: 10.1016/s0022-510x(96)00231-6. [DOI] [PubMed] [Google Scholar]
- Vallis LA, McFadyen BJ. Children use different anticipatory control strategies than adults to circumvent an obstacle in the travel path. Exp Brain Res. 2005;167:119–127. doi: 10.1007/s00221-005-0054-6. [DOI] [PubMed] [Google Scholar]
- Wallman J, Fuchs AF. Saccadic gain modification: visual error drives motor adaptation. J Neurophysiol. 1998;80:2405–2416. doi: 10.1152/jn.1998.80.5.2405. [DOI] [PubMed] [Google Scholar]