

Abstract
Background and Purpose
The volume of T2-hyperintense white matter (HWM) is an important neuroimaging marker of cerebral integrity, with a demonstrated high heritability. Pathophysiology studies have shown that the regional, ependymal and subcortical, HWM lesions are associated with elevated arterial pulse pressure (PP) and arterial blood pressure (BP), respectively. We performed bivariate, whole-genome linkage analyses for HWM volumes and BP-measurements to identify chromosomal regions that contribute jointly to both traits in a population of healthy Mexican Americans. Our aims were to localize novel quantitative trait loci (QTLs) acting pleiotropically upon these phenotypes and to replicate previous genetic findings on WB-HWM volume and BP measurements.
Methods
BP measurements and volumes of whole-brain (WB), subcortical and ependymal HWM lesions, measured from high-resolution (1mm3) 3D-FLAIR images, served as focal quantitative phenotypes. Data were collected from 357 (218 females; mean age=47.9±13.2years) members of large extended families who participated in the San Antonio Family Heart Study.
Results
Bivariate genome-wide linkage analyses localized a significant QTL influencing WB-and regional (ependymal) HWM volumes and PP and systolic BP, to chromosomal location 1q24 between markers D1S196–D1S1619. Several other chromosomal regions (1q42, 10q24–q26 and 15q26) exhibited suggestive linkages. The results of the post-hoc analyses that excluded 55 subjects taking anti-hypertensive medication showed no substantive differences from the results obtained in the full cohort.
Conclusion
This study confirms several previously observed QTLs influencing BP and cerebral integrity and identifies a novel significant QTL at chromosome 1q24. The genetic results strongly support a role for pleiotropically-acting genes jointly influencing BP and cerebral WM integrity.
Background and Purpose
The volume of T2-hyperintense white matter (HWM) lesions1 is an important neuroimaging marker of cerebral integrity, with a large (55–73%) proportion of its intersubject variability attributed to genetic factors2–5. Increases in HWM volume is correlated with a decline in cerebral blood flow6, glucose metabolism7, and cognition8, 9. Histopathologically, HWM lesions represent regions of accumulation of extra-cellular water due to focal degradation of the myelin sheath that arise from at least two distinct pathogenic mechanisms10. Ependymal lesions are the regions of periventricular gliosis and thought to be produced by mechanical damages caused to the ependymal lining by the pulsatile movements of CSF, a mechanism known as pulse-wave encelophaty11. The amplitude of the pulsatile CSF movements is linked to the pulse pressure (PP) - the difference between arterial, systolic blood pressure (SBP) and diastolic blood pressure (DBP). Elevated PP was shown to be associated with higher ependymal HWM volumes, even in normotensive individuals12, 13. In contrast, subcortical HWM lesions are predominantly the regions of focal cerebral ischemia that are associated with elevated SBP and are thought to the product of age-related stenosis and loss of permeability of capillaries due to small vessel disorders10, 11.
Recent findings by Turner and colleagues4 have identified overlap between genetic loci for the whole-brain (WM) HWM volume and blood pressure (BP) measurements in 488 hypertensive sibships 4. Turner and colleagues used bivariate, whole-genome linkage analyses to identify several significant and suggestive loci for WB-HWM and BP measurements, suggesting a high degree of pleiotropy between these traits. In the current manuscript, we pursued to replicate findings by Turner and colleagues4 using bivariate linkage analysis for WB-HWM volume and BP measurements. We performed these analyses in a well-studied, population of randomly selected Mexican American families. Our previous research in this population demonstrated significant heritability for HWM volumes and BP traits (Table 1) and showed that the two regional HWM volumes shared only a moderate ~21% (ρG=.46±0.12;p=.001) fraction of the genetic variance5, 14. Further, we demonstrated that the while the univariate linkage analyses for the HWM and BP traits did not produce statistically significant loci, these analyses have independently showed a locus of suggestive significance on the chromosome 1, q245, 14. An additional aim of this manuscript is to formally test the significance of the overlap between the genes influencing the volume of HWM lesions and those determining the individual variability in arterial BP on the chromosome 1 using a bivariate linkage analysis. A bivariate analysis can reveal chromosomal regions that contribute jointly to both traits either through the pleiotropic effects of the same genetic variants or the coincidental effects of closely linked genes4. Bivarate analysis also greatly improves the power of genetic discovery and the ability to localize causal, beyond what is possible by univariate linkage analyses4
Table 1.
Heritability (h2) Estimates and the pattern of significant covariance for the Whole-Brain (WM) and regional HWM volumes and three blood pressure (BP) measurements.
| Trait | Average ± stdandard deviation |
h2 | p | Significant Covariates (p<0.05) |
Variance Explained by Covariates |
|---|---|---|---|---|---|
| WB HWM | 2.50±2.81 cm3 | .72 | 1E-14 | Age (5E-14) | 28% |
| Subcortical-HWM | .61±1.34 cm3 | .66 | 4E-11 | Age (3E-16) | 27% |
| Ependymal-HWM | 1.84±2.07 cm3 | .73 | 1E-9 | Age (2E-9) | 20% |
| Systolic-BP | 122.6±16.6 mm Hg | .63 | 1E-6 | Age (1E-3) | 11% |
| Diastolic-BP | 71.3±10.8 mm Hg | .17 | .04 | None | 0% |
| Pulse-Pressure | 51.3±14.2 mm Hg | .49 | 1E-4 | Age (1E-3), Age2 (1E-4) | 23% |
Methods
Subjects and measurements
357 (218 females) active participants in the San Antonio Family Heart Study (SAFHS)15, were recruited as the part of this study. The Mexican American individuals are from large extended pedigrees selected randomly from the community. Subjects ranged in age from 19 to 85 years of age (47.9±13.2years) and were part of 47 families (9.3±8.1 individuals/family; range 2–38). Subjects were excluded for MRI contraindications, history of neurological illnesses or major neurological event (stroke). At the time of the collection of blood pressure measurements, 122 subjects (77 females; average age = 54.8±13.0) were self-reported to have hypertension and 55 subjects (41 female, average age 58.5±12.0 years) were reported to take anti-hypertensive medications. Additionally, 65 subjects were reported to have the type II diabetes and 13 subjects were reported to have heart disorders. To reduce the possible confounding effects of the anti-hypertensive drugs, we repeated all analyses in a cohort that excluded these subjects. This smaller cohort, after removing these individuals, consisted of 302 subjects (177 females) with the average age of 46.3±12.7 years and exhibited only slightly lower average SBP (120±16.4), DBP (70.1±10.6) and PP (50.5±13.9) values than those of the full cohort (Table 1). All subjects provided written informed consent on forms approved by the Institutional Review Board of the University of Texas Health Science Center at San Antonio (UTHSCSA).
Collection of the SBP and DBP measurements was detailed in Rutherford et al.14 In short, SBP and DBP measurements were performed using a random-zero sphygmomanometer on the left arm. Three measurements were performed with 5 min intervals and average of the last two measurements was used as trait values. Pulse pressure (PP) was calculated as the difference between SBP and DBP. Brain imaging and image analysis procedures were described in detail elsewhere5. Brain images were collected an average of 3.0±0.8 (maximum = 5.3) years after the BP measurements. Hence, there is a prospective element to the brain measures. Imaging was performed at the Research Imaging Institute, UTHSCSA, using a Siemens 3T Trio scanner and a high-resolution 8-channel head coil. 3D, T2-weighted imaging data were acquired using a high-resolution (isotropic 1mm), turbo-spin-echo Fluid Attenuated Inversion Recovery (FLAIR) sequence with the following parameters: TR/TE/TI/Flip angle/ETL=5sec/353ms/1.8s/180°/221. FLAIR images were preprocessed by removal of non-brain tissue, registration to the Talairach frame and RF inhomogeneity correction. HWM regions were manually delineated in 3D-space using an in-house software (http://ric.uthscsa.edu/mango) by an experienced neuroanatomist with high (r2>.9) test-retest reproducibility. HWM regions were coded as ependymal regions, contiguous with CSF structures, and subcortical in accordance with a technique described in 5, 16. The WB-HWM volume and the volumes of subcortical and ependymal HWM were measured for each subject.
Genotyping
The details of the genotyping procedure can be found in Kammerer et al.17 After DNA was extracted from lymphocytes, fluorescently labeled primers from the MapPairs Human Screening set (versions 6 and 8 (Research Genetics, Huntsville, AL, USA)) and PCR were used to amplified 417 microsatellite markers spaced at approximately 10-cM intervals across 22 autosomes. An automated DNA sequencer (ABI Model 377 with Genescan and Genotyper software; Applied Biosystems, Foster City, CA, USA) was used. The average heterozygosity index for these markers was approximately 0.76. The sex-averaged marker map was confirmed by deCODE genetics and markers not on this map were placed by interpolation based on physical location18.
Bivariate, quantitative trait linkage analysis
Quantitative genetic analyses were performed using a variance components methods implemented in SOLAR19. Bivariate quantitative trait linkage analyses of HWM volumes and BP-traits were performed to localize potential quantitative trait loci (QTLs) influencing phenotypic variation to specific chromosomal locations 19. Model parameters were estimated using maximum likelihood. The hypothesis of significant linkage was assessed by comparing the likelihood of a classical additive polygenic model to that of a model allowing for both a polygenic component and a variance component due to linkage at a specific chromosomal location. The logarithm of odds (LOD) score given by the log10 of the ratio of the likelihood of the linkage and the polygenic model served as the test statistic for genetic linkage. Because unmodified bivariate LOD scores typically involve an extra degree of freedom, we calculated the single locus equivalent LOD for each bivariate localization test. We chose LOD scores of 2.0 and 3.0 as the minimal requirements for the suggestive (likely to occur 1 or fewer times by chance in a genome scan) and significant scores (genome-wide p-value = 0.05), respectively. Similar to previous studies, HWM-volumes and BP measurements were transformed using the inverse Gaussian transformation to assure normal range for kurtosis and skewness2–4. All genetic analyses were conducted with age, sex, age*sex, age2, age2*sex and diagnostic status for type 2 diabetes and heart disorder (encoded as 0 or 1) included as covariates.
Results
Bivarate, genome-wide linkage analyses produced three significant (LOD>3.0) and several suggestive (LOD>2.0) QTL localizations (Figure 1; Table 1). The highest LOD score (LOD=3.82) was observed for the WB-HWM and PP analysis at the chromosomal location 1q24, located 200 cM away from the p-terminus (Table 1). A significant linkage (LOD= 3.19) was also observed at this same location for the ependymal-HWM volume and PP. Additionally, a significant linkage (LOD=3.07) between WB-HWM volume and SBP was also observed at this location (Figure 1, Table 1). Bivariate analysis for sublobar-HWM volume and BP measurements only reached suggestive levels of significance (Table 1). The highest score (LOD=2.68) was observed for SBP at chromosomal location 10q24–q26, located 15 cM away from the p-terminus (Table 1). Additionally, a suggestive linkage site was observed for both regional HWM measurements and SBP, at the region of chromosome 15q26 (Table 1). There were no significant linkage results for any of the analyses that involved DBP, but a suggestive linkage site was identified on chromosome 10 for both regional HWM-volume traits (Table 1).
Figure 1.
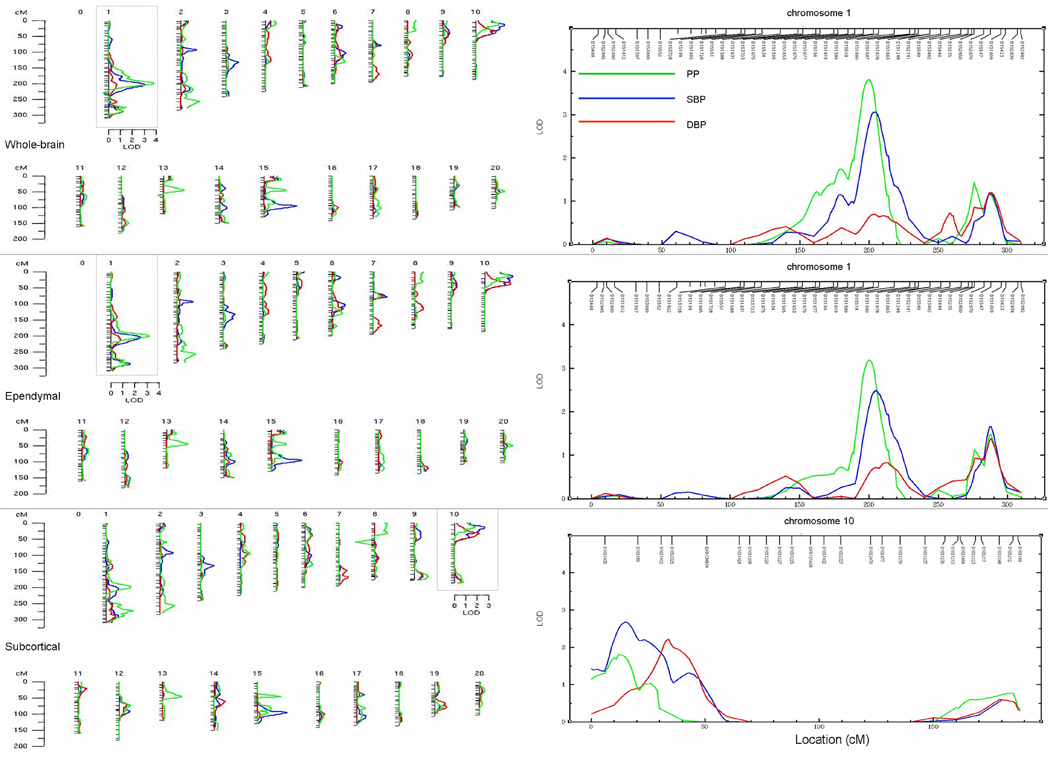
Bivariate linkage analysis results for WB (top), Ependymal (middle) and Subcortical (bottom) HWM volumes (bottom) and three measurements of arterial BP.
The results of the post-hoc analyses that excluded subjects taking anti-hypertensive medication showed no substantive differences from the results in the full cohort (Table 2). There were no new significant or suggestive genetic loci observed in the smaller cohort and there were only minute differences in the significance of the peaks. We observed a slight (but non-significant) increase in the LOD scores for the Ependymal and PP and WB and SBP analyses, from 3.19 to 3.40 and 3.07 to 3.14, respectively. We also observed a slight (non-significant) reduction in the significance for the WB and PP3 analysis from 3.82 to 3.62.
Table 2.
Significant (LOD>3.0; bold) and suggestive (LOD>2.0) LOD scores and locations (on Marshfield map, markers) between WB and regional HWM volumes and quantitative BP measurements.
| Chrom osome |
WB-HWM And |
Ependymal-HWM And |
Subcortical-HWM And |
||||||
|---|---|---|---|---|---|---|---|---|---|
| PP | SBP | DBP | PP | SBP | DBP | PP | SBP | DBP | |
| 1 | 3.82/3.62* (200;D1S196 - D1S1619) | 3.07/3.14* (203;D1S196 - D1S1619) | 3.19/3.40* (200;D1S196 - D1S1619) | 2.49/2.71* (204;D1S1619- D1S1589) | 2.37/2.38* (272;D1S446- D1S235) and 2.15 (200; D1S196 - D1S1619) | ||||
| 10 | 2.41/2.35* (15;D10S1435- D10S189) | 2.32/2.29* (15;D10S1435 - D10S189) | 2.16/2.17* (36;D10S2325) | 2.68/2.63* (15;D10S1435 - D10S189) | 2.21/2.20* (36;D10S2325) | ||||
| 15 | 2.72/2.71* (94;D15S116- D15S652) | 2.56/2.54* (95;D15S116- D15S652) | 2.59/2.60* (95;D15S116- D15S652) | ||||||
LOD values were calculated from a smaller cohort, which excluded 55 subjects with hypertension.
Discussion
Our study in healthy Mexican Americans individuals aimed to replicate a finding of shared genetic loci between HWM and quantitative BP traits, previously reported by Turner, et al. 4 in a study of hypertensive sibships. We performed these analyses in a cohort of well-characterized population of Mexican Americans. Additional, post-hoc analyses were performed in a cohort that excluded subjects taking anti-hypertensive medications. The genetic linkage analyses in both cohorts identified the same regions of significant and suggestive linkage and these loci overlapped with several loci reported by Turner and colleagues and with several loci previously identified by the univariate linkage analyses of BP, triglyceride levels and atherosclerosis traits performed by this and other groups. The highest linkage value (LOD=3.82/3.62 full vs. normotensive cohorts) was observed for the bivariate linkage analysis of WB-HWM volume and PP. This locus (chromosome 1q24) was also significant in the bivariate analyses of the WB-HWM and SBP and ependymal-HWM and PP (Table 2). This locus (1q24) was previously identified by our group as a suggestive locus as a part of the univariate analysis of systolic BP (SBP)14. It is known to harbor the constellation of selectin genes (SELP, SELL, and SELE) and also the coagulation factor V (F5) gene. In particular, the adhesion molecule P-selectin is a marker of potential endothelial dysfunction that has been implicated as a risk factor in essential hypertension20, 21 and stroke20, 22. Additionally, platelet-derived gene expression levels of SELP have been observed to be strongly and positively correlated with arterial BP 18, 23. This finding was replicated in our population, where we observed a highly significant, positive correlation between SELP mRNA expression levels and arterial BP34. No other gene transcripts in this region exhibited such a strong relationship with BP. Therefore, SELP appears to be a strong positional candidate gene that may be responsible for the significant QTLs on the chromosome 1. Further, deep sequencing and functional variants analyses will be required for the true identification.
Locations of two suggestive linkages identified by this study overlapped with locations of suggestive linkage reported by Turner, et al4. The first overlap was observed for the region on the chromosome 15, q26 (94 cM), where Turner and colleagues observed a suggestive QTL for the bivariate analysis of the WB-HWM and mean BP. This region was previously shown to be strongly associated with hypertension and regulation of blood lipids by the genome-wide association analyses of triglyceride levels23, 24. The second overlap was observed for the region on the chromosome 1q42 (272cM), where Turner and colleagues observed a suggestive QTL for the bivariate analysis of WB-HWM and PP. This region harbors the angiotensinogen gene and was previously implicated by a whole-genome linkage study in hypertensive individuals25.
However, we were unable to replicate findings by Turner and colleagues of the significant QTL on the chromosome 5 (95cM) and 11(19cM). Indeed, at these chromosomal locations, our peak LOD scores were only ~0.1–0.3 (Figure 1). That lack of complete overlap in genetic loci between these two studies could be due several potential issues. As with all complex disease genetic studies, power to localize such pleiotropic genetic effects can be limited and lead to discrepancies between studies. More fundamentally, genetic factors vary across different ethnicities. The study by Turner and colleagues was focused on populations of European ancestry while our study is the first to examine Mexican Americans, a population with significant Native American admixture. If relatively rare variants are involved in the determination of quantitative variability, we may expect considerable differences in the localization of the most important genetic loci across populations26. Linkage studies of such complex phenotypes cannot be used to exclude genetic regions for important QTLs. Therefore, the lack of concordance cannot be interpreted as evidence against the hypothesis that a QTL exists in a particular genomic region. Additionally, while we identified no significant genomic regions showing joint effects on DBP and HWM volumes, we cannot rule such loci out. Similarly, the lack of identification of genomic regions jointly influencing two phenotypes provides no evidence on their overall pleiotropic relationship.
Our findings supported the hypothesis that ependymal and subcortical WM lesions may have different causal genetic loci5, 11, 16, 27. We previously showed that ependymal and subcortical HWM volumes shared only 21% of genetic variance, which suggested that most of the genetic variation is non-overlapping5. In agreement with the pulse-wave encephalopathy mechanism of formation of the ependymal lesions, the linkage results for the bivariate, ependymal HWM volume and PP reached statistical significance (LOD=3.19). The linkage results for the subcortical HWM volume only reached suggesting significance, but the highest LOD score (LOD=2.68) was observed for the bivariate analysis with the SBP. This region, 10q24–q26, has been identified as a region of a significant linkage by univariate analyses of several atherosclerosis traits28, therefore supporting the hypothesis of a small-vessel mediated origin of subcortical HWM. We did not interpret the lack of the statistically significant linkage between subcortical HWM volume and SBP as an indication that hypertension does not play a role in the formation of the subcortical HWM lesions. The pathogenesis of subcortical HWM lesion is more complex as several additional factors including age-related, free-radical damage to oligodendrocytes and immune-system mediated gliosis were shown to contribute to the formation of subcortical lesions10, 29, 30 and these factors can reduce the sensitivity of HWM-SBP analysis. Further investigations, that include BP measurements in conjunction with systemic markers of inflation, as proposed by Alzheimer's Disease Neuroimaging Initiative31, will be necessary to help identify the genetic factors contributing to individual risks of this complex trait.
Limitation
A limitation of this analysis is the coarse, 10–15cM, chromosomal sampling of microsatellite markers. We are in the process of completing a high density single nucleotide (SNP) analysis in this population. This step will reduce the search space to approximately 500kb of sequence and further refine to locations of genetic loci.
Acknowledgements
This research was supported by National Institute of Biomedical Imaging and Bioengineering (K01 EB006395) grant to P.K., the National Heart Lung and Blood Institute (P01HL045522) to J.B., and the National Institute of Mental Health (R37MH059490 and R01MH078111) to JB and (R01MH0708143 and R01MH083824) to D.G.
Footnotes
Publisher's Disclaimer: This is a PDF file of an unedited manuscript that has been accepted for publication. As a service to our customers we are providing this early version of the manuscript. The manuscript will undergo copyediting, typesetting, and review of the resulting proof before it is published in its final citable form. Please note that during the production process errors may be discovered which could affect the content, and all legal disclaimers that apply to the journal pertain.
Conflicts of Interest
Authors have no conflicts of interest to disclose.
References
- 1.Kochunov P, Thompson PM, Coyle TR, Lancaster JL, Kochunov V, Royall D, Mangin JF, Riviere D, Fox PT. Relationship among neuroimaging indices of cerebral health during normal aging. Hum Brain Mapp. 2008;29:36–45. doi: 10.1002/hbm.20369. [DOI] [PMC free article] [PubMed] [Google Scholar]
- 2.Carmelli D, DeCarli C, Swan GE, Jack LM, Reed T, Wolf PA, Miller BL. Evidence for genetic variance in white matter hyperintensity volume in normal elderly male twins. Stroke. 1998;29:1177–1181. doi: 10.1161/01.str.29.6.1177. [DOI] [PubMed] [Google Scholar]
- 3.Reed T, Kirkwood SC, DeCarli C, Swan GE, Miller BL, Wolf PA, Jack LM, Carmelli D. Relationship of family history scores for stroke and hypertension to quantitative measures of white-matter hyperintensities and stroke volume in elderly males. Neuroepidemiology. 2000;19:76–86. doi: 10.1159/000026242. [DOI] [PubMed] [Google Scholar]
- 4.Turner ST, Fornage M, Jack CR, Jr, Mosley TH, Kardia SL, Boerwinkle E, de Andrade M. Genomic susceptibility loci for brain atrophy in hypertensive sibships from the genoa study. Hypertension. 2005;45:793–798. doi: 10.1161/01.HYP.0000154685.54766.2d. [DOI] [PubMed] [Google Scholar]
- 5.Kochunov P, Glahn D, Winkler A, Duggirala R, Olvera R, Cole SA, Dyer TD, Almasy L, Fox P, Blangero J. Analysis of genetic variability and whole genome linkage of whole-brain, subcortical and ependymal hyperintense white matter volume. Stroke. 2009;40:3685–3690. doi: 10.1161/STROKEAHA.109.565390. [DOI] [PMC free article] [PubMed] [Google Scholar]
- 6.Kraut MA, Beason-Held LL, Elkins WD, Resnick SM. The impact of magnetic resonance imaging-detected white matter hyperintensities on longitudinal changes in regional cerebral blood flow. J Cereb Blood Flow Metab. 2008;28:190–197. doi: 10.1038/sj.jcbfm.9600512. [DOI] [PubMed] [Google Scholar]
- 7.Kochunov P, Ramage AE, Lancaster JL, Robin DA, Narayana S, Coyle T, Royall DR, Fox P. Loss of cerebral white matter structural integrity tracks the gray matter metabolic decline in normal aging. Neuroimage. 2009;45:17–28. doi: 10.1016/j.neuroimage.2008.11.010. [DOI] [PMC free article] [PubMed] [Google Scholar]
- 8.Kochunov P, Robin D, Royall D, Lancaster J, Kochunov V, Coyle T, Schlosser A, Fox P. Can structural mri cerebral health markers track cognitive trends in executive control function during normal maturation and adulthood? Hum Brain Mapp. 2009;30:2581–2594. doi: 10.1002/hbm.20689. [DOI] [PMC free article] [PubMed] [Google Scholar]
- 9.Galluzzi S, Lanni C, Pantoni L, Filippi M, Frisoni GB. White matter lesions in the elderly: Pathophysiological hypothesis on the effect on brain plasticity and reserve. J Neurol Sci. 2008;273:3–9. doi: 10.1016/j.jns.2008.06.023. [DOI] [PubMed] [Google Scholar]
- 10.Fazekas F, Kleinert R, Offenbacher H, Schmidt R, Kleinert G, Payer F, Radner H, Lechner H. Pathologic correlates of incidental mri white matter signal hyperintensities. Neurology. 1993;43:1683–1689. doi: 10.1212/wnl.43.9.1683. [DOI] [PubMed] [Google Scholar]
- 11.Bateman GA. Pulse-wave encephalopathy: A comparative study of the hydrodynamics of leukoaraiosis and normal-pressure hydrocephalus. Neuroradiology. 2002;44:740–748. doi: 10.1007/s00234-002-0812-0. [DOI] [PubMed] [Google Scholar]
- 12.Nair GV, Chaput LA, Vittinghoff E, Herrington DM. Pulse pressure and cardiovascular events in postmenopausal women with coronary heart disease. Chest. 2005;127:1498–1506. doi: 10.1378/chest.127.5.1498. [DOI] [PubMed] [Google Scholar]
- 13.Miura K, Soyama Y, Morikawa Y, Nishijo M, Nakanishi Y, Naruse Y, Yoshita K, Kagamimori S, Nakagawa H. Comparison of four blood pressure indexes for the prediction of 10-year stroke risk in middle-aged and older asians. Hypertension. 2004;44:715–720. doi: 10.1161/01.HYP.0000145108.23948.7b. [DOI] [PubMed] [Google Scholar]
- 14.Rutherford S, Cai G, Lopez-Alvarenga JC, Kent JW, Voruganti VS, Proffitt JM, Curran JE, Johnson MP, Dyer TD, Jowett JB, Bastarrachea RA, Atwood LD, Goring HH, Maccluer JW, Moses EK, Blangero J, Comuzzie AG, Cole SA. A chromosome 11q quantitative-trait locus influences change of blood-pressure measurements over time in mexican americans of the san antonio family heart study. Am J Hum Genet. 2007;81:744–755. doi: 10.1086/521151. [DOI] [PMC free article] [PubMed] [Google Scholar]
- 15.Mitchell BD, Kammerer CM, Blangero J, Mahaney MC, Rainwater DL, Dyke B, Hixson JE, Henkel RD, Sharp RM, Comuzzie AG, VandeBerg JL, Stern MP, MacCluer JW. Genetic and environmental contributions to cardiovascular risk factors in mexican americans. The san antonio family heart study. Circulation. 1996;94:2159–2170. doi: 10.1161/01.cir.94.9.2159. [DOI] [PubMed] [Google Scholar]
- 16.Henry Feugeas MC, De Marco G, Peretti II, Godon-Hardy S, Fredy D, Claeys ES. Age-related cerebral white matter changes and pulse-wave encephalopathy: Observations with three-dimensional mri. Magn Reson Imaging. 2005;23:929–937. doi: 10.1016/j.mri.2005.09.002. [DOI] [PubMed] [Google Scholar]
- 17.Kammerer CM, Schneider JL, Cole SA, Hixson JE, Samollow PB, O'Connell JR, Perez R, Dyer TD, Almasy L, Blangero J, Bauer RL, Mitchell BD. Quantitative trait loci on chromosomes 2p, 4p, and 13q influence bone mineral density of the forearm and hip in mexican americans. J Bone Miner Res. 2003;18:2245–2252. doi: 10.1359/jbmr.2003.18.12.2245. [DOI] [PubMed] [Google Scholar]
- 18.Goring HH, Curran JE, Johnson MP, Dyer TD, Charlesworth J, Cole SA, Jowett JB, Abraham LJ, Rainwater DL, Comuzzie AG, Mahaney MC, Almasy L, MacCluer JW, Kissebah AH, Collier GR, Moses EK, Blangero J. Discovery of expression qtls using large-scale transcriptional profiling in human lymphocytes. Nat Genet. 2007;39:1208–1216. doi: 10.1038/ng2119. [DOI] [PubMed] [Google Scholar]
- 19.Almasy L, Blangero J. Multipoint quantitative-trait linkage analysis in general pedigrees. Am J Hum Genet. 1998;62:1198–1211. doi: 10.1086/301844. [DOI] [PMC free article] [PubMed] [Google Scholar]
- 20.Zee RY, Cook NR, Cheng S, Reynolds R, Erlich HA, Lindpaintner K, Ridker PM. Polymorphism in the p-selectin and interleukin-4 genes as determinants of stroke: A population-based, prospective genetic analysis. Hum Mol Genet. 2004;13:389–396. doi: 10.1093/hmg/ddh039. [DOI] [PubMed] [Google Scholar]
- 21.Blann AD, Nadar SK, Lip GY. The adhesion molecule p-selectin and cardiovascular disease. Eur Heart J. 2003;24:2166–2179. doi: 10.1016/j.ehj.2003.08.021. [DOI] [PubMed] [Google Scholar]
- 22.Preston RA, Coffey JO, Materson BJ, Ledford M, Alonso AB. Elevated platelet p-selectin expression and platelet activation in high risk patients with uncontrolled severe hypertension. Atherosclerosis. 2007;192:148–154. doi: 10.1016/j.atherosclerosis.2006.04.028. [DOI] [PubMed] [Google Scholar]
- 23.Duggirala R, Blangero J, Almasy L, Dyer TD, Williams KL, Leach RJ, O'Connell P, Stern MP. A major susceptibility locus influencing plasma triglyceride concentrations is located on chromosome 15q in mexican americans. Am J Hum Genet. 2000;66:1237–1245. doi: 10.1086/302849. [DOI] [PMC free article] [PubMed] [Google Scholar]
- 24.Browning BL, Browning SR. Haplotypic analysis of wellcome trust case control consortium data. Hum Genet. 2008;123:273–280. doi: 10.1007/s00439-008-0472-1. [DOI] [PMC free article] [PubMed] [Google Scholar]
- 25.Wang WY, Glenn CL, Zhang W, Benjafield AV, Nyholt DR, Morris BJ. Exclusion of angiotensinogen gene in molecular basis of human hypertension: Sibpair linkage and association analyses in australian anglo-caucasians. Am J Med Genet. 1999;87:53–60. doi: 10.1002/(sici)1096-8628(19991105)87:1<53::aid-ajmg11>3.0.co;2-i. [DOI] [PubMed] [Google Scholar]
- 26.Blangero J, Williams JT, Almasy L. Novel family-based approaches to genetic risk in thrombosis. J Thromb Haemost. 2003;1:1391–1397. doi: 10.1046/j.1538-7836.2003.00310.x. [DOI] [PubMed] [Google Scholar]
- 27.Bateman GA. Pulse wave encephalopathy: A spectrum hypothesis incorporating alzheimer's disease, vascular dementia and normal pressure hydrocephalus. Med Hypotheses. 2004;62:182–187. doi: 10.1016/S0306-9877(03)00330-X. [DOI] [PubMed] [Google Scholar]
- 28.Zhang Q, Lewis CE, Wagenknecht LE, Myers RH, Pankow JS, Hunt SC, North KE, Hixson JE, Jeffrey Carr J, Shimmin LC, Borecki I, Province MA. Genome-wide admixture mapping for coronary artery calcification in african americans: The nhlbi family heart study. Genet Epidemiol. 2008;32:264–272. doi: 10.1002/gepi.20301. [DOI] [PubMed] [Google Scholar]
- 29.Beckman KB, Ames BN. The free radical theory of aging matures. Physiol Rev. 1998;78:547–581. doi: 10.1152/physrev.1998.78.2.547. [DOI] [PubMed] [Google Scholar]
- 30.Bartzokis G, Sultzer D, Lu PH, Nuechterlein KH, Mintz J, Cummings JL. Heterogeneous age-related breakdown of white matter structural integrity: Implications for cortical "Disconnection" In aging and alzheimer's disease. Neurobiol Aging. 2004;25:843–851. doi: 10.1016/j.neurobiolaging.2003.09.005. [DOI] [PubMed] [Google Scholar]
- 31.Walhovd KB, Fjell AM, Brewer J, McEvoy LK, Fennema-Notestine C, Hagler DJ, Jr., Jennings RG, Karow D, Dale AM. Combining mr imaging, positron-emission tomography, and csf biomarkers in the diagnosis and prognosis of alzheimer disease. AJNR Am J Neuroradiol. 31:347–354. doi: 10.3174/ajnr.A1809. [DOI] [PMC free article] [PubMed] [Google Scholar]