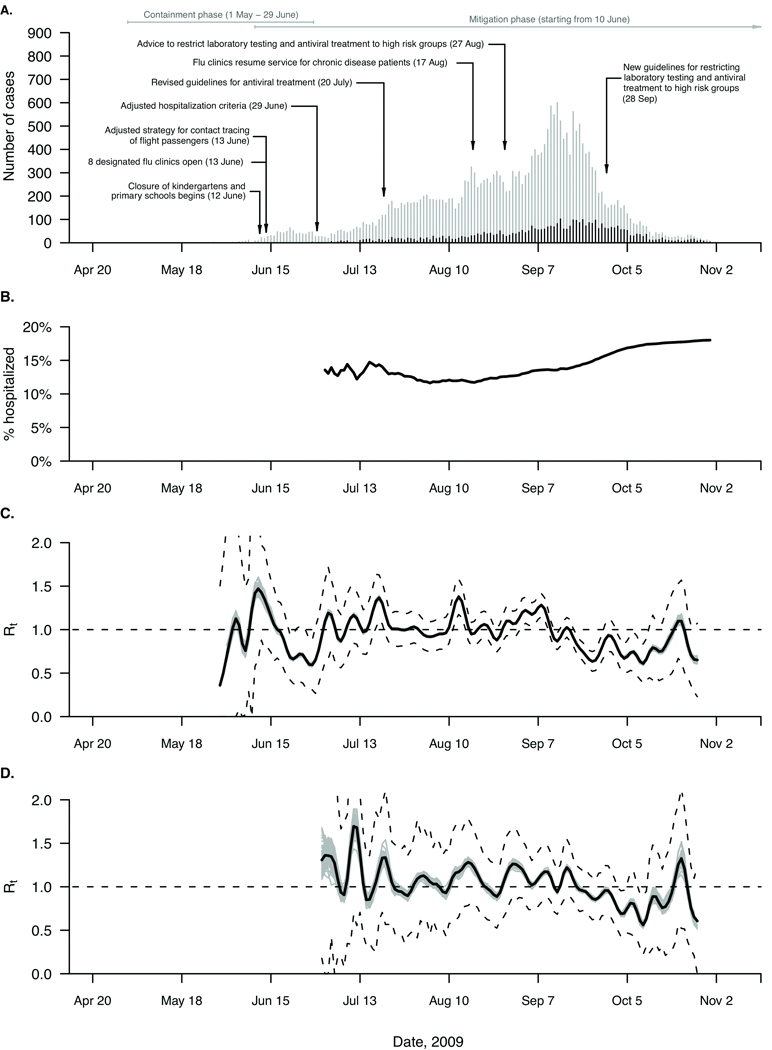
Figure 1.
A. Number of cases of laboratory-confirmed cases of pandemic influenza A (H1N1) virus infection (gray) and hospitalizations (black) by date of illness onset and dates of important control measures, Hong Kong, from April through October 2009. B. The cumulative proportion of hospitalized cases among all pandemic H1N1 notifications with 95% pointwise confidence intervals. C. Daily estimates of the effective reproduction number Rt based on pandemic H1N1 notifications with 95% confidence intervals, where the dashed line represents the threshold of Rt = 1. D. Daily estimates of the effective reproduction number Rt based on pandemic H1N1-associated hospitalizations with 95% confidence intervals, where the dashed line represents the threshold of Rt = 1.

