Methods to measure protein biomarkers with ultralow detection limit (DL) and high sensitivity promise to provide valuable tools for early diagnosis of diseases such as cancer, and for monitoring therapy and post-surgical recurrence.[i, ii] Surface plasmon resonance (SPR) utilizing nanoparticle-antibody labels for signal amplification in immunoassays is an emerging approach for detecting proteins in biomedical samples.[iii–x] Herein, we show for the first time that clustering of superparamagnetic labels on SPR surfaces leads to unprecedented sensitivity and ultralow DL for protein biomarkers in serum. Specifically, antibody bioconjugates on 1 µm diameter superparamagnetic particles (MP) used for off-line antigen capture enabled SPR detection of cancer biomarker prostate specific antigen (PSA) in serum at an ultralow DL of 10 fg mL−1 (~300 aM). This approach opens doors for accurate diagnostics based on new protein biomarkers with inherently low concentrations.
SPR immunoassays involve attaching capture antibodies (Ab1) to an SPR chip and measuring signals after capture of the protein analyte from the sample. Since SPR lacks ultrahigh sensitivity, gold and magnetic nanoparticles have been used as labels on secondary antibodies (Ab2) in sandwich assays to amplify SPR signals for biomarker detection by increasing average film thickness.[iii–x] For example, Au nanoparticle-antibody conjugates were used to detect human IgG (DL 1 ng mL−1),[iii] and PSA with DLs 0.15,[iv] 1.0,[vi] and 0.01 ng mL−1,[vii] in buffer. Magnetic nanoparticles have been used for conjugate preparation, analyte capture, and magnetic-assisted separation.[viii,xi] Magnetic nanoparticle-Ab2 conjugates were used to detect brain natriuretic peptide in plasma (DL 1 ng mL−1),[viii] heat shock protein-70 in buffer (DL 0.3 µg mL−1),[ix] and staphylococcal enterotoxin B in feces (DL 100 pg mL−1).[x]
Sensitivity and DLs for proteins in buffer can degrade significantly from corresponding determinations in patient samples such as serum or saliva.[xii] This is largely because non-specific binding (NSB) of any of the hundreds of non-analyte proteins in these media can seriously compromise DLs.[viii] Here, we report a simple method using superparamagnetic particles (Dynabeads®, Invitrogen), a commercial SPR flow sensor, and off-line analyte capture to attain ultrahigh sensitivity and ultralow DLs for a cancer biomarker protein in serum. High sensitivity is related to off-line reduction of NSB combined with clustering of the supermagnetic particles on the SPR chip. No previous reports using magnetic particle labels in SPR have elucidated such large amplification afforded by magnetic particle clustering.[viii–x]
We chose PSA as a model protein because of its established use as a clinical biomarker for prostate cancer.[xiii] For off-line PSA capture, we synthesized magnetic particle-Ab2 bioconjugates (MP-Ab2) using tosylated MPs [Supporting Information (SI)]. Protein assays estimated the number of Ab2 molecules per MP as 9±3 × 10⁴ and the number of Ab2 molecules per control 1 µm silica particle as ~5 × 10⁴. From surface area of the 1 µm particles and the projected area (πr2) of one Ab molecule (radius ~8 nm), we estimated a theoretical maximum of 6.4× 10⁴ Ab's per MP. Thus, the experimental 9±3 × 10⁴ per MP is within the error of estimated maximum coverage. In addition to advantages of lowering NSB by off-line PSA capture, this very large number of antibodies on the MP-Ab2 serves to drive the Ab2 + PSA = [Ab2•PSA] equilibrium towards binding and facilitate efficient capture of PSA.
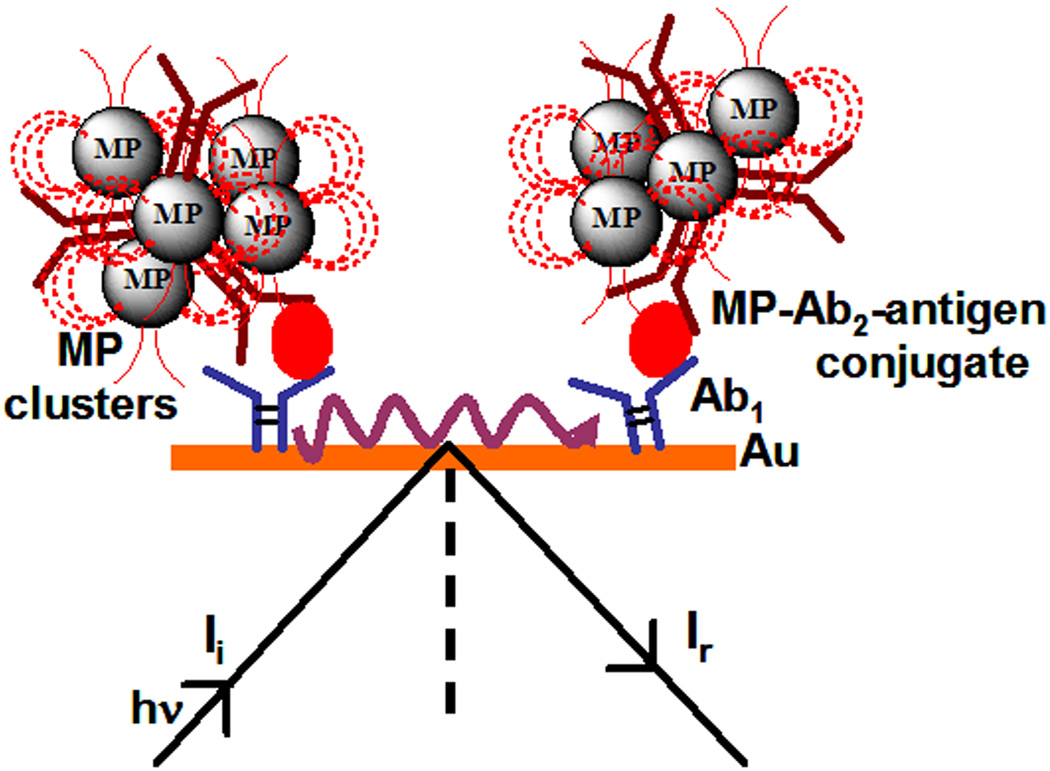
PSA in 40 µL calf serum was captured off-line by MP-Ab2. The resulting MP-Ab2-PSA particles were washed with blocking buffers, then injected into an SPR flow system and captured by antibodies on the gold SPR chip (Scheme 1). Unless otherwise specified, all SPR measurements were done in pH 7.0 phosphate buffer saline (PBS, 0.1 M in phosphate, 0.14 M NaCl, 2.7 mM KCl) containing 0.05% Tween-20 (PBS-T).
Scheme 1.
SPR immunosensor utilizing clustered magnetic microparticle-Ab2-antigen bioconjugate for signal amplification (Not drawn to scale).
Monoclonal antibodies (Ab1) to PSA were covalently immobilized onto carboxylate-functionalized Au-SPR chips (Reichert Inc.) using 1-ethyl-3-(3-dimethylaminopropyl) carbodiimide (EDC) and N-hydroxysuccinimide (NHS). Unreacted carboxyl groups were blocked by ethanolamine, and then treated with 2 % bovine serum albumin (BSA) in PBS-T to minimize NSB (SI, Fig. S1). SPR was monitored continuously after injection of the MP-Ab2-PSA bioconjugates. As controls, 1 µm diameter non-magnetic silica particle-Ab2-PSA (SP-Ab2-PSA) conjugates were prepared similarly and used in SPR (See SI).
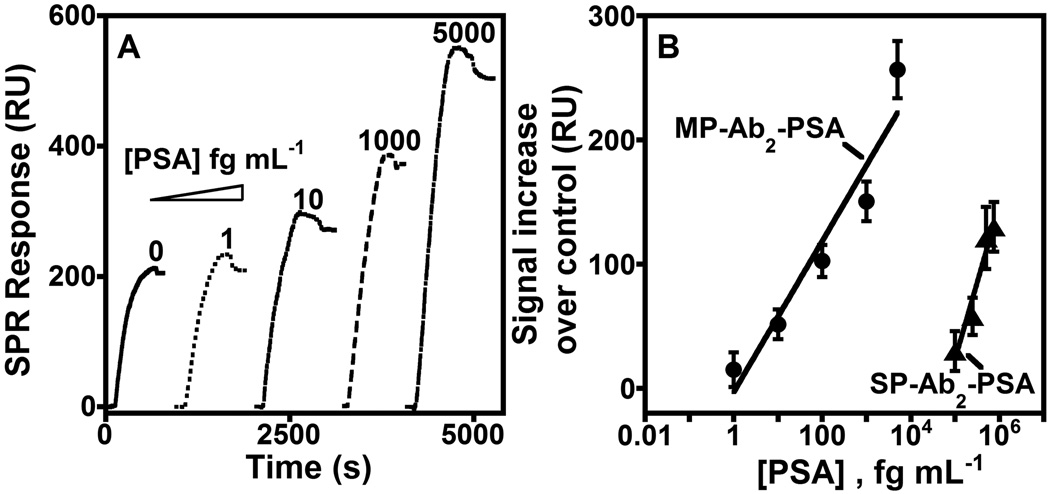
SPR curves for binding of MP-Ab2-PSA to Ab1 are shown in Fig. 1A in the fg mL−1 PSA range in calf serum, which provides a good human serum surrogate for immunoassay standardization. [xiv] Corresponding SPR curves for silica controls, SP-Ab2-PSA, were not observed in the fg mL−1 range, but required pg mL−1 concentrations of PSA before signals were observed (SI, Fig. S2). The SPR signal increase above zero PSA using MP-Ab2 or SP-Ab2 labels is plotted in Fig. 1B. A single assay takes ~100 min. (See SI)
Figure 1.
Flow SPR for the binding of (A) MP-Ab2-PSA to covalently immobilized Ab1 on the SPR sensor surface and (B) influence of PSA concentration on maximum SPR signals (less zero PSA control) for the binding of MP-Ab2-PSA (●) and SP-Ab2-PSA (▲) conjugates made from different PSA concentrations in calf serum (as denoted). The zero PSA signal results mainly from NSB.
Using MP-Ab2 for off-line PSA capture, we obtained a DL of 10 fg mL−1 PSA (~300 aM) as 3 SD units larger than the zero PSA signal. This ultralow DL was 10,000-fold better than 100 pg mL−1 obtained with the non-magnetic SP-Ab2-PSA control. Further, sensitivity as slope of the calibration curve in resonance units (RU) per fg mL−1 PSA for MP-Ab2-PSA was ~220-fold larger than for SP-Ab2-PSA (Fig. 1B).
The DL for MP-Ab2 with the SPR sensor was ~1.5 times better than the previous most sensitive serum PSA determinations utilizing digital fluorescent enzyme-linked immunosorbent assay (ELISA, 14 fg mL−1 PSA)[ iia] and 33-fold better than by a DNA-based bio-barcode assay (330 fg mL−1).[ iib] However, a bio-barcode assay detected 30 aM PSA (1 fg mL−1) in goat serum.[ xv] We report here the lowest DL achieved to our knowledge thus far for PSA in serum by an SPR immunosensor. A recent non-magnetic gold-nanorod labeled SPR assay achieved a lower DL for IgE proteins,[xvi] but was not tested in serum.
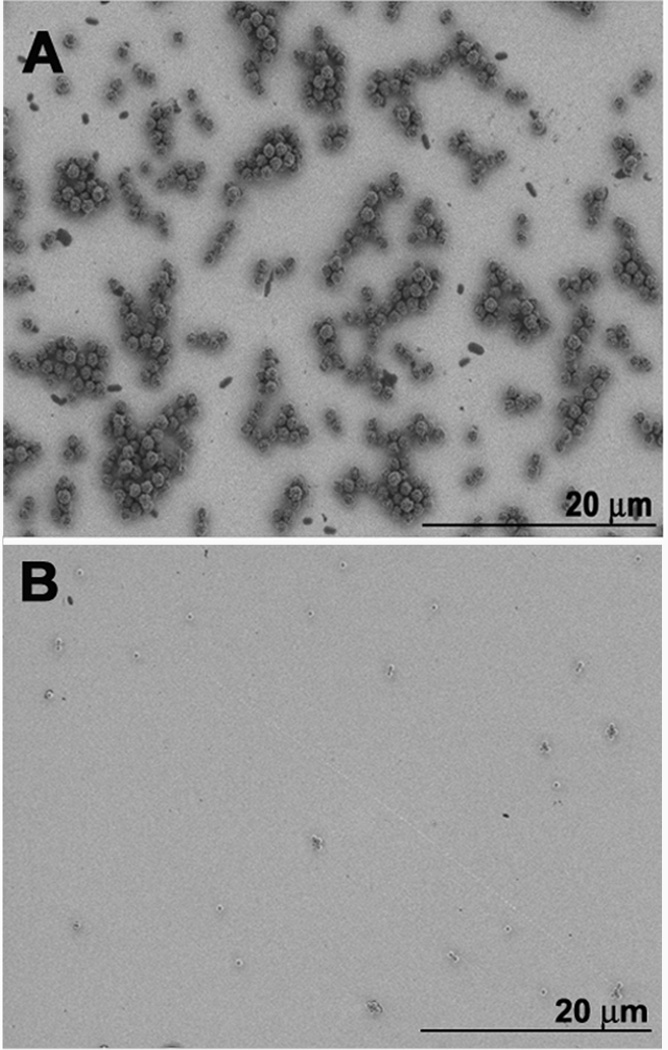
We used magnetic and silica particles of the same size (1 µm) to make MP-Ab2-PSA and SP-Ab2-PSA conjugates, but MPs showed 4-orders of magnitude lower DL representing a 10,000 fold signal enhancement compared to silica particles. This large amplification was attributed to MP-Ab2-PSA aggregates that form on the SPR chip while no noticeable SP-Ab2-PSA aggregates form in the low pg mL−1 PSA range (Fig. 2). Scanning electron microscope (SEM) images reveal these aggregates for MP-Ab2-PSA at 5 pg mL−1 PSA, but not with SP-Ab2-PSA (5 pg mL−1 PSA) (Fig. 2 A, B Fig. S5). The linear increase in SPR signal with increasing [PSA] in MP-Ab2-PSA conjugate (Fig.1) suggests that SPR signal depends on PSA because the amount of PSA captured on the SPR chip depends on its concentration in solution, while the extent of aggregation is independent of PSA concentration. This latter observation was confirmed by size distribution analysis of particle dispersions using dynamic light scattering (DLS) which showed significant PSA-independent aggregation of MP-Ab2-PSA, but no aggregation of SP-Ab2-PSA (SI, Figs. S3 and S4).
Figure 2.
Scanning electron microscopy images of (A) magnetic MP-Ab2-PSA (5 pg mL−1 PSA) and (B) non-magnetic control SP-Ab2-PSA (5 pg mL−1 PSA) bound to Ab1 on gold SPR surfaces.
SPR response (in RU) can be related by theory to the amount of bound antibody per unit area by the expression [xvii] 1RU ≈ 1 pg mm−2. Thus, relating the SPR signal response (in RU) to the number of magnetic particles on the SPR-chip using the known density (1.7 g cc−1) and dimensions of our MPs, we estimated that ~ 7 X 10³ pg mm−2 MPs (i.e. 7.9 X 10³ particles mm−2) are required to give the observed 104 fold SPR enhancement. This calculation assumes that the observed SPR amplification is a result of mass from the MP clusters bound up to the 300 nm evanescent wave distance from the Au-chip surface. Experimentally, from the analysis of MP-Ab2-PSA particles mm−2 area in SPR-chip from SEM images (Fig. 2A), we obtained about 6.3 × 10³ MP-Ab2-PSA particles mm−2 area over SP-Ab2-PSA. This accounts for ~8000 fold signal enhancement for MP-Ab2-PSA over SP-Ab2-PSA. The remaining 20% signal enhancement may arise from the higher refractive index of MP (~1.6) [xviiia] over SP (1.43). For comparison, a 0.04 unit change in refractive index of DNA amplified SPR by ~10 %.[xviiib] Based on this, the higher refractive index of MP over SP can contribute up to 40 % amplification. Also, we cannot rule out a minor contribution from the interaction of inherent magnetic field of the supermagnetic particle aggregates with the surface plasmons. [xix]
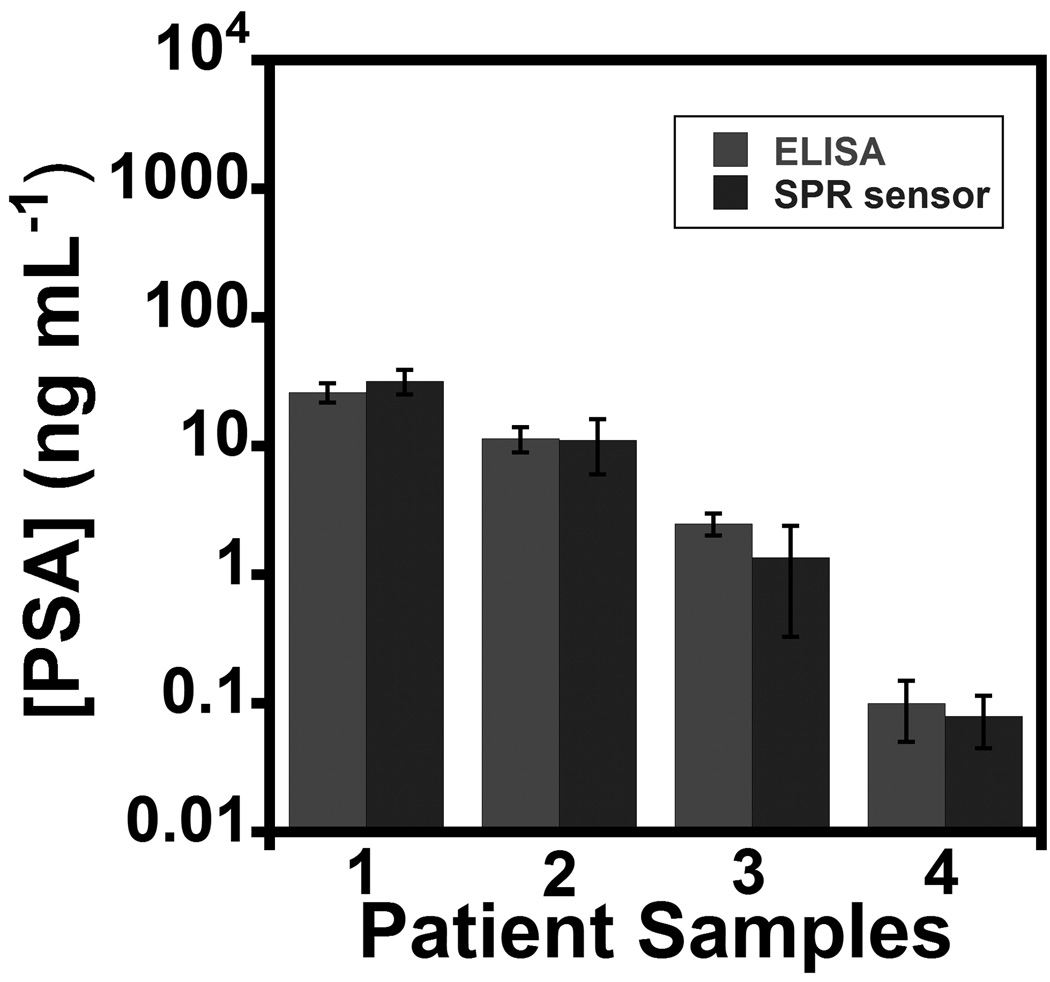
The SPR immunosensor with off-line MP-Ab2 sample capture was used to determine PSA in four human serum samples. Samples were diluted in buffer 20,000-fold to correspond to the linear range of the PSA calibration. Results showed excellent correlation to determinations of PSA in undiluted samples by ELISA (Fig. 3) over a clinically relevant range of PSA. There was no significant difference in PSA found between the two methods at the 95% confidence level (t-test). These results confirm good accuracy, as well as high selectivity for PSA in the presence of thousands of other proteins in serum.
Figure 3.
SPR immunosensor results for patient serum samples assayed using magnetic particle labels and off-line capture compared to standard ELISA. Samples 1–3 were from males diagnosed with prostate cancer and 4 was from a cancer-free female. Error bars show standard deviations (n =3).
In summary, we have demonstrated an unprecedented low DL for a cancer biomarker protein at aM levels in serum using an SPR immunosensor with MP amplification. The approach gave excellent correlation with ELISA for PSA in cancer patient serum. The added value of the low DL is in detection of recurrent prostate cancer, and in applications to future protein biomarkers with extremely low serum levels. The ultrahigh sensitivity is attributed mainly to mass and RI enhancement from clustered magnetic particle conjugates on the SPR chip. Given the good linear dynamic range of SPR response (Fig. 1B), and the lack of dependence of MP aggregation on concentration of PSA (SI, Figs. S3 and S4), we speculate that an antibody bound analyte-MP particle or aggregate on the SPR surface may act as a nucleation site for the binding of further MP particles or aggregates, as predicted for single magnetic domain induced superparamagnetic particle aggregation.[xx] The approach should also be applicable to other proteins and small molecules. Further studies are underway to uncover the full details of reproducible surface aggregation and signal amplification.
Experimental Section
Materials and Methods
Prostate specific antigen (PSA), 1-ethyl-3-(3-dimethylaminopropyl)carbodiimide (EDC), and N-hydroxy succinimide (NHS) were from Sigma. Monoclonal primary antihuman PSA antibody (Ab1, clone no. CHYH1), and secondary anti-PSA antibody (Ab2, clone no.CHYH2) were from Anogen/Yes Biotech Laboratory, Ltd. Tosyl activated superparamagnetic microparticles (MP, Dynabeads®, 1 µm diameter) were obtained from Invitrogen. Carboxyl-functionalized silica microparticles (SP, 1 µm diameter) were from Bangs Laboratories Inc. (IN, USA). PSA standards were prepared in calf serum. [xiv] Human serum samples were from Capital Biosciences (Rockville, MD).
Surface plasmon resonance (SPR) was done using an SR7000DC Dual Channel flow SPR Spectrometer from Reichert Analytical Instruments (NY, USA). SPR gold chips with mixed self-assembled monolayer of 90% monothiol alkane PEG3-OH and 10% monothiol alkane PEG6-COOH) were from Reichert (SR7000). SPR was done in pH 7.0 phosphate buffer saline (PBS, 0.1 M in phosphate, 0.14 M NaCl, 2.7 mM KCl) containing 0.05% Tween-20 (PBS-T). Scanning electron microscopy (SEM) of MP-Ab2-PSA and SP-Ab2-PSA bound to capture antibodies on SPR chips were done using Zeiss field-emission scanning electron microscope (DSM 982 Gemini).
Ab2 was covalently conjugated to tosyl-activated MP following the protocol provided by Invitrogen (see SI for details of bioconjugate preparations). For standard curve generation, PSA in 40 µL calf serum was stirred with the MP-Ab2 or SP-Ab2 for 90 min at 37 °C to capture PSA off-line.[xv, xxi]
Footnotes
This work was financially supported by U.S. PHS grant ES013557 from NIEHS/NIH (JFR) and a grant from NSF DMR-0604815 (CVK). The authors are grateful to Ms. Aparna Iyer for SEM measurements. S.K. and V.M. contributed equally to this work.
Supporting information for this article is available on the WWW under http://www.angewandte.org
Contributor Information
Sadagopan Krishnan, Department of Chemistry, University of Connecticut, Storrs, CT, USA 06269.
Vigneshwaran Mani, Department of Chemistry, University of Connecticut, Storrs, CT, USA 06269.
Dhanuka Wasalathanthri, Department of Chemistry, University of Connecticut, Storrs, CT, USA 06269.
Challa V. Kumar, Department of Chemistry, University of Connecticut, Storrs, CT, USA 06269 Department of Molecular & Cell Biology, University of Connecticut, Storrs, CT, USA 06269.
James F. Rusling, Department of Chemistry, University of Connecticut, Storrs, CT, USA 06269; Department of Cell Biology, University of Connecticut Health Center, Farmington, CT, USA 06032.
References
- i.a) Kingsmore SF. Nat. Rev. Drug Discov. 2006;5:310–321. doi: 10.1038/nrd2006. [DOI] [PMC free article] [PubMed] [Google Scholar]; b) Kulasingam V, Diamandis EP. Nature Clin. Prac. Oncology. 2008;5:588–599. doi: 10.1038/ncponc1187. [DOI] [PubMed] [Google Scholar]; c) Giljohann DA, Mirkin CA. Nature. 2009;462:461–464. doi: 10.1038/nature08605. [DOI] [PMC free article] [PubMed] [Google Scholar]
- ii.a) Rissin DM, Kan CW, Campbell TG, Howes SC, Fournier DR, Song L, Piech T, Patel PP, Chang L, Rivnak RJ, Ferrell EP, Randall JD, Provuncher GK, Walt DR, Duffy DC. Nat. Biotechnol. 2010;28:595–599. doi: 10.1038/nbt.1641. [DOI] [PMC free article] [PubMed] [Google Scholar]; b) Thaxton CS, Elghanian R, Thomas AD, Stoeva SI, Lee J-S, Smith ND, Schaeffer AJ, Klocker H, Horninger W, Bartsch G, Mirkin CA. Proc. Natl. Acad. Sci. USA. 2009;106:18437–18442. doi: 10.1073/pnas.0904719106. [DOI] [PMC free article] [PubMed] [Google Scholar]
- iii.Lyon LA, Musick MD, Natan MJ. Anal. Chem. 1998;70:5177–5183. doi: 10.1021/ac9809940. [DOI] [PubMed] [Google Scholar]
- iv.Besselink GAJ, Kooyman RPH, van Os PJHJ, Engbers GHM, Schasfoort RBM. Anal. Biochem. 2004;333:165–173. doi: 10.1016/j.ab.2004.05.009. [DOI] [PubMed] [Google Scholar]
- v.Lee HJ, Wark AW, Corn RM. Analyst. 2008;133:975–983. doi: 10.1039/b717527b. [DOI] [PMC free article] [PubMed] [Google Scholar]
- vi.Huang L, Reekmans G, Saerens D, Friedt J-M, Frederix F, Francis L, Muyldermans S, Campitelli A, Hoof CV. Biosens. Bioelec. 2005;21:483–490. doi: 10.1016/j.bios.2004.11.016. [DOI] [PubMed] [Google Scholar]
- vii.Choi J-W, Kang D-Y, Jang Y-H, Kim H-H, Min J, Oh B-K. Coll. Surf. A. 2008;313–314:655–659. [Google Scholar]
- viii.Teramura Y, Arima Y, Iwata H. Anal. Biochem. 2006;357:208–215. doi: 10.1016/j.ab.2006.07.032. [DOI] [PubMed] [Google Scholar]
- ix.Sun Y, Bai Y, Song D, Li X, Wang L, Zhang H. Biosens. Bioelec. 2007;23:473–478. doi: 10.1016/j.bios.2007.06.016. [DOI] [PubMed] [Google Scholar]
- x.Soelberg SD, Stevens RC, Limaye AP, Furlong CE. Anal. Chem. 2009;81:2357–2363. doi: 10.1021/ac900007c. [DOI] [PMC free article] [PubMed] [Google Scholar]
- xi.Gao L, Zhuang J, Nie L, Zhang J, Zhang Y, Gu N, Wang T, Feng J, Yang D, Perrett S, Yan X. Nature Nanotech. 2007;2:577–583. doi: 10.1038/nnano.2007.260. [DOI] [PubMed] [Google Scholar]
- xii.Rusling JF, Kumar CV, Gutkind JS, Patel V. Analyst. 2010;135:2496–2511. doi: 10.1039/c0an00204f. [DOI] [PMC free article] [PubMed] [Google Scholar]
- xiii.Lilja H, Ulmert D, Vickers AJ. Nature Rev. Cancer. 2008;8:268–278. doi: 10.1038/nrc2351. [DOI] [PubMed] [Google Scholar]
- xiv.Yu X, Munge B, Patel V, Jensen G, Bhirde A, Gong JD, Kim SN, Gillespie J, Gutkind JS, Papadimitrakopoulos F, Rusling JF. J. Am. Chem. Soc. 2006;128:11199–11205. doi: 10.1021/ja062117e. [DOI] [PMC free article] [PubMed] [Google Scholar]
- xv.Nam JM, Thaxton CS, Mirkin CA. Science. 2003;301:1884–1886. doi: 10.1126/science.1088755. [DOI] [PubMed] [Google Scholar]
- xvi.Sim HR, Wark AW, Lee HJ. Analyst. 2010;135:2528–2532. doi: 10.1039/c0an00457j. [DOI] [PubMed] [Google Scholar]
- xvii.Stenberg E, Persson B, Roos H, Urbaniczky C. J. Colloid Interface Sci. 1991;143:513–526. [Google Scholar]
- xviii.a) Helseth LE, Wen HZ, Heinig P, Fischer ThM. Langmuir. 2004;20:6556–6559. doi: 10.1021/la049802o. [DOI] [PubMed] [Google Scholar]; b) Nelson BP, Grimsrud TE, Liles MR, Goodman RM, Corn RM. Anal. Chem. 2001;73:1–7. doi: 10.1021/ac0010431. [DOI] [PubMed] [Google Scholar]
- xix.a) Souche Y, Wagner E, Fournier T, Santos AD. J. Magn. Magn. Mater. 2004;272:2288–2290. [Google Scholar]; b) Sepulveda B, Calle A, Lechuga LM, Armelles G. Opt. Lett. 2006;31:1085–1087. doi: 10.1364/ol.31.001085. [DOI] [PubMed] [Google Scholar]; c) Jain PK, Xiao Y, Walsworth R, Cohen AE. Nano Lett. 2009;9:1644–1650. doi: 10.1021/nl900007k. [DOI] [PubMed] [Google Scholar]
- xx.a) Fonnum G, Johansson C, Molteberg A, Mørup S, Aksnes E. J. Magn. Magn. Mater. 2005;293:41–47. [Google Scholar]; b) Kachkachi H, Garanin DA. In: Surface Effects in Magnetic Nanoparticles. Fiorani D, editor. US: Springer; 2005. pp. 75–104. [Google Scholar]
- xxi.Stoeva SI, Lee J-S, Smith JE, Rosen ST, Mirkin CA. J. Am. Chem. Soc. 2006;128:8378–8379. doi: 10.1021/ja0613106. [DOI] [PubMed] [Google Scholar]


