Abstract
Macroautophagy is involved in the bulk degradation of long-lived cytosolic proteins and subcellular organelles, which is important for the survival of cells during starvation. To identify potential players of the autophagy process, we subjected HCT116 cells cultured in complete medium and in Earle's balanced salt solution to proteomics analysis. In approximately 1,500 protein spots detected, we characterized 52 unique proteins, whose expression levels were significantly changed following starvation. Notably, we found that Annexin A1 was significantly upregulated following starvation at both mRNA and protein levels. Inhibition of Annexin A1 expression with specific siRNA did not alter starvation-induced autophagy as measured by the level of lipidated LC3, but significantly reversed autophagy degradation as measured by the level of p62/SQSTM 1. Thus Annexin A1 seemed to be positively upregulated during starvation to promote autophagic degradation. Overall, the data presented in this study established a expression profile of the proteome in starved cells, which allowed the identification of proteins with potential signficance in starvation-induced autophagy.
Keywords: autophagy, starvation, Annexin A1, proteomics
Introduction
Alterations in nutritional status have a significant impact on the metabolism of the cells and thus their functions. Amino acid starvation up-regulates macroautophagy, hereafter referred to as autophagy, in yeast and in mammalian cells, which promotes the degradation of cellular proteins and subcellular organelles for the regeneration of nutrients [1; 2]. Autophagy is also important for the turnover of dysfunctional organelles and misfolded proteins in pathophysiological cases [3; 4]. Overall, autophagy is essential for cell homeostasis and cell adaptation to an adverse environment [3; 5].
Although early studies suggest that autophagy is characterized by non-specific bulk degradation, recent works have found that starvation-induced autophagy degradation proceeded in an ordered fashion with certain proteins/organelles degraded sooner than others [6]. In addition, certain proteins, such as p62/SQSTEM1, can act as an adaptor molecule for autophagy substrates [4; 7; 8]. In fact, the level of p62/SQSTM1 is elevated in autophagy-deficient status but is frequently reduced in autophagy activation condition despite that its level could be subjected to other regulations [8]. As such, the level of p62 has been used as a functional parameter of autophagy degradation under the classic condition of autophagy, such as starvation [8; 9; 10].
It is conceivable that the expression level of many proteins will be altered during a typical autophagy process. Here we studied the proteome of cells under starvation in order to define proteins that may participate in starvation-induced autophagy. As the result, Annexin A1 emerged as a promising candidate for the regulation of autophagy degradation.
Materials and Methods
Cell culture
HCT116 (Bax−/−) stably expressing GFP-LC3 cell lines [11] were maintained in McCoy's 5A with 10% fetal bovine serum (Invitrogen, CA) and standard supplements in a humidified incubator (37°C, 5% CO2). Starvation was conducted by incubating cells in Earle's balanced salt solution (EBSS).
Sample preparation for proteomics study
Cells were washed three times with ice-cold PBS. Cells were lysed with a buffer containing 5 mM EDTA, 9.5 M urea, 4% (v/v) CHAPS, 65 mM DTT, and protease inhibitors (Complete kit, Roche Diagnostics, Germany) for 1 h at 24°C. Cellular debris was removed by centrifugation for 15 min at 20,000 × g at 10°C. A 2-D clean-up kit (Amersham Bioscience, NJ) was used to remove non-protein contaminants of the supernatants. Protein pellets were dissolved in the lysis buffer containing 0.5% v/v IPG buffer (pH 3-10, nonlinear). After centrifuging the samples at 8,000 × g for 15 min at 10°C, supernatants were collected and stored at −80°C until analysis. Protein concentration was determined using a Bradford-based protein assay (Bio-Rad Laboratories).
Two-dimensional gel electrophoresis (2-DE)
The 2-DE procedure was performed as previously described [12; 13]. Briefly, 100 μg of total proteins were separated by isoelectric focusing using IPG strips (17 cm, pH 3-11 and pH 5-8, nonlinear) according to the following scheme: 12 h at 50 V, 0.5 h at 250 V, and 2.5 h at gradient from 250 to 8,000 V (35 kVh at 8,000 V). Strips were equilibrated with DTT and iodoacetamide. Strips were then placed onto 12% or 10 % SDS-PAGE for protein separation in the second dimension. Electrophoresis was carried out using a Vertical Gel Electrophoresis Apparatus system (Life Technologies) at 20°C at 120 V per gel for 8 h, or until the bromophenol blue dye had reached the bottom of the gel at room temperature. Gels were fixed overnight in 50% v/v ethanol containing 3% w/v phosphoric acid and washed with distilled water for 1 h. Gels were then equilibrated for 1 h in 34% v/v ethanol containing 17% ammonium sulfate, 3% w/v phosphoric acid and incubated in the same solution with 1 g/L of Coomassie Blue G-250 for 4-5 days. The visualized proteins on the 2D gels were digitalized at 400 dpi resolutions using a UMAX PowerLook 1120 scanner (UMAX Technologies, Inc., Dallas, USA).
Spot analysis
Examination of differentially expressed proteins was performed using the software Decodon (DECODON Gmbh, Germany). Gels from samples with the same treatment were considered as replicated groups, from which the average normalized spot intensities could be determined. A spot was regarded as being significant if the average intensity differed by 1.5 fold or more between the control and treatment groups. Spots with significance were subjected for further analysis.
MALDI-TOF MS and protein identification
Excised protein spots were subjected to in-gel tryptic digestion, followed by MALDI-TOF MS, which generated peptide mass fingerprints using Voyager-DE PRO (Applied Biosystems, Inc.) as described below. Excised protein spots were washed successively in water, 25 mM ammonium bicarbonate, ACN/25mM ammonium biocarbonate (1:1, v/v) and pure ACN. The dried gels were rehydrated in 25 mM ammonium bicarbonate (pH 7.8) containing 0.1 μg of trypsin-gold (Promega) for overnight at 37 °C. The resulting peptides were extracted twice from gel slices with ACN/water (3/2, v/v) containing 0.1 % TFA. The extracts were concentrated using a speed vacuum pump. The tryptic peptides were desalted and concentrated on Zip-Tip TM C18 colum to a final volume of 3 μl, according to the manufacturer's instruction (Millipore, Bedford, MA). Trypsin-digested samples (0.5 μl) were mixed with 0.5 μl of matrix (aCyano-4-hydroxycinnamic acid). Protein identification was performed as previously described [12; 13]. Trypsin and keratin peaks were excluded. Proteins identified with a score greater than 1,000, with sequence coverage more than 10% and at least four match peptides were considered significant. The differentially expressed proteins were classified in terms of their physiological functions and localizations using information from Entrez Gene of NCBI and the Swiss-Prot/TrEMBL protein knowledgebase.
Western blot analysis
Cells were lysated in the lysis buffer [50 mM Tris, 150 mM NaCl, 5 mM ethylenediaminetetraacetic acid (EDTA), 1 mM dithiothreitol (DTT), 0.5% NP-40, 100 μM phenylmethylsulfonyl fluoride, 20 μM aprotinin and 20 μM leupeptin, adjusted to (pH 8.0)]. Protein extracts (20-30 μg) were subjected to 12% SDS–PAGE and transferred to PVDF membranes (Millipore Corporation, Bedford, MA). Detection of specific proteins was carried out using the enhanced chemiluminescence method. Antibodies against the following molecules were used: Annexin A1, HSP70 and β-actin (Santa Cruz biotechnology, Santa Cruz, CA), VDAC (Calbiocam, San Diego, CA), p2/SQSTM1 (BD Biosciences, San Jose, CA) and LC3 [13]. Images were digitally acquired using Kodak 4000MM image station and densitometry was conducted using the companion software (Carestream Molecular Imaging, New Heaven, CT).
RT-PCR analysis
For RT-PCR, 1 μg of total RNA was used for first strand cDNA reaction using oligo d (T) primers and Superscript II reverse transcriptase at 42°C for 50 min. PCR was performed on aliquots of this reaction in a 50 μl-volume. Forward primer for Annexin A1 is GCA GGC CTG GTT TAT TGA AA. Reverse primer is GGT TGC TTC ATC CAC ACC TT, For β-actin, the forward primer is AGA AAA TCT GGC ACC ACA CC, and the reverse primer is CTC CTT AAT GTC ACG CAC GA. The PCR products were resolved electrophoretically on 1% agarose gel. The expression of the measured genes in each sample was normalized to the level of β-actin expression.
Immunofluorescence staining assay
Cells cultured in cover slips were fixed with 4% paraformaldehyde, permeabilized with 0.2% Triton X-100, and stained with an anti-Annexin A1 followed by a Cy3-conjugated secondary antibody. Hoechst 33342 (5 μg/ml) was used to counter-stain the nucleus. Images were obtained using a Nikon fluorescence microscope (Nikon Eclipse TE200, Melville NY) equipped with a digital camera (CoolSNAP HQ2, Photometrics, Tucson, AZ).
Small interfering RNA (siRNA)-mediated gene knockdown
siRNAs (0.1 μmol/L) against the human Annexin A1 (5′- AAUCCAUCCUCGGAUGUCGCU -3′)(Invitrogen) were transfected into 1 × 10⁵ HCT-116 cells using Oligofectamine for 48 hours before analysis.
Result and Discussion
Starvation-induced proteome changes in HCT116 cells
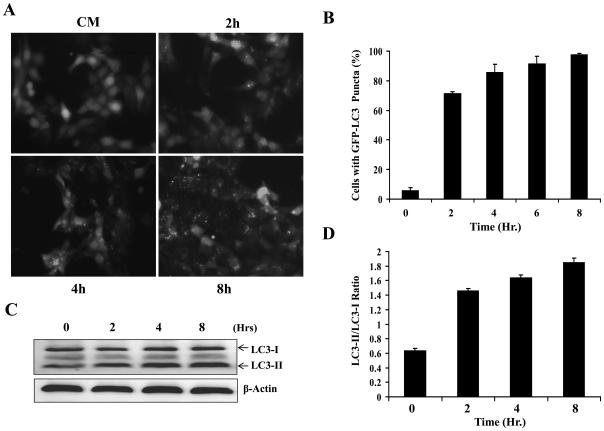
A characteristic feature of autophagy activation is the conversion of the LC3 from the unconjugated form (LC3-I) to the phosphatidylethanolamine-conjugated form (LC3-II) and the formation of LC3 puncta [1; 10]. Culture of HCT116 in EBSS elicited a strong formation of the lipidated LC3-II and GFP-LC3 puncta in a time-dependent manner (Fig. 1). Kinetic analysis of the puncta formation indicated that autophagy induction was obvious by 2 h after starvation although the level peaked around 8 hr.
Figure 1. Starvation induced a time-dependent autophagy in HCT116 cells.
(A-B). GFP-LC3-HCT116 cells were incubated in complete medium (CM) or EBSS for 2 to 8 hours. Representative images are shown in A and quantification data (mean ± SD) in B. (C-D). Lysates from cells subjected to EBSS for different times were analyzed by Western blot with the indicated antibodies. The positions of LC3-I and LC3-II are indicated (C). The density ratio of LC3-II vs LC3-I (D) was determined using Kodak Image Station 4000 software.
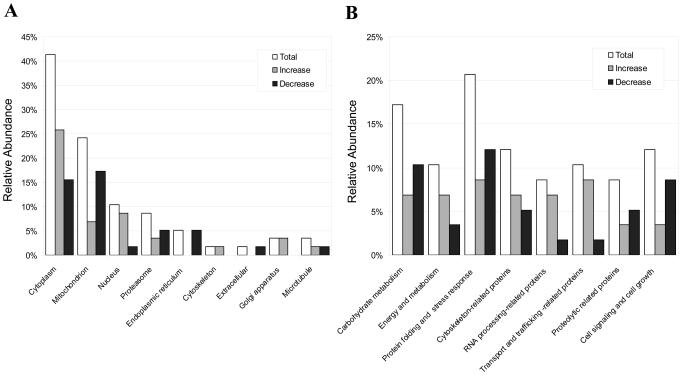
We intended to determine proteins that may participate in starvation-induced autophagy through the proteomic approach. We reasoned that proteome changes reflecting adaptive changes, including the induction of autophagy, would more likely occur at an earlier time point. We thus performed the proteomics analysis on HCT116 cells cultured in EBSS for only 2 h. From six different experiments, the 2-D electrophoresis of the lysates prepared from the starved cells exhibited a total of about 1,500 recognizable spots within a pH range of 3-10 and a molecular mass range of 10-170 kDa (supplemental Fig. 1). About 120 paired spots showing differential expression level of ≥1.5-fold between the control and EBSS treated groups were further examined, among which 58 spots were reliably identified. These 58 spots corresponded to 52 unique protein entries with the remaining six corresponding to different modification forms (Supplemental Table 1). Among these proteins, about half were increased (30) and the other half (28) were decreased in expression. We confirmed the expression change of a selected group of proteins by RT-PCR, western blot analysis and functional activity measurement (Supplemental Fig. 2). The most common source of proteins was the cytoplasm (41%), followed by the mitochondria (24%) and the nucleus (10%) and in each category there were proteins with increased or decreased expression (Fig. 2A).
Figure 2. The proteome alterations in HCT116 cells following starvation.
HCT116 cells were incubated with complete medium (Control) or EBSS (Starved) for 2 h. Proteins from whole cell lysates were separated on a pH 3–10 IPG strip or pH 5–8 IPG strip in the first dimension and on a 12% SDS-PAGE gel in the second dimension (Supplemental Figure 1). The relative distributions of the 58 identified proteins were shown according to their subcellular localization (A) and biological functions (B), with changes (increased or decreased) following starvation. See supplemental Table 1 for details.
These proteins also represent a functionally very diverse group of molecules and both increase and decrease in the expression had been observed in each category (Fig. 2B, Supplemental Table 1). Changes of some of the proteins were well correlated with previous findings by different means. For example, the chaperone protein, heat shock cognate 71 kDa protein (Hsc70), was up-regulated by starvation in HCT116 cells, consistent with the finding by Lenaerts et. al in mouse small intestine [14]. Hsc70 can bind to nascent polypeptides to facilitate correct folding. The 78-kDa glucose-regulated protein (GRP78) is a central regulator of endoplasmic reticulum (ER) homeostasis, functioning in protein folding, ER calcium binding and modulation of transmembrane ER stress sensor activity. Protein disulfide-isomerase A3 (PDIA3) is a member of the protein disulphide isomerase family of oxidoreductases, which are involved in native disulphide bond formation in the endoplasmic reticulum of mammalian cells. Both proteins was found here to be down-regulated in starvation, a condition activating autophagy, and conversely were found previously to be up-regulated in autophagy-deficient status [15].
The functional involvement of these proteins in macroautophagy is not obvious based on their known biological activities. In general, the alteration of protein level could be due to multiple reasons. From autophagy point of view, reduction of proteins in the cytosol could be due to autophagic degradation or due to recruitment to a membrane compartment, such as the autophagosomal membranes. On the other hand, the upregulation of proteins could suggest their participation in the autophagy processes or other processes. Notably, Hsc70, inorganic pyrophosphage and alpha-enolase, whose expressions were increased in this study, were also found to be enriched in the autophagosome membranes in a previous study [16]. Intriguingly, several other proteins that were found to be similarly enriched in the autophagosomal membranes or autophagosomes were actually reduced in the cytosol as shown in this study, which include GRP-78, endoplasmin and glyceraldehydes 3-phosphate dehydrogenase, as well an isoform of peroxiredoxin (peroxiredoxin 4) and glutathione Stransferase (GST- pi) [16]. This may suggest that these proteins were recruited to the autophagosome membranes or engulfed into the autophagosome as membrane substrates. Finally, the same protein could be involved in more than one process. Hsc 70 is well known for its central role in chaperone-mediated autophagy (CMA), recognizing cytosolic proteins that carry a KFERQ-like sequence and transport them to the lysosome [17]. CMA can work in a coordinated way with other autophagy pathway and could thus function together with macroautophagy in starvation [18]. Thus it is possible that upregulated Hsc70 might be important for CMA during starvation. Further studies would be required to discriminate all these processes.
The role of Annexin A1 in autophagy
Toward that end, one particular molecule that attracted our attention was Annexin A1. Annexin A1 is a member of the annexin superfamily, so termed because their principal property is to bind (i.e. to annex) to phospholipid membranes in a calcium-dependent manner [19]. Annexin A1 was originally considered to be a steroid-regulated protein and, thus, implicated in some of the beneficial actions of glucocorticoids [20]. However, it was the reported function in membrane trafficking [21] and vesiculation of multivesicular bodies (MVB) [22] that led us to postulate that Annexin A1 could be involved in autophagy. MVB may be important for autophagosome development by fusing with the latter to form the amphisome [23; 24; 25].
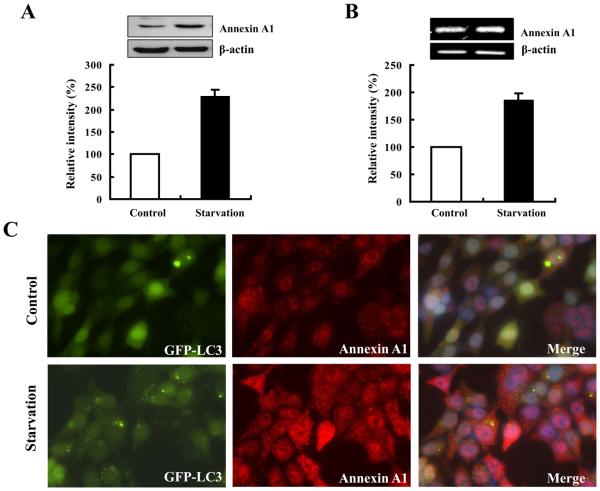
Annexin A1 level was increased in 2 h after starvation by more than three-fold by proteomics analysis. The increased expression level was confirmed by Western blot analysis, immunofluorescence staining and RT-PCR (Fig. 3), indicating that the elevation was at both transcriptional and translational levels. More interestingly, Annexin A1 signal appeared punctuated, consistent with a vesicular localization (Fig. 3C). Intriguingly, the puncta were dispersed throughout the cells and did not seem to be particularly colocalized with the GFP-LC3 puncta in starvation condition.
Figure 3. Upregulation of Annexin A1 by starvation.
The expression levels of Annexin A1 in control and EBSS-treated GFP-LC3 expressing HCT116 cells were measured by immunoblot (A), RT-PCR (B) and immunostaining (C). Note immunostaining had also indicated that Annexin A1 (red) was present in puncta form, most of which, however, were not colocalized with GFP-LC3 puncta (green). Nuclei were stained with Hoechst 33328.
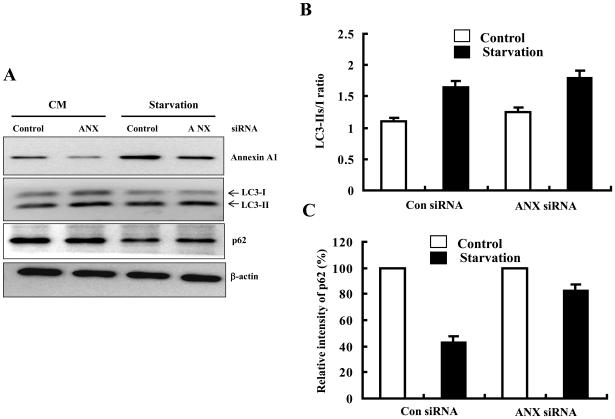
To determine whether Annexin A1 played a role in starvation-induced autophagy, we selectively knocked down its expression using specific siRNA (Fig. 4A). We then examined the induction of autophagy based on the formation of the lipidated LC3-II (Fig. 4A-B). The results showed that loss of Annexin A1 had minor effects, if any, on the formation of the lipidated LC3-II. However, autophagic degradation as indicated by the reduction of p62/SQSTM1, an autophagy adaptor molecule that links cellular substrates to autophagosomes and is co-degraded in the autolysosomes, was affected by Annexin A 1 (Fig. 4A, C). Thus in cells receiving siRNA against Annexin A1, the level of p62/SQSTM1 was not reduced, in contrast to the reduced level in starved cells given control siRNA. These data indicated that Annexin A1 could play a role in autophagy at the stage of substrate degradation, though not at the initiation stage.
Figure 4. Knockdown of Annexin A1 inhibited starvation-induced autophagic degradation.
HCT116 cells were transfected with control (Con) or Annexin A1-specific siRNA (ANX) for 48 hours. Cells were then cultured in complete medium (CM) or EBSS for 2 hr. Cell lysates were subjected to immunoblot assay with indicated antibodies (A). The densities of LC3 (B) and p62 (C) bands were quantified and calculated relative to that of β-actin.
Although it is not clear how Annexin A1 might regulate autophagy degradation, it is possible that this function may be related to the role of Annexin A1 in MVB dynamics. It has been demonstrated that in mammalian cells, autophagosomes undergo a process known as maturation by fusion with multiple types of endosomal vesicles, including MVB, to form the so-called amphisome structure [23; 24; 25]. It is thought that the formation of amphisome could allow these vesicles to acquire the ability to fuse with lysosomes in the mammalian cells. It is thus possible that by participating in the formation of MVB, Annexin A1 could promote the formation of the amphisome, thus the formation of autolysosomes. The degradation of autophagic materials in the autolysosome could thus be affected by the inhibition of Annexin A1. Our finding that Annexin A1 did not affect LC3 punctation, but the reduction of p62 would be consistent with the proposed biochemical role of Annexin A1.
It has yet to be determined how starvation may trigger the transcriptional activation of Annexin A1. However, the upregulation during starvation could be a positive mechanism to enhance autophagic degradation, thus providing more essential nutrients to sustain the life of starved cells. This kind of mechanism of enhancement of autophagy, particularly during starvation, at the level of autophagic degradation, does not seems to have been reported in the literature, thus representing a notable advancement in our understanding of autophagy regulation.
Supplementary Material
Acknowledgments
X-M. Yin was in part supported by NIH grants (CA 83817 and CA111456). The authors would like to thank Wen-Xing Ding for his generous help. J.-H. Kang is currently at Laboratory of Cell Biology, NCI, NIH, Bethesda, MD 20892.
Footnotes
Publisher's Disclaimer: This is a PDF file of an unedited manuscript that has been accepted for publication. As a service to our customers we are providing this early version of the manuscript. The manuscript will undergo copyediting, typesetting, and review of the resulting proof before it is published in its final citable form. Please note that during the production process errors may be discovered which could affect the content, and all legal disclaimers that apply to the journal pertain.
References
- 1.Ohsumi Y. Molecular dissection of autophagy: two ubiquitin-like systems. Nat Rev Mol Cell Biol. 2001;2:211–6. doi: 10.1038/35056522. [DOI] [PubMed] [Google Scholar]
- 2.Klionsky DJ. Autophagy: from phenomenology to molecular understanding in less than a decade. Nat Rev Mol Cell Biol. 2007;8:931–937. doi: 10.1038/nrm2245. [DOI] [PubMed] [Google Scholar]
- 3.Levine B, Kroemer G. Autophagy in the pathogenesis of disease. Cell. 2008;132:27–42. doi: 10.1016/j.cell.2007.12.018. [DOI] [PMC free article] [PubMed] [Google Scholar]
- 4.Kirkin V, McEwan DG, Novak I, Dikic I. A role for ubiquitin in selective autophagy. Mol Cell. 2009;34:259–69. doi: 10.1016/j.molcel.2009.04.026. [DOI] [PubMed] [Google Scholar]
- 5.Mizushima N, Levine B, Cuervo AM, Klionsky DJ. Autophagy fights disease through cellular self-digestion. Nature. 2008;451:1069–1075. doi: 10.1038/nature06639. [DOI] [PMC free article] [PubMed] [Google Scholar]
- 6.Kristensen AR, Schandorff S, Hoyer-Hansen M, Nielsen MO, Jaattela M, Dengjel J, Andersen JS. Ordered organelle degradation during starvation-induced autophagy. Mol Cell Proteomics. 2008;7:2419–28. doi: 10.1074/mcp.M800184-MCP200. [DOI] [PubMed] [Google Scholar]
- 7.Bjorkoy G, Lamark T, Brech A, Outzen H, Perander M, Overvatn A, Stenmark H, Johansen T. p62/SQSTM1 forms protein aggregates degraded by autophagy and has a protective effect on huntingtin-induced cell death. J Cell Biol. 2005;171:603–14. doi: 10.1083/jcb.200507002. [DOI] [PMC free article] [PubMed] [Google Scholar]
- 8.Komatsu M, Waguri S, Koike M, Sou YS, Ueno T, Hara T, Mizushima N, Iwata J, Ezaki J, Murata S, Hamazaki J, Nishito Y, Iemura S, Natsume T, Yanagawa T, Uwayama J, Warabi E, Yoshida H, Ishii T, Kobayashi A, Yamamoto M, Yue Z, Uchiyama Y, Kominami E, Tanaka K. Homeostatic levels of p62 control cytoplasmic inclusion body formation in autophagy-deficient mice. Cell. 2007;131:1149–63. doi: 10.1016/j.cell.2007.10.035. [DOI] [PubMed] [Google Scholar]
- 9.Yue Z, Wang QJ, Komatsu M. Neuronal autophagy: going the distance to the axon. Autophagy. 2008;4:94–6. doi: 10.4161/auto.5202. [DOI] [PMC free article] [PubMed] [Google Scholar]
- 10.Mizushima N, Yoshimori T, Levine B. Methods in mammalian autophagy research. Cell. 2010;140:313–26. doi: 10.1016/j.cell.2010.01.028. [DOI] [PMC free article] [PubMed] [Google Scholar]
- 11.Ding WX, Ni HM, Gao W, Hou YF, Melan MA, Chen X, Stolz DB, Shao ZM, Yin XM. Differential effects of endoplasmic reticulum stress-induced autophagy on cell survival. J Biol Chem. 2007;282:4702–10. doi: 10.1074/jbc.M609267200. [DOI] [PubMed] [Google Scholar]
- 12.Kang JH, Park KK, Lee IS, Magae J, Ando K, Kim CH, Chang YC. Proteome analysis of responses to ascochlorin in a human osteosarcoma cell line by 2-D gel electrophoresis and MALDI-TOF MS. J Proteome Res. 2006;5:2620–31. doi: 10.1021/pr060111i. [DOI] [PubMed] [Google Scholar]
- 13.Gao W, Kang JH, Liao Y, Ding WX, Gambotto AA, Watkins SC, Liu YJ, Stolz DB, Yin XM. Biochemical isolation and characterization of the tubulovesicular LC3-positive autophagosomal compartment. J Biol Chem. 2010;285:1371–83. doi: 10.1074/jbc.M109.054197. [DOI] [PMC free article] [PubMed] [Google Scholar]
- 14.Lenaerts K, Sokolovic M, Bouwman FG, Lamers WH, Mariman EC, Renes J. Starvation induces phase-specific changes in the proteome of mouse small intestine. J Proteome Res. 2006;5:2113–22. doi: 10.1021/pr060183+. [DOI] [PubMed] [Google Scholar]
- 15.Matsumoto N, Ezaki J, Komatsu M, Takahashi K, Mineki R, Taka H, Kikkawa M, Fujimura T, Takeda-Ezaki M, Ueno T, Tanaka K, Kominami E. Comprehensive proteomics analysis of autophagy-deficient mouse liver. Biochem Biophys Res Commun. 2008;368:643–9. doi: 10.1016/j.bbrc.2008.01.112. [DOI] [PubMed] [Google Scholar]
- 16.Overbye A, Fengsrud M, Seglen PO. Proteomic analysis of membrane-associated proteins from rat liver autophagosomes. Autophagy. 2007;3:300–22. doi: 10.4161/auto.3910. [DOI] [PubMed] [Google Scholar]
- 17.Majeski AE, Dice JF. Mechanisms of chaperone-mediated autophagy. Int J Biochem Cell Biol. 2004;36:2435–44. doi: 10.1016/j.biocel.2004.02.013. [DOI] [PubMed] [Google Scholar]
- 18.Kon M, Cuervo AM. Chaperone-mediated autophagy in health and disease. FEBS Lett. 2010;584:1399–404. doi: 10.1016/j.febslet.2009.12.025. [DOI] [PMC free article] [PubMed] [Google Scholar]
- 19.Gerke V, Moss SE. Annexins: from structure to function. Physiol Rev. 2002;82:331–71. doi: 10.1152/physrev.00030.2001. [DOI] [PubMed] [Google Scholar]
- 20.Flower RJ, Rothwell NJ. Lipocortin-1: cellular mechanisms and clinical relevance. Trends Pharmacol Sci. 1994;15:71–6. doi: 10.1016/0165-6147(94)90281-x. [DOI] [PubMed] [Google Scholar]
- 21.Diakonova M, Gerke V, Ernst J, Liautard JP, van der Vusse G, Griffiths G. Localization of five annexins in J774 macrophages and on isolated phagosomes. J Cell Sci. 1997;110(Pt 10):1199–213. doi: 10.1242/jcs.110.10.1199. [DOI] [PubMed] [Google Scholar]
- 22.White IJ, Bailey LM, Aghakhani MR, Moss SE, Futter CE. EGF stimulates annexin 1-dependent inward vesiculation in a multivesicular endosome subpopulation. Embo J. 2006;25:1–12. doi: 10.1038/sj.emboj.7600759. [DOI] [PMC free article] [PubMed] [Google Scholar]
- 23.Berg TO, Fengsrud M, Stromhaug PE, Berg T, Seglen PO. Isolation and characterization of rat liver amphisomes. Evidence for fusion of autophagosomes with both early and late endosomes. J Biol Chem. 1998;273:21883–92. doi: 10.1074/jbc.273.34.21883. [DOI] [PubMed] [Google Scholar]
- 24.Morvan J, Kochl R, Watson R, Collinson LM, Jefferies HB, Tooze SA. In vitro reconstitution of fusion between immature autophagosomes and endosomes. Autophagy. 2009;5:676–89. doi: 10.4161/auto.5.5.8378. [DOI] [PubMed] [Google Scholar]
- 25.Fader CM, Sanchez D, Furlan M, Colombo MI. Induction of autophagy promotes fusion of multivesicular bodies with autophagic vacuoles in k562 cells. Traffic. 2008;9:230–50. doi: 10.1111/j.1600-0854.2007.00677.x. [DOI] [PubMed] [Google Scholar]
Associated Data
This section collects any data citations, data availability statements, or supplementary materials included in this article.


