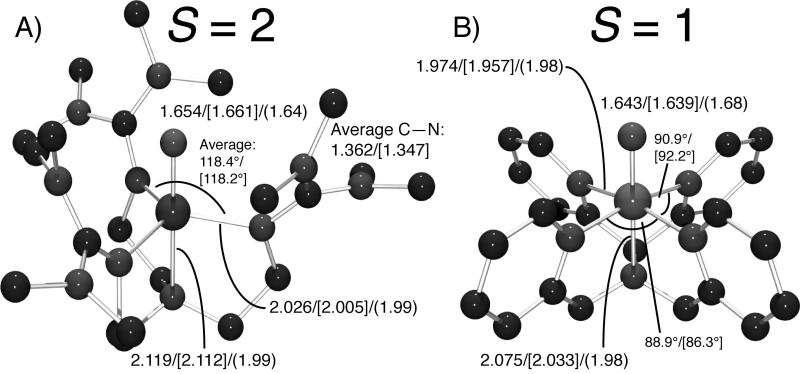
Mononuclear non-heme iron (NHFe) enzymes catalyze a number of key biological reactions including hydroxylation, desaturation, ring closure and halogenation.[1-3] The reactive intermediate that carries out many of the C–H bond activations is an S = 2 FeIV=O species that has been observed and characterized in several enzyme systems.[3-5] Synthetic efforts have yielded FeIV=O model complexes that exhibit an S = 1 ground state[6, 7] in all but three cases: (H2O)5FeIV=O[8], (H3buea)FeIV=O[9] and (TMG3tren)FeIV=O (1).[10] 1 has an FeIV=O unit ligated by TMG3tren in a C3ν trigonal bipyramidal geometry (Figure 1A), and an S = 2 ground state replicating that of enzyme intermediates.[10, 11] 1 is reactive in oxo-atom transfer and H-atom abstraction, but in the latter it is only as reactive as the approximately-C4v S = 1 (N4Py)FeIV=O (2, Figure 1B) complex where both have the same reaction rate with 1,4-cyclohexadiene (CHD).[10] Original studies from our group showed that whereas S = 1 reaction coordinates only have a □-attack pathway, involving the β-d□* orbital, available for electrophilic reactivity, S = 2 systems are predicted to possess an additional  -attack pathway involving the ⟨-dz2 orbital that is lowered in energy due to spin-polarization.[12, 13] This has recently been referred to as an exchange enhancement.[14] In this study, we utilize Nuclear Resonance Vibrational Spectroscopy (NRVS) to obtain ground-state vibrational data on 1 for comparison to 2[15] and, through correlations to DFT calculations, to understand the observed similar reactivities of 1 (S = 2) and 2 (S = 1). These studies define the steric and intrinsic electronic contributions to the reaction barriers and establish that both the S = 1 and S = 2 surfaces have significant steric contributions due to the different directionalities of substrate approach and thus similar intrinsic reactivities.
Figure 1.
Structures of A) 1 and B) 2, with bond lengths (Å) determined by DFT/[X-ray crystallography]/(EXAFS).
NRVS uses the Mössbauer 57Fe nuclear excitation (14.4 keV) from a synchrotron source to observe vibrational sidebands corresponding to the normal modes of the system being studied.[16-19] The advantage of NRVS over other vibrational spectroscopies is that it imparts spectral intensity only to normal modes involving Fe displacement (which consequently means that it detects all vibrational modes with Fe motion), thus focusing on the Fe active site with specificity and sensitivity.
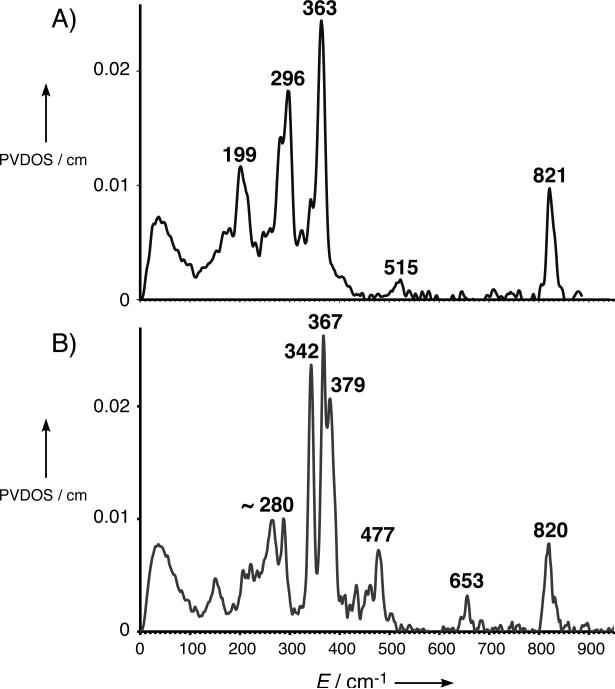
The partial vibrational density-of-states (PVDOS) spectrum of 1 is shown in Figure 2A. The highest-energy peak in the 0 – 900 cm−1 region is at 821 cm−1. At lower energy is a pair of prominent peaks at 363/296 cm−1. Finally, there is a broader peak at 199 cm−1.
Figure 2.
NRVS PVDOS spectra of A) 1 and B) 2 (adapted from Ref. [14]).
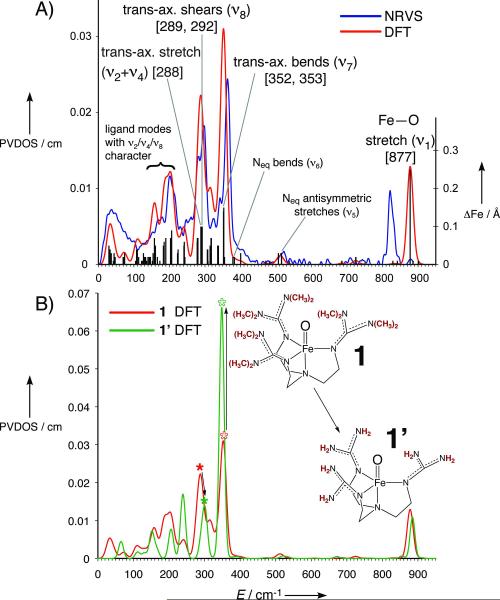
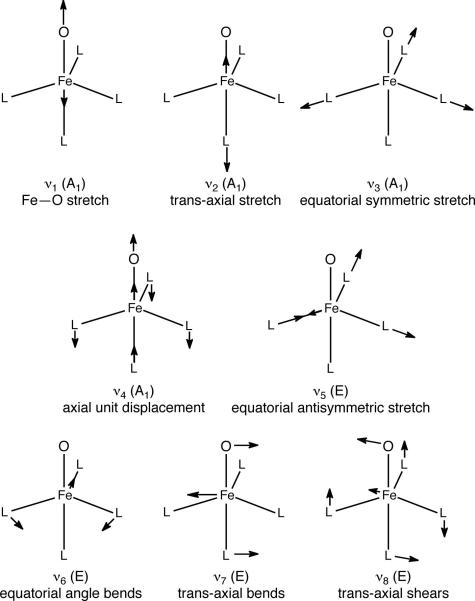
DFT optimizations of 1 using both the BP86 and B3LYP functionals gave structures in good agreement with X-ray crystallographic and EXAFS results (Figure 1A and Table S1, Supporting Information).[10, 11] Note that the DFT calculations and the crystal structure show that each guanidino group has its double bond delocalized over all three C—N bonds, as indicated by their equivalent bond lengths.[11] The calculated NRVS spectra for the structures optimized with BP86 (Figure 3A) and B3LYP (Figure S1, Supporting Information) overlay well with the experimental data, providing a good correlation and allowing assignment of the observed vibrational normal modes. The first-coordination-sphere vibrational modes for a C3ν molecule are shown in Figure 4. The highest-energy peak at 821 cm−1 is assigned to the Fe—O stretch ν [20]1 and corresponds to the equivalent stretch in 2 at 820 cm−1 (Figure 2B). At lower energy in Figure 3, the peak at 515 cm−1 originates from the antisymmetric equatorial stretches ν5, and is lower in energy than the same mode in 2 at 653 cm−1 because 1 has fewer and slightly-longer Fe—Neq bonds.
Figure 3.
A) DFT-calculated spectrum (red) of 1 overlaid with NRVS spectrum (blue) and ΔFe (black bars). Important normal mode assignments are labeled, with calculated energies in square brackets. B) Comparison of DFT-calculated spectra of 1 (red) and 1′ (green), with ν8 modes indicated by solid asterisks and ν7 modes indicated by hollow asterisks. Removing the steric wall transfers intensity from ν7 to ν8.
Figure 4.
First coordination sphere vibrational modes calculated (DFT) for a C3ν L4FeO molecule.
The next peak at lower energy is the most intense feature in the experimental data at 363 cm−1. From DFT calculations, this corresponds to the trans-axial bends  in Figure 4, predicted to be a degenerate E pair at 352/353 cm−1; in 2 these were split (Figure 2B, 342/367 cm−1) due to the equatorial asymmetry of the N4Py ligand caused by the axial chelate[15]. The collapse of these peaks into a single peak in 1 reflects the high equatorial symmetry imposed by the TMG3tren ligand on the Fe center.
Separated from this peak by 64 cm−1 is another prominent peak in the experimental data in Figure 2A at 296 cm−1, which has no corresponding feature in 2 (the broad feature at ~ 280 cm−1 has a much lower integrated intensity). Calculated to be under the envelope of this peak (in Figure 3A) are three normal modes: the pair of trans-axial shears ν8 at 289/292 cm−1 and the mixed  “trans-axial stretch” at 288 cm−1. From Figure 4, the motion in
  is ligand-based (N and O) with the Fe not making a significant contribution to the overall displacement in the modes. NRVS intensity is proportional to the contribution of Fe motion to the total mass-weighted mean square motion of the normal mode,[18] so the ν8 peak is not expected to be intense and in fact the analogous ν10 mode in 2[15] does not have significant intensity in its NRVS spectrum (calculated to be at ~ 210 cm−1). The high intensity of
  in 1 is attributed to the terminal guanidino methyl groups, as evidenced by the following: (i) replacing the methyl groups in 1 with H’s (1′, Figure 3B) results in the calculated NRVS intensity of
  dropping from 39% to 15% of
  ’s intensity; (ii) conversely, adding ortho-methyl groups to 2’s pyridines increases the corresponding ratio from 1% to 41% (Figure S2, Supporting Information). Thus, the presence of an axial “steric wall” of methyl groups around the oxo moiety hinders its motion in the
  modes, thereby increasing the Fe motion and thus the NRVS intensity of the
  modes. This Fe displacement in
  derives from mixing with
  which has predominantly Fe—O motion.
The mixed  mode is also under this peak, calculated to be at 288 cm−1, lower than the equivalent mode in 2 at 379 cm−1 due to longer Fe—N bonds and the loss of one Neq in 1 compared to 2.
Finally, the modes in the PVDOS for the 150 – 200 cm−1 region involve predominantly ligand motion with  mixed in, giving them NRVS intensity. Note that as
  loses intensity from the introduction of the steric effect of the methyl groups, about one-third of that intensity shifts into
 at ~ 290 cm−1 and the rest distributes over modes in this low-energy region.
It should be noted that the 477 cm−1 peak in 2 resulting from Neq angle bends has analogous weak ν6 modes in 1 predicted to fall under the shoulder at 380 cm−1 (Figure 3A).
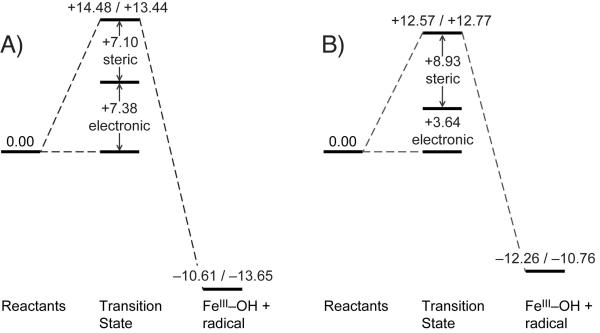
The DFT-based NRVS spectral assignments of 1 demonstrate that the sterics around the FeIV=O bond are responsible for the shift of intensity from  into the low-energy symmetric bending mode, leading to the presence of an intense trans-axial shear feature at 296 cm−1 not present in the NRVS data for the S = 1 FeIV=O models (including 2 in Figure 2) studied previously.[15] This steric wall evident from the NRVS data can also restrict axial access to the FeIV=O unit in 1 for a substrate approaching in a σ-trajectory, presenting an axial steric constraint affecting reactivity. We thus sought to determine the contribution of steric effects to the reactivity of 1 (S = 2) and 2 (S = 1), by computationally evaluating their CHD H-atom abstraction reaction coordinates. Our DFT calculations for their reaction energetics (Figure 5) are in agreement with the reaction barriers determined from experimental kinetics[10] as well as a recent DFT study.[21]
Figure 5.
Potential energy (ΔE/ΔG, with solvent correction) surfaces for the reactions of A) 1 and B) 2 with CHD, showing decomposition of activation barrier into steric (method 1) and electronic components.
From Figure 5, both 1 along an S = 2 (quintet) surface and 2 along an S = 1 (triplet) surface have similar electronic and Gibbs free energies associated with this reaction and similar O–H bond strengths of their initial FeIII–OH products. We estimated the steric contribution to these total reaction energies using two methods: (i) with the FeIV=O core frozen at the transition state structure, an undistorted CHD (from the reactants) at the transition state is allowed to geometry-optimize away from the FeIV=O core; (ii) with the same frozen core, the undistorted CHD is moved stepwise away (linearly) from the FeIV=O core (Scheme S1, Supporting Information). Both methods produce similar results showing that 1 has a steric contribution to its overall barrier of 7.1/6.8 kcal/mol (1st/2nd method) and thus an intrinsic electronic contribution of ~ 7 kcal/mol (Figure 5A). Importantly, for the S = 1 reaction coordinate of 2, there is also a steric contribution to the barrier due to the orientation of the CHD in π-approach. Following the above procedures, there is a significant steric contribution of 8.9/8.8 kcal/mol resulting in an intrinsic electronic barrier of ~ 4 kcal/mol (Figure 5B). It should be noted that in the case of 1, the undistorted CHD has a minor interaction between the C–H bond and the reactive ⟨-dz2 orbital, implying that the calculated value of 7.1 kcal/mol represents a lower limit for the steric contribution to the barrier. Thus, we observe that the S = 1 (π-attack) and S = 2 (σ-attack) FeIV=O species in these model complexes have similar steric contributions to their reaction barriers (see Figure S3, Supporting Information for electron density surfaces demonstrating steric clashes at the transition state), and upon removal of this steric component, the electronic component of their reaction barriers becomes comparable.
We have taken the above approaches to evaluate the steric barrier to preserve the identity of the original ligand and because the reactions of 1 and 2 with CHD result in FeIII–OH products with similar O–H bond strengths, which thereby takes into account any exchange effect on the energies of the products. The alternative approach used in Ref. [19] involved elimination of the tetramethylguanidino groups to form Neq ligating atoms of imine (sp2, double-bonded) character. This in fact results in a species that performs hydride-abstraction from CHD (to form a high-spin FeII–OH and CHD+) rather than H-atom abstraction, with an artificially-low barrier ΔG‡ of 2.3 kcal/mol and a highly-exergonic reaction free energy ΔG° of −35.7 kcal/mol, resulting from poorer ligand donation to the Fe (Figure S4 and Table S2, Supporting Information).
A significant result from these DFT calculations is that the S = 1 FeIV=O unit in 2 also has a steric barrier to substrate approach. This steric barrier results from the Fe–O–H angle of 128° required to orient the substrate C–H bond for π-attack in the S = 1 species, leading to close substrate approach to the equatorial pyridine ligands of 2. Removing this steric contribution lowers the barrier to ~ 4 kcal/mol, which is comparable to and in fact slightly lower than that of 1 (~ 7 kcal/mol). Thus, the intrinsic electronic reaction barriers of 1 (S = 2) and 2 (S = 1) are of comparable magnitude, and the additional steric barriers stem from the different orientations required for substrate attack. It has been postulated that the quintet surface should be more reactive due to the exchange stabilization associated with electron transfer;[21] however, the DFT calculations show that only ~ 40% of the electron has been transferred at the transition state, and as mentioned above, the FeIIIO–H bond strengths for the products that include the differences in exchange contributions are almost equivalent. From frontier molecular orbital (FMO) theory, the H-atom abstraction reaction requires a low-lying acceptor Fe orbital with a significant oxo coefficient to achieve favorable overlap.[22] For 2, the reactive β π*-FMO has 42% O px/y character (at 2.0 eV above the C–H donor), which is significantly higher than the 27% O pz character of the reactive α σ*-FMO of 1 (at 2.2 eV above the C–H donor), providing a larger bonding contribution to lowering the barrier for reaction on the triplet surface.
In summary, we have used a combined NRVS and DFT methodology to probe the geometric and electronic structures of the S = 2 FeIV=O species 1 relative to the S = 1 FeIV=O species 2. The NRVS spectra of 1 and 2 differ in that the presence of a steric wall around the oxo moiety in 1 results in the shift of NRVS intensity out of the trans-axial bends, resulting in an intense low-energy trans-axial shear feature not observed for 2. This steric wall raises the barrier for H-atom abstraction by σ-attack in 1. In the case of 2, there is no axial steric effect observable in the NRVS data; however, for the reaction along the S = 1 surface, the equatorial pyridine ligands sterically hinder π-attack. Estimates of steric contributions to the reaction barriers of both the S = 1 and S = 2 species show that the π- and σ-pathways have similar activity for the H-atom abstraction reaction, suggesting that the σ-pathway represents an additional but not necessarily more-reactive pathway available to the S = 2 species; this however does make the oxo moiety more accessible in NHFe enzymes because it possesses a σ- as well as the π-pathway for reactivity. This NRVS study on 1 thus defines a spectral probe for this axial σ -steric effect on the S = 2 FeIV=O intermediates in NHFe enzymes.
Experimental Section
Samples were prepared as previously reported.[10, 11] NRVS spectra were collected at beamline 3-ID of the Advanced Photon Source. DFT calculations were performed using the Gaussian 03 package (see the Supporting Information).
Supplementary Material
Footnotes
Use of the APS at the Argonne National Laboratory was supported by the U. S. Dept. of Energy, Office of Science, Office of Basic Energy Sciences, under Contract DE-AC02-06CH11357. Financial support for this research was provided by NIH Grants GM40392 (E.I.S.) and GM33162 (L.Q.) and an NSF-Biophysics Program Grant MCB-0342807 (E.I.S.).
References
- [1].Solomon EI, Brunold TC, Davis MI, Kemsley JN, Lee S-K, Lehnert N, Neese F, Skulan AJ, Yang Y-S, Zhou J. Chem. Rev. 2000;100:235. doi: 10.1021/cr9900275. [DOI] [PubMed] [Google Scholar]
- [2].Costas M, Mehn MP, Jensen MP, Que L., Jr. Chem. Rev. 2004;104:939. doi: 10.1021/cr020628n. [DOI] [PubMed] [Google Scholar]
- [3].Krebs C, Fujimori D. Galonić, Walsh CT, Bollinger JM. Acc. Chem. Res. 2007;40:484. doi: 10.1021/ar700066p. [DOI] [PMC free article] [PubMed] [Google Scholar]
- [4].Matthews M, Krest C, Barr E, Vaillancourt F, Walsh C, Green M, Krebs C, Bollinger J. Biochemistry. 2009;48:4331. doi: 10.1021/bi900109z. [DOI] [PMC free article] [PubMed] [Google Scholar]
- [5].Eser BE, Barr EW, Frantom PA, Saleh L, Bollinger JM, Krebs C, Fitzpatrick PF. J. Am. Chem. Soc. 2007;129:11334. doi: 10.1021/ja074446s. [DOI] [PMC free article] [PubMed] [Google Scholar]
- [6].Klinker EJ, Kaizer J, Brennessel WW, Woodrum NL, Cramer CJ, Que L., Jr. Angew. Chem., Int. Ed. 2005;44:3690. doi: 10.1002/anie.200500485. [DOI] [PubMed] [Google Scholar]
- [7].Que L., Jr. Acc. Chem. Res. 2007;40:493. doi: 10.1021/ar700024g. [DOI] [PubMed] [Google Scholar]
- [8].Pestovsky O, Stoian S, Bominaar EL, Shan X, Münck E, Que L, Jr., Bakac A. Angew. Chem., Int. Ed. 2005;44:6871. doi: 10.1002/anie.200502686. [DOI] [PubMed] [Google Scholar]
- [9].Lacy DC, Gupta R, Stone KL, Greaves J, Ziller JW, Hendrich MP, Borovik AS. J. Am. Chem. Soc. 2010;132:12188. doi: 10.1021/ja1047818. [DOI] [PMC free article] [PubMed] [Google Scholar]
- [10].England J, Martinho M, Farquhar ER, Frisch JR, Bominaar EL, Münck E, Que L., Jr. Angew. Chem., Int. Ed. 2009;48:3622. doi: 10.1002/anie.200900863. [DOI] [PMC free article] [PubMed] [Google Scholar]
- [11].England J, Guo Y, Farquhar ER, Young VG, Jr, Münck E, Que L., Jr. J. Am. Chem. Soc. 2010;132:8635. doi: 10.1021/ja100366c. [DOI] [PMC free article] [PubMed] [Google Scholar]
- [12].Decker A, Clay MD, Solomon EI. J. Inorg. Biochem. 2006;100:697. doi: 10.1016/j.jinorgbio.2006.01.013. [DOI] [PubMed] [Google Scholar]
- [13].Neidig ML, Decker A, Choroba OW, Huang F, Kavana M, Moran GR, Spencer JB, Solomon EI. Proc. Natl. Acad. Sci. U. S. A. 2006;103:12966. doi: 10.1073/pnas.0605067103. [DOI] [PMC free article] [PubMed] [Google Scholar]
- [14].Bell CB, III, Wong SD, Xiao Y, Klinker EJ, Tenderholt AL, Smith MC, Rohde J-U, Que L, Jr., Cramer SP, Solomon EI. Angew. Chem., Int. Ed. 2008;47:9071. doi: 10.1002/anie.200803740. [DOI] [PMC free article] [PubMed] [Google Scholar]
- [15].Shaik S, Chen H, Janardanan D. Nat. Chem. 2011;3:19. doi: 10.1038/nchem.943. [DOI] [PubMed] [Google Scholar]
- [16].Alp E, Mooney T, Toellner T, Sturhahn W. Hyperfine Interact. 1994;90:323. [Google Scholar]
- [17].Kohn V, Chumakov A. Hyperfine Interact. 2000;125:225. [Google Scholar]
- [18].Sage JT, Paxson C, Wyllie GRA, Sturhahn W, Durbin SM, Champion PM, Alp EE, Scheidt WR. J. Phys.: Condens. Matter. 2001;13:7707. [Google Scholar]
- [19].Sturhahn W. J. Phys.: Condens. Matter. 2004;16:S497. [Google Scholar]
- [20].Note that the NRVS value differs slightly from the rRaman value[10] due to a calibration difference.
- [21].Janardanan D, Wang Y, Schyman P, Que L, Jr., Shaik S. Angew. Chem., Int. Ed. 2010;49:3342. doi: 10.1002/anie.201000004. [DOI] [PMC free article] [PubMed] [Google Scholar]
- [22].Decker A, Rohde J-U, Klinker EJ, Wong SD, Que L, Jr., Solomon EI. J. Am. Chem. Soc. 2007;129:15983. doi: 10.1021/ja074900s. [DOI] [PMC free article] [PubMed] [Google Scholar]
Associated Data
This section collects any data citations, data availability statements, or supplementary materials included in this article.


