

Abstract
A wide array of molecular markers has been used to investigate the genetic diversity among common bean species. However, the best combination of markers for studying such diversity among common bean cultivars has yet to be determined. Few reports have examined the genetic diversity of the carioca bean, commercially one of the most important common beans in Brazil. In this study, we examined the usefulness of two molecular marker systems (simple sequence repeats – SSRs and amplified fragment length polymorphisms – AFLPs) for assessing the genetic diversity of carioca beans. The amount of information provided by Roger’s modified genetic distance was used to analyze SSR data and Jaccards similarity coefficient was used for AFLP data. Seventy SSRs were polymorphic and 20 AFLP primer combinations produced 635 polymorphic bands. Molecular analysis showed that carioca genotypes were quite diverse. AFLPs revealed greater genetic differentiation and variation within the carioca genotypes (Gst = 98% and Fst = 0.83, respectively) than SSRs and provided better resolution for clustering the carioca genotypes. SSRs and AFLPs were both suitable for assessing the genetic diversity of Brazilian carioca genotypes since the number of markers used in each system provided a low coefficient of variation. However, fingerprint profiles were generated faster with AFLPs, making them a better choice for assessing genetic diversity in the carioca germplasm.
Keywords: AFLPs, genetic structure, genetic variability, Phaseolus vulgaris L., SSRs
Introduction
The genus Phaseolus originated in the Americas and contains 55 species, five of which are widely cultivated: P. vulgaris L., P. lunatus L., P. coccineus L., P. acutifolius A., Gray var. latifolius Freeman and P. polyanthus Greenman (Debouck, 1993). Of these five species, the common bean (Phaseolus vulgaris L.) is the most important because its high protein content has made it the major staple food crop in Africa and Latin America (Yu and Bliss, 1978).
The cultivated common bean has two major gene pools and several races within these pools (Beebe et al., 2000). The carioca cream-striped grain type belongs to the Mesoamerican gene pool and shows marked genetic variability that accounts for many traits such as disease resistance. The common bean is essentially an autogamous species with breeding based on self-crossings and the identification of segregant populations from which superior lines are selected. For this reason, it is important to know the extent of parental genetic dissimilarity in order to direct future crosses and enhance the chances of recovering superior genotypes in segregating generations (Gepts and Debouk, 1991).
In 1967, the Agronomic Institute (IAC, Campinas, SP, Brazil) released a new carioca variety named the ‘original carioca’. This new cream-striped grain type cultivar quickly became popular and was widely cultivated in Brazil and abroad, especially in Africa, because of its excellent grain quality and high grain yield. Recombination events moved the genetic structure of the original carioca forward and, with time, introduced new variability into the new carioca cultivars that were named after the original carioca because of their similar cream-striped grain type.
Molecular techniques have altered the way plant breeding is being done. Molecular markers have great potential to help breeders develop new improved varieties since they may be used to estimate the genetic diversity and level of heterozygosity among plants and animals (Dani et al., 2008; Kumar et al., 2008). Molecular markers have been used for genetic mapping (Grisi et al., 2007), marker-assisted selection (Ender et al., 2008), and to measure spatial and temporal gene flow within and among populations (Papa and Gepts, 2003).
A range of molecular data can be used to assess crop genetic diversity and has been applied to study the population structure of Mesoamerican and Andean bean gene pools (Dìaz and Blair, 2006; Blair et al., 2007, 2009; Kwak and Gepts, 2009). Talukder et al. (2010) analyzed the genetic diversity and seed mineral content of a set of common beans in order to enhance seed Zn and Fe content. Santalla et al. (2010) used simple sequence repeats (SSRs) to elucidate how adaptation to environmental conditions has sculpted the common bean genomes in southern Europe. In addition, molecular markers have been used to evaluate genetic diversity in snap bean varieties from Europe (Métais et al., 2002; Masi et al., 2003), wild populations from Mexico (Payró de la Cruz et al., 2005) and dry bean genotypes from Italy (Marotti et al., 2007), Bulgaria (Svetleva et al., 2006), Nicaragua (Gomez et al., 2004), Slovenia (Maras et al., 2006) and East Africa (Asfaw et al., 2009).
Among molecular markers, microsatellites or SSRs deserve special attention as tools for analyzing diversity. These codominant, multiallelic markers are widely distributed throughout genomes and can be highly polymorphic (Chin et al., 1996). SSRs have been used to distinguish among Mesoamerican and Andean accessions (Blair et al., 2006; Benchimol et al., 2007; Campos et al., 2007) and have identified greater genetic variability among Andean than among Mesoamerican genotypes (Gepts et al., 2008). SSRs have been successfully used to evaluate genetics, pedigree, phylogeny and/or identify various traits and/or germplasm accessions (McCouch et al., 2001); they have been especially important in assessing the genetic diversity and genetic maps of common beans (Yu et al., 1999; Guo et al., 2000; Métais et al., 2002; Gaitán-Solís et al., 2002; Masi et al., 2003; Blair et al., 2003, 2006; Benchimol et al., 2007; Grisi et al., 2007; Hanai et al., 2007; Zhang et al., 2008).
Amplified fragment length polymorphism (AFLP) is a polymerase chain reaction (PCR)-based molecular marker assay (Vos et al., 1995) that can detect a higher number of polymorphic loci in a single assay than restriction fragment length polymorphism (RFLP) or random amplification of polymorphic DNA (RAPD) (Powell et al., 1996). AFLP is highly polymorphic and shows considerable reproducibility within a laboratory. The effectiveness and reliability of AFLP has led to its increasing use in diversity studies, phylogeny, genomic linkage mapping and identification of varieties (Tohme et al., 1996; Papa and Gepts, 2003; Rosales-Serna et al., 2005). AFLPs can detect a large number of polymorphic bands in a single lane rather than high levels of polymorphism at each locus such as occurs with SSRs. AFLP has been used to distinguish very closely related genotypes belonging to the same commercial class, such as the yellow bean class (Pallottini et al., 2004). AFLPs are also reliable for distinguishing closely related cocoa varieties (Saunders et al., 2001).
Single nucleotide polymorphisms (SNPs), including insertion/deletions (Indels), are informative genetic markers. Although at any given site SNPs could, in principle, involve four different nucleotide variants, in practice they are generally biallelic. When compared to multiallelic markers such as SSRs, biallelic SNPs are less polymorphic (the expected heterozygosity is lower), but this disadvantage is compensated for by the relative abundance of SNPs (Oraguzie et al., 2007). SNP markers are useful in a variety of applications, including the construction of high resolution genetic maps, mapping traits, genetic diagnostics, analysis of the genetic structure of populations and phylogenetic analysis (Rafalski, 2002). Efforts to develop SNP- and Indel-based markers for the common bean (Phaseolus vulgaris L.) have been reported (Galeano et al., 2009).
A comparison of the different marker systems used to estimate crop genetic diversity is important in order to assess their usefulness in germplasm conservation and as plant breeding tools. Garcia et al. (2004) used different marker systems (AFLP, RAPD, RFLP and SSR) to examine the diversity of inbred tropical maize lines and concluded that AFLP was the best molecular assay for fingerprinting and assessing genetic relationships because of its high accuracy. Geleta et al. (2005) reported that both AFLP and SSR markers were efficient tools in assessing the genetic variability among sorghum genotypes.
In this study, we sought to determine the most suitable molecular marker system (SSRs or AFLPs) for assessing the genetic diversity in commercial carioca common beans and examined the genetic variability among various genotypes.
Materials and Methods
Plant material and DNA extraction
Sixty carioca genotypes from the Agronomic Institute Germplasm Bank (IAC, Campinas, SP, Brazil) were used in this study (Table 1). Total genomic DNA was extracted from powdered lyophilized young leaves using the CTAB method (Hoisington et al., 1994).
Table 1.
Common bean (Phaseolus vulgaris L.) accessions evaluated by SSRs and AFLPs.
| Number of genotypes | Genotypes | Genealogy | Origin* |
|---|---|---|---|
| 01 | A-449 | G2910 / A19 | CIAT |
| 02 | Aporé | Carioca / México 168 /4/ Carioca /// Porrillo No. 1 / Gentry 21439 // 51052 / Cornell 49-242 | EMBRAPA |
| 03 | Branquinho | Unknown | Creole variety |
| 04 | BRS – Cometa | A 769 / 4 / EMP 250 /// A 429 / XAN 252 // C 8025 / G 4449 /// WAF 2 / A 55 // GN 31 / XAN 170 | EMBRAPA |
| 05 | BRS – Horizonte | EMP 250 / 4 / A 769 /// A 429 / XAN 252 // Pinto VI 114 | EMBRAPA |
| 06 | BRS – Pontal | BZ3836 // FEB 166 / AN910523 | EMBRAPA |
| 07 | BRS – Requinte | Carioca MG // POT 94 / AN910523 | EMBRAPA |
| 08 | BRSMG-Talismã | Selection involving the following parents: BAT 477, IAPAR 14, FT 84-29, Jalo EEP, A 252, A 77, Ojo de Liebre, ESAL 645, Pintado, Carioca, ESAL 645, P 85, P 103, H-4, AN910522, ESAL 624, Carioca MG | EMBRAPA |
| 09 | Campeão II | Aporé / Carioca comum | Creole variety |
| 10 | Caneludo | Unknown | Creole variety |
| 11 | Carioca | Mass selection in local material (Palmital, SP, Brazil) | IAC |
| 12 | Carioca Lustroso | Unknown | Creole variety |
| 13 | Carioca MG | Carioca / Cornell 49242 // Rio Tibagi | UFLA |
| 14 | Carioca Precoce | Not found | EMBRAPA |
| 15 | CV-48 | Recurrent selection involving the following parents: BAT 477, IAPAR 14, FT 84-29, Jalo EEP, A 252, A 77, Ojo de Liebre, ESAL 645, Pintado, Carioca, ESAL 645, P 85, P 103, H-4, AN910522, ESAL 624, Carioca MG | UFLA |
| 16 | FEB-186 | A525 // A767 // G2500C / A445 // G12727 / XAN11 | CIAT |
| 17 | FEB-200 | A767 // G4495 / PVA 1111 // G4449 / XAN112 | CIAT |
| 18 | FT-Bonito | IAPAR-14 / IAC-Carioca 80 | FT-Seeds |
| 19 | FT-Paulistinha | Carioca / México 168 // Carioca 1070 | FT-Seeds |
| 20 | FT-Porto Real | FT 85-75 | FT-Seeds |
| 21 | Goytacazes | A 106 / A 63 | Creole variety |
| 22 | Guará | Not found | EPAGRI |
| 23 | H96A28 - P4-1 - 1-1 - 1 | Vax! / Aruã // Akytã / IAPAR14 // A686 | IAC |
| 24 | H96A102-1-1-152 | Aruã/G5686 // Xan251 / Akytã // Pyatã / Mar1 // Pérola | IAC |
| 25 | H96A31-P2-1-1-1-1 | Vax1 / Aruã // Aruã / Mar1 // Maravilha / Cal143 | IAC |
| 26 | IAC – Alvorada | Pyatã / A686 // Maravilha / G2338 // Maravilha / And277 // L317-1 | IAC |
| 27 | IAC-Apuã | Emp81 / H853-50-2 | IAC |
| 28 | IAC-Aysó | Carioca / Cornell 49-242 | IAC |
| 29 | IAC-Carioca | Carioca / Cornell 49-242 | IAC |
| 30 | IAC-Carioca Akytã | DOR 41 // 10-3-1 / TU1B1-2 / 10-9-1 | IAC |
| 31 | IAC-Carioca Aruã | 10771.122 // H5380-41 / A156 // H5380-41 / AB136 | IAC |
| 32 | IAC-Carioca Pyatã | DOR 41 // 10-3-1 / TU1B1-2 / 10-9-1 | IAC |
| 33 | IAC-Carioca Tybatã | L933 / LM30630 | IAC |
| 34 | IAC-Votuporanga | Emp81 / H853-50-2 // H853-50-2 / Phaseolus aborigineus | IAC |
| 35 | IAC-Ybaté | G4000 / H858-50-2 | IAC |
| 36 | IAPAR - 14 | Carioca 99 / G / N / Nebraska 1 Sel / 27 // BAT 614 | IAPAR |
| 37 | IAPAR - 57 | Porrillo Sintético / Aeté 1-38 // CENA 83-1 / IAPAR BAC32 // CENA 83-2 / CENA 83-1 | IAPAR |
| 38 | IAPAR - 80 | A 2488 / EMP 117 /5/ Veranic 2 / Tlalnepantla 64 // Jamapa / Tara /// Carioca 99 / G.N.Nebraska1#27 /4/ Sel.Aroana | IAPAR |
| 39 | IAPAR - 81 | Veranic 2 / Tlalnepantla 64 // Jamapa / Tara /// [(Carioca 99 / G.N.Nebraska 1#Sel 27) // Sel.Aroana]} /5/ Aroana /// Veranic 2 / Tlalnepantla 64 // Jamapa / Tara /4/ A 259 | IAPAR |
| 40 | IAPAR -72 | Carioca / Phaseolus coccineus | IAPAR |
| 41 | IAPAR - 31 | IAPAR BAC 4 / RAI 46//IAPAR BAC2 / IGUAÇÚ /3/ BAT 93/ IAPAR BAC 4 | IAPAR |
| 42 | IPR- Aurora | RM8454-21-1/ IAPAR-14 | IAPAR |
| 43 | Juriti | BAT93 / 2 / Carioca Sel.99 / Great Northern Nebraska 1 sel#27 / 3 / sel. Aroana / 4 / A176 / A259 / 5 / II 133 / XAN87 | IAPAR |
| 44 | L 507-1 | Not found | IAC |
| 45 | L-476-2 | Not found | IAC |
| 46 | LH-II | Carioca MG / Carioca / EMGOPA 201 Ouro // Carioca / EMGOPA 201 Ouro | UFLA |
| 47 | LP 01-38 | Not found | IAPAR |
| 48 | LP 9979 | Not found | IAPAR |
| 49 | LP88-175 | Not found | IAPAR |
| 50 | Mar 2 | A252 / G5653 | CIAT |
| 51 | MD-806 | Not found | CIAT |
| 52 | Mex 279 | Not found | CIAT |
| 53 | OPNS-331 | Ouro Negro / Pérola | UFLA |
| 54 | OPS-16 | Ouro Negro / Pérola | UFLA |
| 55 | Pérola | Carioca / México 168 / 4 / Carioca /// Porrillo No. 1 / Gentry 21439 // 51052 / Cornell 49-242 | EMBRAPA |
| 56 | Rubi | Carioca / México 168 / 4 / Carioca /// Porrillo No. 1 / Gentry 21439 // 51052 / Cornell 49-242 | EMBRAPA |
| 57 | Rudá | Carioca / Rio Tibagi | CIAT |
| 58 | Taquarí | Unknown | CATI |
| 59 | TO | Not found | CIAT |
| 60 | Z-28 | IAPAR 81 / AN9022180 // PF 9029975 / A-805 | UFLA |
CATI – Coordination of Integral Technical Assistance; CIAT- International Center for Tropical Agriculture; EMBRAPA – Brazilian Company of Agricultural Research; EPAGRI – Brazilian Company of Agricultural Research and Rural Extension of Santa Catarina; IAC – Agronomic Institute of Campinas; IAPAR – Agronomic Institute of Paraná; UFLA – Federal University of Lavras.
SSR analysis
A total of 85 SSRs (Table 2) were developed from two microsatellite-enriched libraries, one for the ‘CAL-143’ line and another for the ‘IAC-UNA’ variety (Benchimol et al., 2007; Campos et al., 2007; Cardoso et al., 2008; Oblessuc et al., 2009). Sixty-five of the 85 SSRs were genotyped using 6% polyacrylamide silver stained gels (Creste et al., 2001) whereas the remaining 20 SSRs were genotyped using a fluorescent labeling method that allowed high-throughput genotyping (Schuelke, 2000).
Table 2.
Data from 85 microsatellites used to genotype the 60 carioca accessions (cream-striped grain type). Of the 85 SSRs screened, 20 were genotyped using a fluorescence technique (*).
| No | SSRs | Motif | Ta** | Allele range (bp) | Number of alleles | PIC** | DP** |
|---|---|---|---|---|---|---|---|
| 01 | SSR-IAC01* | (CT)8 | 56 | 240–262 | 2 | 0.43 | 0.38 |
| 02 | SSR-IAC05 | (TG)6(GA)5 (AG)10 (ACA)5 | 50 | 164–166 | 2 | 0.10 | 0.10 |
| 03 | SSR-IAC09 | (CA)9C (CA)2(TA)6 | 56 | 160–168 | 2 | monomorphic | - |
| 04 | SSR-IAC10 | (GA)12(AG)6 (AG)6 | 56 | 176–188 | 4 | 0.68 | 0.47 |
| 05 | SSR-IAC11 | (GA)24 | 56 | 186–204 | 4 | 0.60 | 0.58 |
| 06 | SSR-IAC13 | (GA)10A (GA)4GG (GA)9 | 56 | 180 | 1 | monomorphic | - |
| 07 | SSR-IAC14* | (GT)7 | 56 | 226–256 | 5 | 0.30 | 0.32 |
| 08 | SSR-IAC16 | (GA)8 | 56 | 220–224 | 3 | 0.29 | 0.32 |
| 09 | SSR-IAC18* | (GT)8 | 56 | 270–300 | 3 | 0.59 | 0.61 |
| 10 | SSR-IAC20 | (GA)7AA (GA)2 | 56 | 182 | 1 | monomorphic | - |
| 11 | SSR-IAC21 | (AC)6 | 56 | 138–140 | 2 | 0.40 | 0.20 |
| 12 | SSR-IAC22 | (TA)8(GA)9 | 56 | 146–148 | 2 | 0.09 | 0.11 |
| 13 | SSR-IAC24 | (AC)7(AT)6 | 56 | 166–168 | 2 | 0.06 | 0.06 |
| 14 | SSR-IAC25 | (CA)6CAA (CA)2 CAA(CA) 3CG (CA)5 | 56 | 260–300 | 3 | 0.49 | 0.12 |
| 15 | SSR-IAC27 | (GT)5 | 56 | 260–278 | 2 | 0.11 | 0.16 |
| 16 | SSR-IAC28 | (GT)5(TC)10(TA)14 | 56 | 280 | 1 | monomorphic | - |
| 17 | SSR-IAC29 | (GA)23 | 56 | 58–158 | 2 | 0.10 | 0.23 |
| 18 | SSR-IAC32* | (TG)7 (TA)6 | 56 | 62–80 | 3 | 0.48 | 0.35 |
| 19 | SSR-IAC34 | (GA)12 | 56 | 180–182 | 2 | 0.49 | 0.52 |
| 20 | SSR-IAC35 | (CT)5 | 56 | 240–242 | 2 | 0.50 | 0.56 |
| 21 | SSR-IAC45 | (TG)5 | 56 | 202 | 1 | monomorphic | - |
| 22 | SSR-IAC46 | (CA)7 | 56 | 220–260 | 4 | 0.63 | 0.31 |
| 23 | SSR-IAC47* | (GA)20 | 56 | 300–330 | 4 | 0.56 | 0.52 |
| 24 | SSR-IAC49 | (AG)9 | 56 | 228–230 | 2 | 0.13 | 0.21 |
| 25 | SSR-IAC51 | (GA)5 CA (GA)9 CA (GA)2 | 56 | 150–160 | 2 | 0.25 | 0.38 |
| 26 | SSR-IAC52 | (GA)11 | 56 | 221–225 | 3 | 0.56 | 0.56 |
| 27 | SSR-IAC53 | (GA)9 | 56 | 164–168 | 3 | 0.52 | 0.12 |
| 28 | SSR-IAC54 | (AC)6 CAAA (TA)3 C (AT)5 | 56 | 110–112 | 2 | 0.09 | 0.09 |
| 29 | SSR-IAC55 | (GA)13 | 56 | 194–202 | 3 | 0.52 | 0.53 |
| 30 | SSR-IAC56* | (AC)8 | 56 | 270–300 | 3 | 0.37 | 0.36 |
| 31 | SSR-IAC57 | (GT)5 | 56 | 280 | 1 | monomorphic | - |
| 32 | SSR-IAC58 | (TG)10 | 56 | 184 | 1 | monomorphic | - |
| 33 | SSR-IAC59* | (AC)7 | 61 | 35–170 | 3 | 0.55 | - |
| 34 | SSR-IAC62 | (AG)14 | 45.3 | 198–210 | 4 | 0.67 | 0.67 |
| 35 | SSR-IAC63 | (AC)6 | 59.8 | 210 | 1 | monomorphic | - |
| 36 | SSR-IAC64* | (AC)6 | 56 | 270–290 | 4 | 0.53 | 0.57 |
| 37 | SSR-IAC65 | (TG)5 | 60 | 270–272 | 2 | 0.10 | 0.10 |
| 38 | SSR-IAC66 | (GA)10 | 56 | 136–144 | 3 | 0.49 | 0.73 |
| 39 | SSR-IAC67 | (GT)7 | 56 | 110 | 1 | monomorphic | - |
| 40 | SSR-IAC68 | (CT)8 | 56 | 260–272 | 4 | 0.53 | 0.82 |
| 41 | SSR-IAC70 | (AC)8 | 60 | 186–188 | 2 | 0.48 | 0.48 |
| 42 | SSR-IAC73 | (AT)6(GT)6 | 60 | 198–230 | 3 | 0.53 | 0.34 |
| 43 | SSR-IAC77 | (CA)6(CT)4 | 60 | 188–190 | 2 | 0.44 | 0.45 |
| 44 | SSR-IAC83 | (TC)11 | 45 | 250–260 | 3 | 0.61 | 0.63 |
| 45 | SSR-IAC87 | (AC)9 | 63.5 | 220–240 | 3 | 0.41 | 0.29 |
| 46 | SSR-IAC88 | (CA)7(AT)7 | 60 | 210–220 | 3 | 0.52 | 0.53 |
| 47 | SSR-IAC91 | (AC)3(TC)2 | 60 | 200–210 | 2 | 0.06 | 0.06 |
| 48 | SSR-IAC96 | (CA)5(TA)2 | 60 | 254–258 | 2 | 0.47 | 0.48 |
| 49 | SSR-IAC97 | (AC)3(TC)2 | 60 | 240 | 1 | monomorphic | - |
| 50 | SSR-IAC98 | (CT)8(TA)3(TG)8 | 60 | 230–290 | 3 | 0.60 | 0.65 |
| 51 | SSR-IAC100 | (AT)4(GT)8 | 60 | 206–210 | 2 | 0.09 | 0.17 |
| 52 | SSR-IAC101 | (AC)7 | 60 | 186–190 | 2 | 0.29 | - |
| 53 | SSR-IAC102 | (CT)7 GTCA (CT)8 | 60 | 176–178 | 2 | 0.39 | 0.42 |
| 54 | SSR-IAC127 | (TA)3 T (TGA)3 G (TA)3 | 63.3 | 168–170 | 2 | 0.50 | 0.50 |
| 55 | SSR-IAC128 | (AC)7 GGA (TC)2 | 56.7 | 168–190 | 2 | 0.31 | 0.35 |
| 56 | SSR-IAC129 | (TG)2 G (CT)2 TCT (GA)2 | 56.7 | 250–258 | 2 | 0.47 | 0.53 |
| 57 | SSR-IAC134 | (AC)6 | 56.7 | 218–250 | 2 | 0.41 | 0.39 |
| 58 | SSR-IAC136 | (CA)7 (AT)5 | 56.7 | 240–270 | 2 | 0.43 | 0.17 |
| 59 | SSR-IAC141 | (TCT)3 A (CT)13 | 59.4 | 214–218 | 2 | 0.40 | 0.46 |
| 60 | SSR-IAC143* | (TC)2 T (TC)2 T (TC)2 | 63.3 | 170–200 | 4 | 0.51 | 0.49 |
| 61 | SSR-IAC144* | (CT)10 | 56.7 | 170–220 | 4 | 0.70 | 0.49 |
| 62 | SSR-IAC147 | (CA)5 | 56.7 | 230–240 | 2 | 0.46 | 0.42 |
| 63 | SSR-IAC155 | (AG)9 | 56.7 | 196–200 | 2 | 0.04 | 0.01 |
| 64 | SSR-IAC156 | (TC)3 TG (GC)2 | 56.7 | 230 | 1 | monomorphic | - |
| 65 | SSR-IAC159 | (AC)6/(AC)4 C (CT)2 | 56.7 | 284–296 | 2 | 0.29 | 0.42 |
| 66 | SSR-IAC160 | (TG)2 (TA)2 (TG)5 | 56.7 | 170–174 | 2 | 0.44 | 0.49 |
| 67 | SSR-IAC166 | (CA)2 AA (AC)3/(TA)2 GAC (TG)3 | 56.7 | 186–190 | 2 | 0.05 | 0.36 |
| 68 | SSR-IAC167 | (TG)7 (CG)3 | 56.7 | 138–168 | 2 | 0.34 | 0.31 |
| 69 | SSR-IAC174 | (AT)3 A (AT)2 (AC)7 TTT (CA)3 | 53.2 | 140 | 1 | monomorphic | - |
| 70 | SSR-IAC179 | (AC)2 CTTT (AC)2 CTA (TC)5 | 63.3 | 180–186 | 2 | 0.48 | 0.53 |
| 71 | SSR-IAC180 | (AC)3 T (CA)3 TAA/ (AC)3(AC)3 G (CA)2 | 63.3 | 206 | 1 | monomorphic | - |
| 72 | SSR-IAC181 | (AT)2 AC (AT)3/(AG)5 TAA (AG)2 C (AG)2 | 58.4 | 120 | 1 | monomorphic | - |
| 73 | SSR-IAC183 | (AG)18 A (AC)4 | 56 | 190–196 | 2 | 0.27 | 0.34 |
| 74 | SSR-IAC209 | (AC)2 (TG)3 | 56.7 | 198–200 | 2 | 0.48 | |
| 75 | SSR-IAC211 | (CA)10 (TA)8 | 43.8 | 176 | 1 | monomorphic | - |
| 76 | SSR-IAC226* | (TG)8 | 60 | 240–260 | 4 | 0.56 | 0.65 |
| 77 | SSR-IAC239* | (AG)15 | 60 | 260–300 | 6 | 0.61 | 0.62 |
| 78 | SSR-IAC240* | (CT)10 | 60 | 196–210 | 4 | 0.64 | 0.62 |
| 79 | SSR-IAC242* | (AT)2 (GT)3 | 60 | 256–300 | 2 | 0.36 | 0.38 |
| 80 | SSR-IAC244* | (TC)9 | 60 | 200–226 | 5 | 0.27 | 0.27 |
| 81 | SSR-IAC251* | (AC)11 (AT)12 | 45 | 144–296 | 5 | 0.69 | 0.53 |
| 82 | SSR-IAC272* | (CA)6 | 60 | 200–236 | 4 | 0.42 | 0.45 |
| 83 | SSR-IAC390* | (GT)4 AT (GT)3 | 60 | 190–250 | 5 | 0.64 | 0.62 |
| 84 | FJUNA 167* | (AT)4 AG (GT)6/(AT)4 (GT)6 | 60 | 290–310 | 4 | 0.41 | 0.41 |
| 85 | FJUNA 384* | (CA)5 | 60 | 160–206 | 3 | 0.67 | 0.38 |
Ta- annealing temperature; PIC – polymorphism information content; DP – Discrimination power.
To explore the potential nature of the SSR loci assessed in this study, the Gene Ontology functional annotation tool Blast2GO (Conesa et al., 2005) was used to assign GO IDs, enzyme commission (EC) numbers and INTER-PRO codes. Sequence similarities were researched using BLASTX (Altschul et al., 1990) against a databank of non-redundant protein sequences (NR, E-value cutoff = 1e−05) and BLASTN against a databank of expressed sequenced tags (dbEST; E-value cutoff = 1e−05). Further functional manual annotation was done using AmiGO and PFAM.
For polyacrylamide assays, amplifications were done in a final volume of 25 μL containing 50 ng of DNA, 1X buffer, 0.2 μM of each forward and reverse primer, 100 μM of each dNTP, 2.0 mM MgCl2, 10 mM Tris-HCl (pH 8,0), 50 mM KCl, and 0.5 U of Taq DNA polymerase. The reactions were run using the following conditions: 1 min at 94 °C, then 30 cycles of 1 min at 94 °C, 1 min at the specific annealing temperature for each SSR and 1 min at 72 °C, with a final cycle of 5 min at 72 °C.
Amplifications using fluorescent SSRs were done with the M13 universal primer. The reactions were amplified in a final volume of 15 μL containing 30 ng of DNA, 1 U of Taq DNA polymerase, 1.5 mM MgCl2, 0.15 mM of each dNTP, 1X buffer, 0.8 pmol/μL of reverse primer and labeled M13 and 0.2 pmol of forward primer/μL. The reactions were run using the following conditions: 1 min at 94 °C, then 30 cycles of 1 min at 94 °C, 1 min at the specific annealing temperature (56 °C or 60 °C) for each SSR and 1 min at 72 °C, followed by 8 cycles of 1 min at 94 °C, 1 min at 53 °C and 1 min at 72 °C, with a final cycle of 10 min at 72 °C. The amplicons sequenced with a 3730 DNA Analyzer (Applied Biosystems) and analyzed with GeneMapper® v 3.7 software.
AFLP analysis
AFLP analysis was done as described by Vos et al. (1995), with some modifications. DNA (100 ng) was digested with EcoRI and MseI restriction enzymes, linked to specific adapters, and fragments were amplified. The pre-amplification reactions were done with primers containing one selective nucleotide. The pre-amplification PCR consisted of 3 μL of digested DNA and with the adapters already linked, 0.2 μM of the primer combinations, 100 μM of each dNTP, 2.0 mM MgCl2, 10 mM Tris-HCl (pH 8,0), 50 mM KCl, and 0.5 U of Taq DNA polymerase in a final volume of 25 μL. The reactions were run using the following conditions: 1 min at 94 °C, then 26 cycles of 1 min at 94 °C, 1 min at 56 °C, 1 min at 72 °C, with a final cycle of 5 min at 72 °C. The pre-amplification products were diluted 1:9 in water.
Selective amplification was done with primers that had three selective nucleotides (for EcoRI and MseI primers). Twenty primer combinations were used in this step (Table 3). PCR for selective amplification was done as described for the pre-amplification reaction, using 3 μL of the pre-amplification dilution. The reactions were done using the following conditions: 2 min at 94 °C, then 12 cycles of 0.30 s at 94 °C, 0.30 s at 65 °C and 1 min at 72 °C, followed by 23 cycles of 0.30 s at 94 °C, 0.30 s at 56 °C and 1 min at 72 °C, with a final cycle of 5 min at 72 °C. The PCR amplification products were separated on 7% denaturing polyacrylamide silver stained gels. The AFLP bands were scored manually.
Table 3.
AFLP primer combinations and their characteristics.
| Primer combination | Number of bands | Polymorphic bands | Polymorphism rate (%)* | DP values |
|---|---|---|---|---|
| E-TAA/M-GAA | 71 | 65 | 91.5% | 0.89 |
| E-TCA/M-GAA | 23 | 21 | 91.3% | 0.82 |
| E-TCA/M-GAC | 24 | 22 | 91.6% | 0.83 |
| E-TCA/M-GAC | 33 | 29 | 87.9% | 0.70 |
| E-TAT/M-GTA | 33 | 29 | 87.9% | 0.79 |
| E-TAT/M-GTG | 59 | 52 | 88.1% | 0.75 |
| E-TTA/M-GAT | 34 | 30 | 88.2% | 0.78 |
| E-TTG/M-GAA | 24 | 20 | 83.4% | 0.72 |
| E-TTG/M-GAT | 32 | 29 | 90.6% | 0.78 |
| E-TCT/M-GAA | 27 | 24 | 88.9% | 0.80 |
| E-TCT/M-GAT | 37 | 34 | 91.9% | 0.83 |
| E-TCT/M-GTA | 41 | 33 | 80.5% | 0.86 |
| E-TCT/M-GTT | 42 | 37 | 88.0% | 0.93 |
| E-TTT/M-GTA | 54 | 47 | 87.0% | 0.92 |
| E-TTT/M-GTC | 26 | 20 | 83.4% | 0.91 |
| E-AAG/M-CGG | 47 | 45 | 95.7% | 0.88 |
| E-AAG/M-CCT | 33 | 29 | 87.9% | 0.91 |
| E-AAG/M-CTC | 39 | 35 | 89.7% | 0.90 |
| E-ACC/M-CGG | 20 | 16 | 80.0% | 0.85 |
| E-ACC/M-CCC | 26 | 18 | 69.2% | 0.94 |
| Totals | 725 | 635 | 87.6% | - |
Percentage of polymorphic bands.
Data analysis
The AFLP data were scored for presence (1) or absence (0) of bands, whereas for SSRs the results were transformed into genotypic data in order to identify locus and allele frequencies. Pair-wise comparisons were used to estimate Jaccard’s similarity coefficient (Jaccard, 1908) for AFLP data using NTSYS software, version 2.02E (Rohlf, 1993). Genetic distances (GDs) were calculated from the SSR data for all possible inbred pairs using Rogers modified genetic distance (RMD; Goodman and Stuber, 1983) version 1.3 (Miller, 1997). Cluster analyses for SSRs and AFLPs were done using UPGMA (Unweighted Pair-Group Method with Arithmetic Averages).
Polymorphism information content (PIC) values were calculated using the formula:
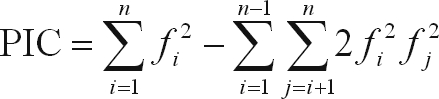 |
where fi is the frequency of the ith allele (marker) for the ith SSR locus (Lynch and Walsh, 1998). Discrimination power (DP) analysis values for the kth primer were calculated using the formula:
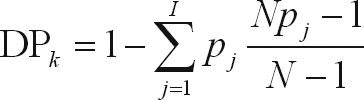 |
where N is the number of individuals and pj is the frequency of the jth pattern (Tessier et al., 1999). PIC was used to measure the information of a given marker locus for the pool of genotypes, while DP was used to measure the efficiency of SSRs and AFLPs in order to identify varieties by taking into account the probability of two randomly chosen individuals having different patterns.
The bootstrap procedure (Efron and Tibshirani, 1993) was used to verify whether the number of polymorphic SSRs and AFLPs used to estimate genetic similarity was large enough to supply a precise estimation of molecular markers among the genotypes (Tivang et al., 1994). The polymorphic markers were submitted to sampling with the replacement of markers to create new samples from the original data. Genetic similarities for each of these subsets were calculated by obtaining 1000 bootstraps estimates of SSRs and AFLPs for each of these combinations. The coefficients of variation (CV) were used to construct box plots for each sample size. These analyses were done using the R software, which is a language and environmental asset for statistical computing. For each marker system (SSRs and AFLPs), the exponential function was adjusted to estimate the number of loci needed to obtain a CV of 10%. The median and maximum CV values were used to evaluate the accuracy of the genetic distance estimates because although the mean CV is often used in the literature, caution is needed when dealing with molecular marker data for which there is no assurance that the CV values have a symmetrical distribution.
Principal coordinate analysis (PCO; Gower, 1966) was done with the SSR MRD distance matrix and the first three principal coordinates were used to describe the dispersion of the 60 accessions according to their allele data.
Wrights F statistics for SSRs were estimated using the GDA program (Lewis and Zaykin, 2000). This set of statistics was used to test the structure of genetic diversity of the carioca genotypes evaluated. AMOVA (Analysis of Molecular Variance) was used to test the structure of the genetic diversity of the genotypes based on the AFLP data, and the analyses were done using Arlequin 2.0 software (Schneider and Excoffier, 1999). The significance of the fixation indices was tested by a permutation procedure with 10,000 permutations. Arlequin 2.0 software was also used to estimate the diversity fraction (FST) generated by AFLP analysis. The genetic differentiation coefficient, FST, measures the relative degree of gene differentiation among subpopulations such that each genotype can be considered a subpopulation. Wright’s FST is considered to be identical to GST (Nei, 1978) for fully homozygous diploids in AFLP analysis and was calculated as: FST = GST = DST/hT, where HT = HS + DST, and DST = (HT – HS).
Results and Discussion
Survey of molecular marker polymorphism
Seventy (82.4%) of the SSRs (Table 2) were polymorphic and produced 196 polymorphic alleles. The allele number ranged from 2 to 6 with a mean of 2.8 alleles per SSR. The highest numbers of alleles observed were found for SSR-IAC10, SSR-IAC62, SSR-IAC144 and SSR-IAC251. AFLP markers produced 725 bands of which 635 (87.6%) were polymorphic. The number of fragments amplified per primer pair varied from 20 (E-ACC/M-CGG) to 71 (E-TAA/M-GAA) (Table 3).
The highest polymorphic information content (PIC) found for SSRs was 0.70 (SSR-IAC144) and the lowest was 0.03 (SSR-IAC155), with a mean value of 0.47. The highest PIC value for AFLP was 0.37 (E-AAG/M-CGG) and the lowest was 0.03 (E-TAT/M-GTG), with a mean value of 0.29. Benchimol et al. (2007) analyzed genotypes from the Andean and Mesoamerican gene pools (P. vulgaris L.) with 123 polymorphic microsatellites and found PIC values from 0.04 to 0.83. These genotypes were expected to be more diverse than those of the carioca commercial type (Mesoamerican). Fifty-three SSRs used by Benchimol et al. (2007) were also used here with the carioca genotypes, and six of these SSRs showed similar PIC values (SSR-IAC-01, SSR-IAC32, SSR-IAC55, SSR-IAC64, SSR-IAC70 and SSR-IAC-83). Thus, most of the SSRs differed in their PIC, a situation that probably reflected the type and number of genotypes that were evaluated. Moreover, the higher PIC values found for the SSR markers were related to the size of the SSR motifs; perfect SSRs with a higher number of repetitions and compound SSRs showed higher PIC (Table 2). The PIC values were compatible with those obtained for SSRs used in genotyping carioca cultivars.
Discrimination power (DP) analyses for SSRs (Table 2) yielded values from 0.01 (SSR-IAC155) to 0.82 (SSR-IAC68) with most being around 0.40. Based on parameters such as the number of alleles, DP and PIC, the polymorphism estimated for the carioca genotypes with a subset of 85 SSRs showed that these loci could generate sufficient polymorphism to allow their use as molecular markers to establish genetic relationships among very closely related genotypes. These SSRs could be also useful for a wide range of genetic investigations such as linkage map construction and association mapping studies. The DP values for AFLPs were higher than for SSRs, ranging from 0.70 (E-TCA/M-GAC) to 0.94 (E-ACC/M-CCC), with most of the values being around 0.92 (Table 3).
To understand the genomic nature (functional or non-functional regions) of the SSR markers used, the 85 contigs were compared with non-redundant GenBank databases using BLASTX and BLASTN (dbEST). Of the sequences analyzed, 22% were found in the BLASTX – NR DB and 49% in the BLASTN dbEST database. GO analyses yielded a hierarchy of terms that varied at many levels and were divided into functional groups identified as “molecular function”, “biological process” and “cellular component”. Nineteen functional SSRs were identified (Table S1), and the SSRs that shared similarity with ESTs deposited in dbEST are shown in Table S2.
Genetic diversity of the carioca genotypes
Various studies have shown that the accuracy of genetic distance measurements is enhanced by using a mean CV of 10% (dos Santos et al., 1994; Halldén et al., 1994; Thormann et al., 1994; Tivang et al., 1994). However, according to Garcia et al. (2004), the use of an average value is not a good indicator of central tendency for skewed data. Hence, in this work, the minimum number of SSR and AFLP loci necessary for an accurate representation of genetic distances was calculated in order to construct an exponential function based on the average, median and maximum CV values of genetic distances obtained by bootstrap sampling data for each SSR and AFLP. The CV values used to calculate the median were used as follows: the sample size (number of loci) required for 50% of the genetic distances to have CV values < 10% (nmedian), the sample size required for no genetic distance to have a CV > 10% (nmaximum), and the sample size required for all genetic distances to have an average CV of 10% (nmean) (Figure 1). The results obtained based on these criteria are shown in Table 4.
Figure 1.

Box plots of the coefficients of variation for the genetic similarity among all genotypes estimated by bootstrap analysis for subsamples with different number of SSRs and AFLPs.
Table 4.
Sample size (number of loci sampled) required for genetic distances to have the specified coefficient of variation (CV%) in carioca common beans.
| Coefficient of variation (CV%) | Sample size (number of loci sampled)
|
|
|---|---|---|
| SSRs | AFLPs | |
| Average of 10% (nmean) | 45.66 | 109.6 |
| 50% less than 10% (nmedian) | 44.39 | 100.56 |
| 100%less than 10% (nmax) | 100.34 | 1738.13 |
The choice of the appropriate number of polymorphic loci required for a reliable estimate of genetic distance is influenced by the criteria used. According to Garcia et al. (2004), the median CV value is the best choice for evaluating the precision of genetic distance estimates based on different molecular systems. The extremely high (almost 100%) coefficients of determination for the adjusted equations for SSRs and AFLPs indicated that extrapolation to outlying points could be done. The results of the 10% CV analysis (nmedian) showed that 44 SSRs were necessary to assess the genetic variability among genotypes, whereas 100 AFLPs were required for the same analysis (Table 4). Thus, AFLPs were more suitable for analyzing genetic diversity in the set of common bean genotypes evaluated here since they provided information more rapidly and more accurately. Similar results were reported by Pallottini et al. (2004) for AFLPs used to assess the yellow bean class.
Maluf et al. (2005) characterized the genetic diversity of Coffea arabica genotypes using various molecular markers (AFLP, RAPD and SSR). RAPD and SSR were more efficient in kinship analysis; however, despite the high discriminatory power of SSRs, these markers were not efficient in separating the genotypes into well-defined groups. The authors concluded that AFLP markers were more appropriate for assessing the genetic diversity of kin groups. More recently, Kumar et al. (2008) concluded that AFLP markers were very useful for assessing the genetic diversity among narrow-based common bean accessions.
Of the 70 SSRs used here, 37 were mapped in the ‘IAC-UNA’ x ‘CAL-143’ genetic map (UC map; Campos et al., 2010). These SSRs were anchored in eight out of the 11 linkage groups (GLs) generated in the UC map (B1 – SSR-IAC01, SSR-IAC21 and SSR-IAC226; B6 – SSR-IAC47, SSR-IAC128 and SSR-IAC183; B9 – SSR-IAC55, SSR-IAC62 and SSR-IAC242). The linkage group B2 had 10 SSRs (SSR-IAC18a, SSR-IAC24, SSR-IAC46, SSR-IAC51, SSR-IAC57, SSR-IAC70, SSR-IAC134, SSR-IAC141, SSR-IAC166 and SSR-IAC251), the B3 linkage group had one SSR (SSR-IAC77), with one SSR in the B8 linkage group (SSR-IAC22). The B4 linkage group had four SSRs (SSR-IAC25, SSR-IAC66, SSR-IAC67 and SSR-IAC179), with the same number of SSRs being observed in the B5 linkage group (SSR-IAC10, SSR-IAC88, SSR-IAC96 and SSR-IAC159). The B7 linkage group had six SSRs (SSR-IAC18b, SSR-IAC64, SSR-IAC101, SSR-IAC143, SSR-IAC272 and SSR-IAC239) and the B10 linkage group had two SSRs (SSR-IAC155 and SSR-IAC244). These results show that the number of SSRs used was not sufficient to scan the entire bean genome since not all of the 11 chromosomal pairs were assessed and some linkage groups were irregularly scanned. Indeed, the SSR map positions in the UC map were not known at the time these SSRs were chosen for this study.
The SSR dendrogram (Figure 2) showed high genetic variability, with genetic distances varying from 0.37 to 0.63. However, a low genetic structure was observed as some groups were not well-defined. This could be explained by the fact that the SSRs used to assess the genetic variability of common genotypes in ‘carioca’ beans did not cover the entire genome of the common bean since the SSRs used in the analysis were not distributed in all linkage groups of the common bean.
Figure 2.

UPGMA dendrogram for the 60 carioca common beans based on SSR markers. Genetic distances were calculated using Rogers modified genetic distance.
The AFLP dendrogram provided a better clustering pattern for the carioca genotypes, which formed two major groups (Figure 3); five accesses (‘Campeão II’, ‘LP9979’, ‘IAC-Aruã’, ‘Aporé’ and ‘CariocaMG’) could not be classified with either of the two major groups. Genetic distances varied from 0.09 to 0.63 and indicated marked genetic variability. The AFLP average genetic distance (GDAFLP = 0.88) was higher than the average genetic distance for SSRs (GDSSR = 0.58). Some of the genotypes clustered according to the institutional breeding program from which they were derived. This was observed for the IAPAR (The Agronomic Institute of the State of Paraná, in southern Brazil) genotypes (‘IAPAR 81’, ‘IAPAR57’, ‘IAPAR 14’, ‘IAPAR 80’, ‘Juriti’ and ‘LP88-175’), for the IAC (The Agronomic Institute, Campinas, SP, Brazil) genotypes (‘IAC-Carioca’, ‘IAC-Akytã’ and ‘IAC-Pyatã’; ‘IAC-Tybatã’, ‘IAC-Votuporanga’ and ‘IAC-Ybaté’) and for those from EMBRAPA (‘A-449’, ‘Branquinho’, ‘BRS-Horizonte’, ‘BRS-Cometa’, ‘BRS-Pontal’, ‘BRS-Requinte’ and ‘BRSMG-Talismã’). This clustering pattern could be explained by the fact that each breeding Institution usually displays and uses a different genetic core collection and each breeding program has its own goals.
Figure 3.

UPGMA dendrogram for the 60 carioca common beans based on AFLP data. Genetic similarity values were calculated using Jaccards coefficient.
The Pearson correlation coefficient for SSR and AFLP genetic distances was negative (r = −0.08) indicating lack of correlation between these marker systems. The differences between SSRs and AFLPs reflect the extent of genome coverage and different evolutionary properties (Tautz and Schlötterer, 1994). The genomic distribution of SSRs is non-random (Li et al., 2004), whereas it is reasonable to expect that AFLPs should have complete genome coverage (Nowosielski et al., 2002). Saini et al. (2004) reported a low correlation (0.50) between these two classes of markers in rice and assumed that this reflected different genomic fractions that involved repeat and/or unique sequences; these sequences may have had different patterns of involvement or preservation during natural or human selection.
Menezes et al. (2004) and Palomino et al. (2005) studied the genetic diversity within carioca cultivars using RAPD markers and verified high genetic variability within carioca cultivars that differed from the ‘original carioca’. Although RAPD markers have been extensively used for common bean fingerprinting and genetic analysis, AFLP analysis provides a higher level of polymorphism than RAPD (Pejic et al., 1998). AFLP markers are advantageous because they reveal a larger number of reproducible markers, thereby increasing the probability of identifying polymorphic markers, even among closely related genotypes such as in common beans (Tohme et al., 1996; Beebe et al., 2001).
Principal coordinate analysis (PCO) failed to provide a clear division of the genotypes in the first three axes for both markers. For SSRs, 20.95% of the total variance was explained in three axes (Figure 4). According to SSR PCO, the ‘original carioca’, which is the ancestor of most of the carioca genotypes that are currently being used, was detached from the other cariocas. This finding supports the hypothesis that carioca genotypes have diverged from the ‘original carioca’ ancestor and shows that there is still considerable genetic variability to be exploited among carioca common bean accessions. Indeed, carioca common bean accessions have derived from many recombination events and from crosses with different genotypes, with much of this variability being preserved. Other factors, such as retrotransposons, may also be involved in generating and maintaining carioca genetic diversity.
Figure 4.

Principal coordinate analysis (PCO) for the SSR data of the 60 carioca common bean accessions. The position of original ‘carioca’ is indicated.
GDA analysis of the SSR data attributed 83% of the total molecular variance to FST, indicating a high level of genetic differentiation in the carioca samples. Based on the AFLP data, AMOVA showed 98% GST. Meanwhile, the observed heterozygosity was very low for all genotypes (0.16) and reflected the inbreeding index characteristic of an autogamous species (Beebe et al., 2000). Both groups of markers revealed high genetic variability among the carioca genotypes.
Common bean breeding programs usually explore only a low proportion of the available genetic diversity. Since most breeding programs use only a limited number of cultivars, the genetic base of elite cultivars tends to be narrow (Cooper et al., 2001). However, our findings suggest that genetic diversity is still preserved in the carioca collection. The degree of variability detected here supports the idea that the carioca group has a broader genetic base than expected, with a large number of unique alleles and low gene flow among them.
The success of common bean breeding programs is intimately related to the appropriate choice of divergent parents. To make this choice researchers need to know the genetic diversity contained in the available germplasm since the best parental combination can be obtained by combining two parents with a high degree of divergence; this will allow the exploitation of heterosis to improve breeding programs. The ‘carioca’ genotypes of common beans are currently the most sold in Brazil, largely because of their agronomic and commercial characteristics. Most of the genotypes have a high yield and resistance to various bean diseases, such as rust (examples: ‘Aporé’, ‘Carioca MG’, ‘Rudá’), golden mosaic virus (examples: ‘IAPAR 72’, ‘MD-806’ and ‘IPR-Aurora’), to bacterial diseases (examples: ‘IAC-Tybatã’, ‘LP88-175’, ‘IAC-Carioca Pyatã’, ‘IAC-Carioca Akytã’, ‘IAC-Ybaté’, ‘BRS-Pontal’), anthracnose (examples: ‘IAC-Carioca Tybatã’, ‘IAC-Carioca Pyatã’, ‘IAC-Carioca Akytã’, ‘IAC-Ybaté’, ‘H96A28’, ‘H96A102’, ‘IAPAR-31’, ‘BRS-Requinte’, ‘BRS-Pontal’, ‘IAC-Alvorada’, ‘H96A31’, ‘LP 9979’) and angular leaf spot (examples: ‘BRS-Pontal’, ‘IAC-Carioca Tybatã’, ‘Pérola’, ‘IAPAR-31’, ‘IAC-Carioca Aruã’, ‘BRS-Requinte’). Knowledge of the appropriate agronomic information and genetic distances among a set of ‘carioca’ genotypes can be used by bean breeding programs to assist in selecting superior parents and allow the exploitation of heterosis.
Information on possible crosses based on genetic diversity can also be used to assist breeding programs. Thus, for example, based on the AFLP genetic distances and the agronomic traits associated with each genotype, the following crosses could be suggested: ‘IAC-Alvorada x H96A102’ (GDAFLP = 0.89), ‘IAC-Alvorada’ x ‘LP 0181’ (GDAFLP = 0.87), ‘IAC-Alvorada’ x ‘LP 9979’ (GDAFLP = 0.89), ‘IAC-Alvorada’ x ‘H96A28’ (GDAFLP = 0.87), ‘IAC-Alvorada’ x ‘IPR-Aurora’ (GDAFLP = 0.90), ‘BRS-Requinte’ x ‘H96A102’ (GDAFLP = 0.90), ‘BRS-Pontal’ x ‘H96A102’ (GDAFLP = 0.87), ‘Branquinho’ x ‘H96A102’ (GDAFLP = 0.85), ‘BRS-Talismã’ x ‘H96A102’ (GDAFLP = 0.83) and ‘H96A31’ x ‘H96A102’(GDAFLP = 0.80).
A large number of markers have been used to assess genetic diversity in plants. For wide-scale use in germ-plasm characterization and breeding, it is important that these marker technologies be exchanged between laboratories and be standardized to yield reproducible results that will allow the direct comparison of data among laboratories and studies, thereby reducing project expenses. Jones et al. (1997) described a network experiment involving several European laboratories in which the reproducibility of three popular molecular marker techniques (AFLP, RAPD and SSR) was examined. The authors concluded that the costs involved in developing SSR markers meant that AFLP was more useful for studying genetic diversity – the major limitation inherent with SSRs resides in the logistic difficulty of increasing the number of useful loci for assignment tests. Indeed, developing and applying large numbers of SSRs may be technically challenging, expensive and time-consuming (Goldstein and Pollock, 1997).
AFLP provides a practical alternative for studying genetic diversity since the technique generates a large number of loci, and the cost and time required are lower than for SSRs (Vos et al., 1995; Rieseberg, 1998; Mueller and Wolfenbarger, 1999). Furthermore, the high reproducibility of AFLP means that multiple bands can be generated in a single assay (Oliveira et al., 2004). AFLP has been successfully used to estimate genetic diversity in the common bean (Tohme et al., 1996; Caicedo et al., 1999; Maciel et al., 2003; Pallottini et al., 2004; Rosales-Serna et al., 2005).
Comparisons of the efficiency of SSRs and AFLPs in assessing the genetic diversity of plants have generally shown that AFLP is the preferred technique. Barbosa et al. (2003) investigated the genetic diversity of tropical maize using SSRs and AFLPs and concluded that the former was less efficient than the latter for assigning lines to heterotic groups in tropical maize, and for predicting single cross performance in this culture. Similarly, Garcia et al. (2004), in a comparison of AFLP, RAPD, RFLP and SSR markers to evaluate genetic diversity in tropical maize, found that AFLP was the best-suited molecular assay for accurate fingerprinting and assessment of genetic relationships among tropical maize inbred lines.
The advantages and disadvantages of different marker systems for analyzing diversity in breeding populations or germplasm bank accessions, such as the carioca commercial type, must be considered in genotyping data for crop improvement and for the ex-situ conservation of plant genetic resources. Other studies that have compared the efficiencies of AFLPs and SSRs have concluded that both marker systems are useful for assessing the genetic structure and diversity of common bean accessions (Maras et al., 2008; Masi et al., 2009).
In conclusion, this is the first study to use powerful molecular markers such as AFLP and SSRs to assess the genetic variability of carioca commercial beans. Other studies of cream-striped carioca genotypes have used RAPD markers, which are less powerful in revealing the extent of genetic diversity (Menezes et al., 2004; Palomino et al., 2005). AFLP and SSRs and the number of markers they generated were appropriate for assessing the genetic diversity among carioca genotypes. In practice, AFLP markers were easier to use when screening the whole genome for genetic diversity and were more suitable in distinguishing among very closely related genotypes belonging to the same commercial class, such as the carioca genotypes.
Acknowledgments
The authors thank Dr. Marcos Machado (IAC, Cordeirópolis, SP, Brazil) for making available the automatic sequencer. This research was supported by grants from Fundação de Amparo à Pesquisa do Estado de São Paulo (FAPESP, grants 2006/61848-3 and 2006/59354-2).
Footnotes
Associate Editor: Dario Grattapaglia
Supplementary Material
The following online material is available for this article:
Functional annotation off SSRs sharing similarity with proteins in GenBank.
SSRs with similarity to ESTs deposited in the dbEST databank.
This material is available as part of the online article from http://www.scielo.br/gmb
References
- Altschul SF, Gish W, Miller W, Myers EW, Lipman DJ. Basic local alignment search tool. J Mol Biol. 1990;215:403–410. doi: 10.1016/S0022-2836(05)80360-2. [DOI] [PubMed] [Google Scholar]
- Asfaw A, Blair MW, Almekinders C. Genetic diversity and population structure of common bean (Phaseolus vulgaris L.) landraces from the East African highlands. Theor Appl Genet. 2009;120:1–12. doi: 10.1007/s00122-009-1154-7. [DOI] [PubMed] [Google Scholar]
- Barbosa AMM, Geraldi IO, Benchimol LL, Garcia AAF, Souza CL, Jr, Souza AP. Relationship of intra and inter-population maize single crosses hybrid performance and genetic distances computed from AFLP and SSR markers. Euphytica. 2003;130:87–99. [Google Scholar]
- Beebe S, Skroch PW, Tohme J, Duque MC, Pedraza F, Nienhuis J. Structure of genetic diversity among common bean landraces of Middle American origin based on correspondence analysis of RAPD. Crop Sci. 2000;40:264–273. [Google Scholar]
- Beebe S, Rengifo J, Gaitán E, Duque MC, Tohme J. Diversity and origin of Andean landraces of common bean. Crop Sci. 2001;41:854–862. [Google Scholar]
- Benchimol LL, Campos T, Carbonell SAM, Colombo CA, Chioratto AF, Formighieri EF, Souza AP. Structure of genetic diversity among common bean (Phaseolus vulgaris L.) varieties of Mesoamerican and Andean origins using new developed microsatellite markers. Genet Resour Crop Evol. 2007;54:1747–1762. [Google Scholar]
- Blair MW, Pedraza F, Buedia HF, Gaitán-Solís E, Beebe SE, Gepts P, Tohme J. Development of a genome-wide anchored microsatellite map for common bean (Phaseolus vulgaris L.) Theor Appl Genet. 2003;107:1362–1374. doi: 10.1007/s00122-003-1398-6. [DOI] [PubMed] [Google Scholar]
- Blair MW, Giraldo MC, Buendía HF, Tovar E, Duque MC, Beebe SE. Microsatellite marker diversity in common bean (Phaseolus vulgaris L.) Theor Appl Genet. 2006;113:100–109. doi: 10.1007/s00122-006-0276-4. [DOI] [PubMed] [Google Scholar]
- Blair MW, Dìaz JM, Hidalgo R, Dìaz LM, Duque MC. Microsatellite characterization of Andean races of common bean (Phaseolus vulgaris L.) Theor Appl Genet. 2007;116:29–43. doi: 10.1007/s00122-007-0644-8. [DOI] [PubMed] [Google Scholar]
- Blair MW, Dìaz LM, Buendia HF, Duque MC. Genetic diversity, seed size associations and population structure of a core collection of common beans (Phaseolus vulgaris L.) Theor Appl Genet. 2009;119:955–972. doi: 10.1007/s00122-009-1064-8. [DOI] [PubMed] [Google Scholar]
- Caicedo AL, Gaitán E, Duque MC, Chica OT, Debouck DG, Tohme J. AFLP fingerprinting of Phaseolus lunatus L. and related wild species from South America. Crop Sci. 1999;39:1497–1507. [Google Scholar]
- Campos T, Benchimol LL, Carbonell SAM, Chioratto AF, Formighieri EF, Souza AP. Microsatellites for genetic studies and breeding programs in common bean. Pesq Agropec Bras. 2007;42:401–408. [Google Scholar]
- Campos T, Oblessuc PR, Sforça DA, Cardoso JMK, Baroni RM, Sousa ACB, Carbonell SAM, Chioratto AF, Garcia AAF, Rubiano LB, et al. Inheritance of growth habit detected by genetic linkage analysis using microsatellites in the common bean (Phaseolus vulgaris L.) Mol Breed. 2010. Epub.
- Cardoso JMK, Oblessuc PR, Campos T, Sforça DA, Carbonell SAM, Chioratto AF, Formighieri EF, Souza AP, Benchimol LL. New microsatellite markers developed from an enriched microsatellite common bean library. Pesq Agropec Bras. 2008;7:929–936. [Google Scholar]
- Chin ECL, Senior ML, Shu H. Maize simple repetitive DNA sequences: Abundance and allele variation. Genome. 1996;39:866–873. doi: 10.1139/g96-109. [DOI] [PubMed] [Google Scholar]
- Conesa A, Götz S, García-Gómez JM, Terol J, Talón M, Robles M. Blast2GO: A universal tool for annotation, visualization and analysis in functional genomics research. Bioinformatics. 2005;18:3674–3676. doi: 10.1093/bioinformatics/bti610. [DOI] [PubMed] [Google Scholar]
- Cooper HD, Spillan EC, Hodgkin T. Broadening the genetic base of crops: An overview. In: Cooper HD, Spillane C, Hodgkin T, editors. Broadening the Genetic Base of Crop Production. CAB International; Wallingford: 2001. pp. 1–23. [Google Scholar]
- Creste S, Tulmann A, Figueira A. Detection of single sequence repeat polymorphism in denaturing polyacrylamide sequencing gels by silver staining. Plant Mol Bio Rep. 2001;19:299–306. [Google Scholar]
- Dani MAC, Heinneman MB, Dani SU. Brazilian Nelori cattle: A melting pot unfolded by molecular genetics. Genet Mol Res. 2008;7:1127–1137. doi: 10.4238/vol7-4gmr499. [DOI] [PubMed] [Google Scholar]
- Debouck DG, Toro O, Paredes OM, Johnson WC, Gepts P. Genetic diversity and ecological distribution of Phaseolus vulgaris in northwestern South America. Econ Bot. 1993;47:408–423. [Google Scholar]
- Díaz LM, Blair MW. Race structure within the Mesoamerican gene pool of common bean (Phaseolus vulgaris L.) as determined by microsatellite markers. Theor Appl Genet. 2006;114:143–154. doi: 10.1007/s00122-006-0417-9. [DOI] [PubMed] [Google Scholar]
- dos Santos JB, Nienhuis J, Skroch P, Tivang J, Slocum MK. Comparison of RFLP genetic markers in determining genetic similarity among Brassica oleracea L. genotypes. Theor Appl Genet. 1994;87:909–915. doi: 10.1007/BF00225784. [DOI] [PubMed] [Google Scholar]
- Efron B, Tibshirani RJ. An Introduction to the Bootstrap v 57 of Monographs on Statistics and Applied Probability. Chapman and Hall; New York: 1993. [Google Scholar]
- Ender M, Terpstra K, Kelly JD. Marker assisted selection for white mold resistance in common bean. Mol Breed. 2008;2:149–157. [Google Scholar]
- Gaitan-Solís E, Duque MC, Edwards KJ, Tohme J. Microsatellite in common bean (Phaseolus vulgaris): Isolation, characterization, and cross-species amplification in Phaseolus sp. Crop Sci. 2002;42:2128–2136. [Google Scholar]
- Galeano CH, Fernández AC, Gómez M, Blair MW. Single strand conformation polymorphism based SNP and Indel markers for genetic mapping and synteny analysis of common bean, (Phaseolus vulgaris L.) BMC Genomics. 2009;10:629. doi: 10.1186/1471-2164-10-629. [DOI] [PMC free article] [PubMed] [Google Scholar]
- Garcia AAF, Benchimol LL, Barbosa AMM, Geraldi IO, Júnior CLS, Souza AP. Comparison of RAPD, RFLP, AFLP and SSR markers for diversity studies in tropical maize inbred lines. Genet Mol Biol. 2004;27:579–588. [Google Scholar]
- Geleta LF, Labuschagne MT, Viljoen CD. Genetic variability in pepper (Capsicum annuum L.) estimated by morphological data and amplified fragment length polymorphism markers. Biodivers Conserv. 2005;14:2361–2375. [Google Scholar]
- Gepts P, Debouk D. Origin, domestication, and evolution of the common bean (Phaseolus vulgaris L.) In: Van Schoonhoven A, Voyset O, editors. Common Beans: Research for Crop Improvement. CAB International; Wallingford: 1991. pp. 7–53. [Google Scholar]
- Gepts P, Aragão F, de Barros E, Blair MW, Brondani R, Broughton W, Galasso I, Hernández G, Kami J, Lariguet P, et al. Genomics of Phaseolus beans, a major source of dietary protein and micronutrients in the tropics. In: Moore P, Ming R, editors. Genomics of Tropical Crop Plants. Springer; Heidelberg: 2008. pp. 113–143. [Google Scholar]
- Goldstein DB, Pollock DD. Launching microsatellites: A review of mutation processes and methods of phylogenetic inference. J Hered. 1997;88:335–342. doi: 10.1093/oxfordjournals.jhered.a023114. [DOI] [PubMed] [Google Scholar]
- Goodman MM, Stuber CW. Races of maize VI. Isozyme variation among races of maize in Bolívia. Maydica. 1983;28:169–187. [Google Scholar]
- Gower JC. Some distant properties of latent root and vector methods used in multivariate analysis. Biometrika. 1966;53:325–338. [Google Scholar]
- Gómez OJ, Blair MW, Frankow-Lindberg BE, Gullberg U. Molecular and phenotypic diversity of common bean landraces from Nicaragua. Crop Sci. 2004;44:1412–1418. [Google Scholar]
- Grisi MCM, Blair MW, Gepts P, Brondani C, Pereira PAA, Brondadi RPV. Genetic mapping of a new set of microsatellite markers in a reference common bean (Phaseolus vulgaris) population BAT93 x Jalo EEP558. Genet Mol Res. 2007;3:691–706. [PubMed] [Google Scholar]
- Guo JC, Hu XW, Yanagihara S, Yoshinobu E. Isolation and characterization of microsatellites in snap bean. Acta Bot Sin. 2000;42:1179–1183. [Google Scholar]
- Halldén C, Nilsson NO, Rading IM, Säll T. Evaluation of RFLP and RAPD markers in comparison of Brassica napus breeding lines. Theor Appl Genet. 1994;88:123–128. doi: 10.1007/BF00222404. [DOI] [PubMed] [Google Scholar]
- Hanai LL, Campos T, Camargo LEA, Benchimol LL, de Souza AP, Melotto M, Carbonell SA, Chioratto AF, Consoli L, Formighieri EF, et al. Development, characterization and comparative analysis of polymorphism at common bean-SSR loci isolated from genic and genomic sources. Genome. 2007;50:266–277. doi: 10.1139/g07-007. [DOI] [PubMed] [Google Scholar]
- Hoisington D, Khairallah M, Gonzalez-de-Leon D. Laboratory Protocols: CIMMYT Applied Molecular Genetics Laboratory. 2nd edition. CIMMYT; Mexico DF: 1994. p. 51. [Google Scholar]
- Jaccard P. Nouvelles rechearches sur la distribuition florale. Bull Soc Vaudoice Sci Nat. 1908;44:223–270. [Google Scholar]
- Jones CJ, Edwards KJ, Castaglione S, Winfield MO, Sala F, Wiel C, Bredemeijer G, Vosman B, Matthes M, Daly A, et al. Reproducibility testing of RAPD, AFLP and SSR markers in plants by a network of European laboratories. Mol Breed. 1997;3:381–390. [Google Scholar]
- Kumar V, Sharma S, Kero S, Sharma S, Sharma K, Kumar M, Bhat KV. Assessment of genetic diversity in common bean (Phaseolus vulgaris L.) germplasm using amplified fragment length polymorphism (AFLP) Scientia Hort. 2008;116:138–143. [Google Scholar]
- Kwak M, Gepts P. Structure of genetic diversity in the two major gene pools of common bean (Phaseolus vulgaris L., Fabaceae) Theor Appl Genet. 2009;118:979–992. doi: 10.1007/s00122-008-0955-4. [DOI] [PubMed] [Google Scholar]
- Li YC, Korol AB, Fahima T, Nevo E. Microsatellites within genes: Structure, function, and evolution. Mol Biol Evol. 2004;21:991–1007. doi: 10.1093/molbev/msh073. [DOI] [PubMed] [Google Scholar]
- Lynch M, Walsh JB. Genetics and Analysis of Quantitative Traits. Sinauer Associates; Sunderland: 1998. p. 980. [Google Scholar]
- Maciel FL, Echeverrigaray S, Gerald LTS, Gobbi-Grazziotin F. Genetic relationships and diversity among Brazilian cultivars and landraces of common beans (Phaseolus vulgaris L.) revealed by AFLP markers. Gen Res Crop Evol. 2003;50:887–893. [Google Scholar]
- Maluf MP, Silvestrine M, Ruggiero LMC, Guerreiro-Filho O, Colombo CA. Genetic diversity of cultivated Coffea arabica inbred lines assessed by RAPD, AFLP and SSR marker systems. Sci Agric. 2005;62:366–373. [Google Scholar]
- Maras M, Susnik S, Sustar-Vozlic J, Meglic V. Temporal changes in genetic diversity of common bean (Phaseolus vulgaris L.) accessions cultivated between 1800 and 2000. Russian J Genet. 2006;42:775–782. [PubMed] [Google Scholar]
- Maras M, Sustar-Vozlic J, Javornik B, Meglic V. The efficiency of AFLP and SSR markers in genetic diversity estimation and gene pool classification of common bean (Phaseolus vulgaris L.) Acta Agric Slov. 2008;91:87–96. [Google Scholar]
- Marotti I, Bonetti A, Minelli M, Catizone P, Dinelli G. Characterization of some Italian common bean (Phaseolus vulgaris L.) landraces by RAPD, semi-random and ISSR molecular markers. Genet Resour Crop Evol. 2007;54:175–188. [Google Scholar]
- Masi P, Spagnoletti-Zeuli PL, Donini P. Development and analysis of multiplex microsatellite markers sets in common bean (Phaseolus vulgaris L.) Mol Breed. 2003;11:303–313. [Google Scholar]
- Masi P, Logozzo G, Donini P, Spagnoletti ZP. Analysis of genetic structure in widely distributed common bean landraces with different plant growth habits using SSR and AFLP markers. Crop Sci. 2009;49:187–199. [Google Scholar]
- McCouch SR, Temnykh S, Lukashova A, Coburn J, Declerck G, Cartinhour S, Harrington S, Thomson M, Septiningsi E, Semon M, et al. Khush GS, Brar DS, Hardy B, editors. Microsatellite markers in rice: Abundance, diversity and applications. Rice Genetics IV IRRI, Manila. 2001. pp. 117–135.
- Menezes MVCO, Santos JB, Menezes M. Genetic diversity in Carioca and Pérola cultivars of common bean based on RAPD markers. Crop Breed Appl Biotechnol. 2004;4:178–182. [Google Scholar]
- Métais I, Hamon B, Jalouzot R, Peltier D. Structure and level of genetic diversity in various bean types evidenced with microsatellite markers isolated from a genomic enriched library. Theor Appl Genet. 2002;104:1346–1352. doi: 10.1007/s00122-002-0901-9. [DOI] [PubMed] [Google Scholar]
- Miller M. TFPGA – Tools for Population Genetic Analyses, v. 1.3. Northern Arizona University; Flagstaff: 1997. p. 33. [Google Scholar]
- Mueller UG, Wolfenbarger LL. AFLP genotyping and fingerprinting. Trends Ecol Evol. 1999;14:389–394. doi: 10.1016/s0169-5347(99)01659-6. [DOI] [PubMed] [Google Scholar]
- Nei M. Estimation of average heterozygosity and genetic distance from a small number of individuals. Genetics. 1978;89:583–590. doi: 10.1093/genetics/89.3.583. [DOI] [PMC free article] [PubMed] [Google Scholar]
- Nowosielski J, Podyma W, Nowosielska D. Molecular research on the genetic diversity of Polish varieties and landraces of Phaseolus coccineus L. and Phaseolus vulgaris L. using the RAPD and AFLP methods. Cell Mol Biol Lett. 2002;7:753–762. [PubMed] [Google Scholar]
- Oblessuc PO, Campos T, Cardoso JMK, Sforça DA, Baroni RM, Souza AP, Benchimol LL. Adaptation of fluorescent technique for genotyping with new microsatellite markers in common bean. Pesq Agropec Bras. 2009;44:638–644. [Google Scholar]
- Oliveira KM, Laborda PR, Garcia AAF, Zagatto-Paterniani MEAG, Souza AP. Evaluating genetic relationships between tropical maize inbred lines by means of AFLP profiling. Hereditas. 2004;140:24–33. doi: 10.1111/j.1601-5223.2004.01702.x. [DOI] [PubMed] [Google Scholar]
- Oraguzie NC, Rikkerink EHA, Gardiner SE, De Silva HN. SNP Applications in Plants – Association Mapping in Plants. Springer; New York: 2007. p. 277. [Google Scholar]
- Palomino EC, Mori ES, Zimback L, Tamborussi EV, Moraes CB. Genetic diversity of common bean genotypes of Carioca commercial group using RAPD markers. Crop Breed Appl Biotechnol. 2005;5:80–85. [Google Scholar]
- Pallottini L, Garcia E, Kami J, Barcaccia G, Gepts P. The genetic anatomy of a patented yellow bean. Crop Sci. 2004;44:968–977. [Google Scholar]
- Papa R, Gepts P. Asymmetry of gene flow and differential geographical structure of molecular diversity in wild and domesticated common bean (Phaseolus vulgaris L.) from Mesoamerica. Theor Appl Genet. 2003;106:239–250. doi: 10.1007/s00122-002-1085-z. [DOI] [PubMed] [Google Scholar]
- Payró de la Cruz E, Gepts P, Colunga-GarciaMarín P, Zizumbo-Villareal D. Spatial distribution of genetic diversity in wild populations of Phaseolus vulgaris L. from Guanajuato and Michoacán, Mexico. Genet Resour Crop Evol. 2005;52:589–599. [Google Scholar]
- Pejic I, Ajmone-Marsan P, Morgante M, Kozumplick V, Castiglioni P, Taramino G, Motto M. Comparative analysis of genetic similarity among maize inbred lines detected by RFLPs, RAPDs, SSRs, and AFLPs. Theor Appl Genet. 1998;97:1248–1255. [Google Scholar]
- Powell W, Morgante M, Andre C, Hanafey M, Vogel J, Tingey S, Rafalski A. The comparison of RFLP, RAPD, AFLP, and SSR (microsatellite) markers for germplasm analysis. Mol Breed. 1996;2:225–238. [Google Scholar]
- Rafalski AJ. Novel genetic mapping tools in plants: SNPs and LD-based approaches. Plant Sci. 2002;162:329–333. [Google Scholar]
- Rieseberg LH. Genetic mapping as a tool for studying speciation. In: Soltis PS, Doyle JJ, editors. Molecular Systematics of Plants. Chapman & Hall; New York: 1998. pp. 459–487. [Google Scholar]
- Rohlf FJ. NTSYS-PC Numerical taxonomy and multivariate analysis system, v. 2.0j. Exeter Publ; Setauket: 1993. p. 31. [Google Scholar]
- Rosales-Serna R, Hernandez-Delgado S, Gonzalez-Paz M, Acosta-Gallegos JA, Mayek-Perez N. Genetic relationships and diversity revealed by AFLP markers in Mexican common bean bred cultivars. Crop Sci. 2005;45:1951–1957. [Google Scholar]
- Saini N, Jain N, Jain S, Jain RK. Assessment of genetic diversity among Basmati and non-Basmati rice varieties using AFLP, ISSR and SSR markers. Euphytica. 2004;140:133–146. [Google Scholar]
- Santalla M, De Ron AM, De La Fuente M. Integration of genome and phenotypic scanning gives evidence of genetic structure in Mesoamerican common bean (Phaseolus vulgaris L.) landraces from the southwest of Europe. Theor Appl Genet. 2010;120:1635–1651. doi: 10.1007/s00122-010-1282-0. [DOI] [PubMed] [Google Scholar]
- Saunders JA, Hemeida AA, Mischke S. USDA DNA fingerprinting programme for identification of Theobroma cacao accessions. In: Bekeleetal F, editor. Proceedings of the International Workshop on New Technology in Cocoa Breeding 2000. INGENIC Press; London: 2001. pp. 108–144. [Google Scholar]
- Schneider S, Excoffier L. Estimation of demographic parameters from the distribution of pairwise differences when the mutation rates vary among sites: Application to human mitochondrial DNA. Genetics. 1999;152:1079–1089. doi: 10.1093/genetics/152.3.1079. [DOI] [PMC free article] [PubMed] [Google Scholar]
- Schuelke M. An economic method for the fluorescent labeling of PCR fragments. Nat Biotechnol. 2000;18:233–234. doi: 10.1038/72708. [DOI] [PubMed] [Google Scholar]
- Svetleva D, Pereira G, Carlier J, Cabrita L, Leitão J, Genchev D. Molecular characterization of Phaseolus vulgaris L. genotypes included in Bulgarian collection by ISSR and AFLP analyses. Sci Hort. 2006;109:198–206. [Google Scholar]
- Talukder ZI, Anderson E, Miklas PN, Blair MW, Osorno J, Dilawari M, Hossain KG. Genetic diversity and selection of genotypes to enhance Zn and Fe content in common bean. Can J Plant Sci. 2010;90:49–60. doi: 10.4141/CJPS09096. [DOI] [PMC free article] [PubMed] [Google Scholar]
- Tautz D, Schlötterer C. Simple sequences. Curr Opin Genet Dev. 1994;4:834–837. doi: 10.1016/0959-437x(94)90067-1. [DOI] [PubMed] [Google Scholar]
- Tessier C, David J, This P, Boursiquot JM, Charrier A. Optimization of the choice of molecular markers for varietal identification in Vitis vinifera L. Theor Appl Genet. 1999;98:171–177. [Google Scholar]
- Tivang JG, Nienhuis J, Smith OS. Estimation of sampling variance of molecular marker data using the bootstrap procedure. Theor Appl Genet. 1994;89:259–264. doi: 10.1007/BF00225151. [DOI] [PubMed] [Google Scholar]
- Thormann CE, Ferreira ME, Camargo LEA, Tivang JG, Osborn TC. Comparison of RFLP and RAPD markers to estimating genetic relationships within and among cruciferous species. Theor Appl Genet. 1994;88:973–980. doi: 10.1007/BF00220804. [DOI] [PubMed] [Google Scholar]
- Tohme J, Orlando-Gonzalez D, Beebe S, Duque MC. AFLP analysis of gene pools of a wild bean core collection. Crop Sci. 1996;36:1375–1384. [Google Scholar]
- Vos P, Hogers R, Bleeker M, Reijans M, Van De Lee T, Hornes M, Frijters A, Pot J, Peleman J, Kuiper M, et al. AFLP a new technique for DNA fingerprinting. Nucleic Acids Res. 1995;23:4407–4414. doi: 10.1093/nar/23.21.4407. [DOI] [PMC free article] [PubMed] [Google Scholar]
- Yu MA, Bliss FA. Seed proteins of common bean. Crop Sci. 1978;18:431–437. [Google Scholar]
- Yu K, Park SJ, Poysa V. Abundance and variation of microsatellite DNA sequences in beans (Phaseolus and Vigna) Genome. 1999;42:27–34. [Google Scholar]
- Zhang X, Blair MW, Wang S. Genetic diversity of Chinese common bean (Phaseolus vulgaris L.) landraces assessed with simple sequence repeat markers. Theor Appl Genet. 2008;117:629–640. doi: 10.1007/s00122-008-0807-2. [DOI] [PubMed] [Google Scholar]
Internet Resources
- AmiGo. http://amigo.geneontology.org (September 10, 2009).
- Lewis PO, Zaykin D. Genetic data analysis: Computer program for the analysis of allelic data, v. 1.0 (d15) 2000. http://alleyn.eeb.uconn.edu/gda/2000 (June 15, 2009).
- NCBI. http://www.ncbi.nlm.nih.gov (September 10, 2009).
- NTSYS-pc Software. http://pritch.bsd.uchicago.edu. (November 20, 2009).
- R-software: http://www.r-project.org (November 22, 2009).
- PFAM, http://pfam.sanger.ac.uk (September 10, 2009).
- TFPGA Software, http://herb.bio.nau.edu/~miller (November 20, 2009).
Associated Data
This section collects any data citations, data availability statements, or supplementary materials included in this article.
Supplementary Materials
Functional annotation off SSRs sharing similarity with proteins in GenBank.
SSRs with similarity to ESTs deposited in the dbEST databank.