Abstract
Scanning X-ray microscopy focuses radiation to a small spot and probes the sample by raster scanning. It allows information to be obtained from secondary signals such as X-ray fluorescence, which yields an elemental mapping of the sample not available in full-field imaging. The analysis and interpretation from these secondary signals can be considerably enhanced if these data are coupled with structural information from transmission imaging. However, absorption often is negligible and phase contrast has not been easily available. Originally introduced with visible light, Zernike phase contrast1 is a well-established technique in full-field X-ray microscopes for visualization of weakly absorbing samples2–7. On the basis of reciprocity, we demonstrate the implementation of Zernike phase contrast in scanning X-ray microscopy, revealing structural detail simultaneously with hard-X-ray trace-element measurements. The method is straightforward to implement without significant influence on the resolution of the fluorescence images and delivers complementary information. We show images of biological specimens that clearly demonstrate the advantage of correlating morphology with elemental information.
Sensitivity to the phase of the wavefield probing a specimen often results in improved contrast compared with absorption, especially when imaging biological samples such as small organisms, tissue sections, cells and so on. The principle of Zernike’s idea of phase contrast for full-field microscopes is illustrated in Fig. 1. Following Abbe’s theory of image formation in a microscope8, the light illuminating the object is divided into an undiffracted part and a diffracted part that carries the information about the sample structure. A spatial separation of these two components is achieved in the back-focal plane of the objective lens, where a phase-shifting ring imparts a predetermined phase shift (90° for positive contrast or 270° for negative contrast) onto the undiffracted part. The phase-contrast image is formed by the interference of the phase-shifted undiffracted component with the undisturbed diffracted component, translating phase modulations of the sample into intensity modulations in the image plane. For small phase shifts, these modulations are due to the differences in the real part of the object’s index of refraction, whereas the imaginary part leading to absorption contrast is usually small and can often be neglected.
Figure 1. Principle of Zernike phase contrast.
Interference of undiffracted light (red) that will be phase shifted by the phase ring with diffracted light (green) translates phase variations of the object into intensity modulations in the image plane.
The reciprocity theorem reflects the interchangeability of the source and observation point for electromagnetic systems. In the case of imaging theory this principle is reflected in the symmetry of the variables in the Fresnel–Kirchhoff diffraction integral for wave propagation8,9. It has long been recognized in the microscopy community that this relationship signifies the equivalence of full-field and scanning transmission microscopes10–12. On this basis, the concept of Zernike imaging in a scanning microscope was considered by Wilson and Sheppard13 and Siegel et al.14; however, no detailed treatment or implementation has been reported so far.
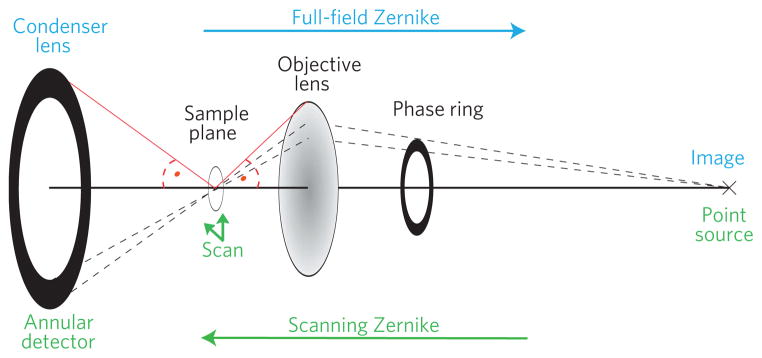
The equivalence of full-field and scanned Zernike imaging is illustrated in Fig. 2. In full-field imaging a condenser illuminates the object of interest; the transmitted light gets collected by the objective lens to form an image in the detector plane. A phase ring in the condenser’s conjugate plane (given through the lens law) provides the necessary phase shift for Zernike’s method of phase contrast. In the scanning case the propagation direction gets reversed and the image point takes the role of the source illuminating the objective lens, which then focuses the light to a spot through which the sample is raster scanned. The detected intensity for each point of the scan forms the image. To realize Zernike phase contrast in this case a phase ring is placed in front of the objective, and sensitivity to the object’s phase modulation is then given by using an annular detector in the conjugate plane of the phase ring. Note, that the principle of phase advance and the subsequent sensitivity to the phase shift introduced by the specimen is the same for both cases, which are theoretically completely equivalent for on-axis image points. For the very extreme cases of strong absorbing and phase shifting specimens or infinitely thick phase rings (corresponding to dark-field imaging) differences might be noticeable but are beyond the scope of this manuscript (see Supplementary Information for a brief discussion).
Figure 2. Full-field versus scanning Zernike phase contrast.
Reading the image from left to right describes the full-field imaging case, whereas the scanning case is represented from right to left. Both microscopes are mathematically equivalent and produce the same images if the angles indicated are matched respectively10.
Following the above scheme, we implemented the method into the scanning hard-X-ray fluorescence beamline 2-ID-E at the Advanced Photon Source at Argonne National Laboratory. Hard-X-ray fluorescence microscopy is an excellent tool for mapping and quantification of elements down to trace amounts with many applications in the biological and medical sciences15,16. It also represents a valuable case study of our proposed technique, because at the X-ray energies needed for fluorescence of trace elements (5–50 keV), bulk biological material (which mainly consists of light elements) has a low fluorescence yield and shows little to no absorption contrast. Therefore, other means are required to image the structural information of the specimen.
The microscope at beamline 2-ID-E uses a Fresnel zone plate as an objective lens to focus 10 keV X-rays onto the sample. A silicon-drift-type energy-dispersive detector is used to collect the emitted fluorescence photons from the sample for each raster scan point. The phase ring required for scanning Zernike microscopy was fabricated out of gold with a thickness of 3.5 μm to produce a 3π/2 phase shift at 10 keV. Given the amount of phase shift the final result represents a negative Zernike phase-contrast image; that is, structures with positive phase shift appear dark. This has been chosen to most closely represent the appearance of absorption contrast. An existing high-speed multi-segment detector17 was slightly modified to realize an annular match to the projection of the phase ring (see Supplementary Information). However, any large-area detector may be used provided that it is masked with an appropriate annular aperture. Removal of the phase ring and use of all detector segments allows direct comparison to absorption contrast.
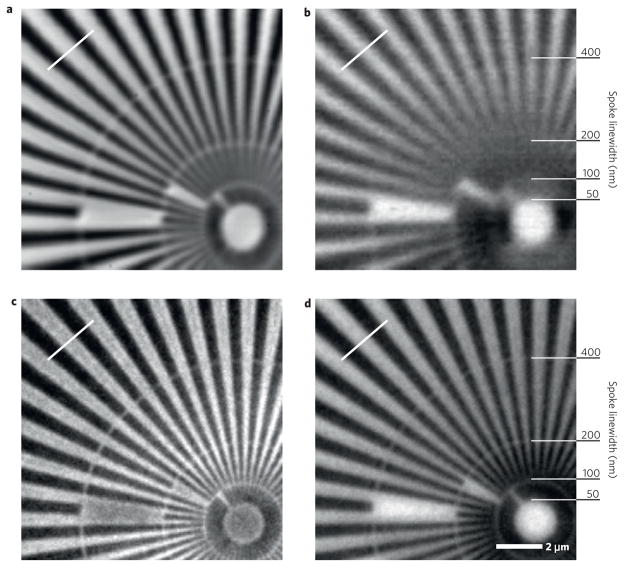
To evaluate the basic imaging properties of the method, we first imaged a Siemens star test pattern made of 700-nm-thick gold. In Fig. 3a,b we show scanning images obtained in Zernike phase contrast and absorption contrast, respectively. These images were acquired using a Fresnel zone plate with an outermost zone width of 100nm and thus a theoretical spot size and Rayleigh resolution of 122nm assuming fully coherent illumination of the zone plate and a large-area detector (incoherent detection). For qualitative comparison, Fig. 3c,d shows Zernike phase and absorption images taken in a commercial full-field X-ray microscope at 8 keV (ref. 18) with an imaging resolution of 100nm (see the Methods section). Distinctly resolved in both Zernike images are the 100nm linewidths (second ring from the centre). In the scanning Zernike image the resolution was limited by the finite and asymmetric X-ray source size, which is larger in the horizontal direction and causes the difference between horizontal and vertical feature resolution. A 15° pretilt around the vertical axis of the specimen that is necessary for the fluorescence mode of the microscope increases this effect. Additionally, the scanned absorption image has a significant dark-field contribution, which degrades the image resolution. Note that both Zernike cases show an improved contrast (scanning: 17.3%, full-field: 9.2%) to their respective absorption images (scanning: 4.1%, full-field: 4.9%), as expected. Images of other test structures also show the expected imaging properties and contrast enhancement of weakly absorbing structures in the Zernike imaging mode (see Supplementary Information).
Figure 3. Scanning and full-field images of a gold Siemens star test pattern in Zernike and absorption contrast.
a – d, Zernike phase contrast in scanning (a) and full-field (c) microscopy; absorption contrast for the two cases respectively (b and d). The starting linewidths of the spoke rings are indicated. The white line in each image marks where the contrast was determined.
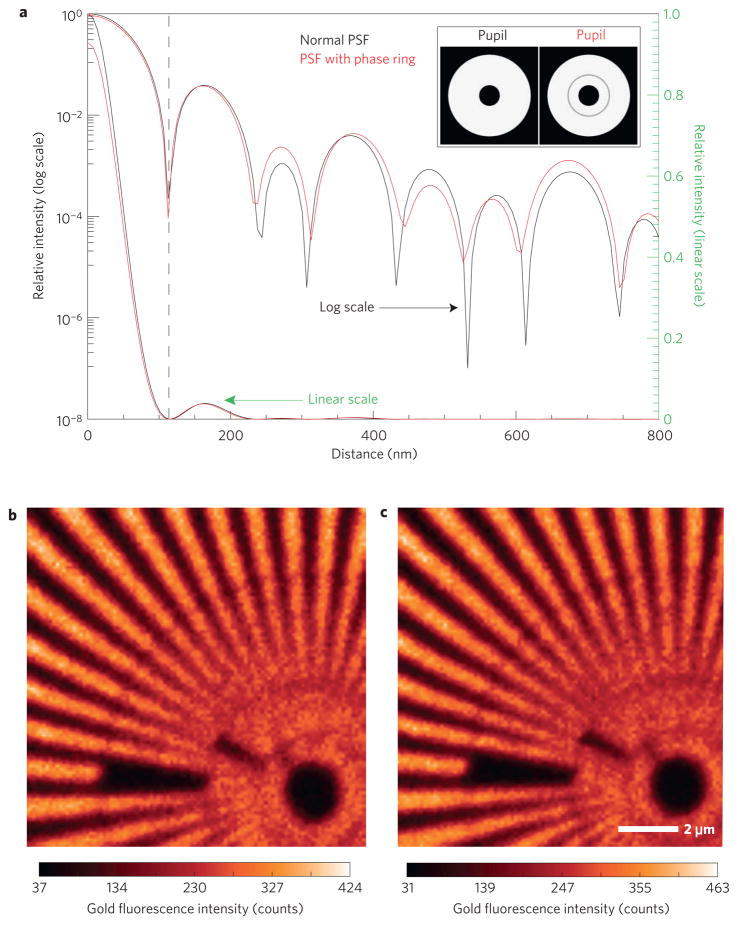
The addition of phase-contrast capability to the scanning microscope is especially useful if its optical performance in other modes is preserved. For X-ray microprobes, this requires the intensity profile in the focal plane (point spread function) to remain largely unmodified so that the absorption and thus trace-element fluorescence optical response remains unchanged. In Fig. 4a we show the simulated intensity point spread function (PSF) for a zone plate including a central stop without and with a Zernike phase ring in place. Considering the fractional area of the total objective pupil shadowed by the partially absorbing phase ring, the total intensity that gets focused by the objective and reaches the focal plane is reduced by only 2%. The intensity in the central maximum of the PSF shown in the wavefield simulation of Fig. 4a is reduced by 9% compared with the case without a phase ring. This is due to the redistribution of intensity into the side lobes of the PSF, giving rise to a small (7%) d.c. offset of the scanning signal, which is similar to the experimental background in most cases. The shape of the central peak, in particular the position of the first minimum, is unchanged, leading to no loss in imaging resolution. Figure 4b,c shows experimental gold fluorescence images formed from a gold star test pattern with and without the phase ring in place, which are in very good quantitative agreement with the simulations. These figures provide confirmation that the trace-element mapping performance of the system is not significantly compromised by the addition of Zernike phase-contrast capability for transmission imaging.
Figure 4. Effect of a phase ring on X-ray fluorescence imaging properties.
a, Computed PSF comparison with and without a phase ring in a linear and logarithmic scale. Inset: The objective transmission profile of the respective pupil functions. b,c, Experimental gold X-ray fluorescence signal of a Siemens star test pattern with (b) and without (c) a phase ring present.
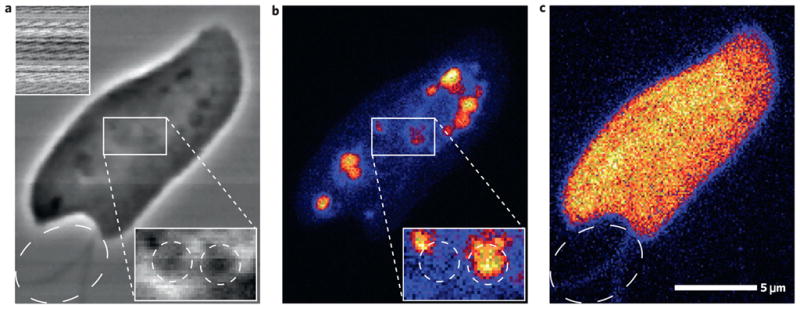
Zernike phase contrast provides especially significant benefits when studying biological specimens in an X-ray microprobe. In Fig. 5 we show an example of a freshwater flagellate Cryptomonas imaged with 10 keV X-rays. The unique and rich internal structure of this organism makes it particularly interesting for study. The scanning Zernike image (Fig. 5a) shows a detailed representation of the specimen including internal organelles, whereas the standard absorption image (Fig. 5a inset) has no contrast. We can identify the two flagella (whiplike appendages) of the cell in the Zernike image, which show up only faintly in the sulphur fluorescence (Fig. 5c). A dense feature is also apparent in the Zernike image at the leftmost tip of the cell where the contractile vacuole is typically located. Several phosphorous-rich features within the rightmost section of the cell correspond to the typical location of the nucleus, which in this case may be in the process of mitotic division. Smaller P-rich bodies may represent the nucleomorphs that are present in chloroplasts of these organisms. A magnified subregion is also shown in Fig. 5a,b, accentuating what appear to be two larger organelles in the Zernike image, of which only one shows P content. All of this demonstrates the added informational content from the scanning Zernike image, which allows the element-selective features to be put in an overall structural context. The sensitivity of the technique in our experiment can be estimated from the visibility of the flagella; these structures have an approximate thickness of 100–200 nm, which at the given X-ray energy translates into a phase sensitivity of up to π/220 or 0.015 rad.
Figure 5. Freshwater flagellate Cryptomonas.

a, Scanning Zernike with absorption as inset. b,c, X-ray fluorescence of phosphorus (b) and sulphur (c). Magnified subregions in a and b are scaled separately from the main image to highlight features. The flagella (whiplike appendages) outside the cell are pointed out by a dashed ellipse in a and c.
The obvious advantage of scanning Zernike phase-contrast imaging lies in the simplicity of the set-up and straightforward correspondence of the image to the sample density. Other methods of phase contrast in scanned imaging have been developed previously. In particular for scanning X-ray microscopes, differential phase contrast (DPC) has been an emerging and popular technique17. DPC is a qualitative contrast mechanism with the resulting image being a representation of the one-dimensional derivative of the specimen phase distribution. Hence, raw images are difficult to interpret and an additional step of image reconstruction19,20 is required to yield the true specimen phase information. We expect that in terms of sensitivity both phase imaging approaches behave identically. As far as resolution is concerned, in the Zernike case the annular detector is smaller than the full numerical aperture of the objective, leading to a slight decrease in resolution of the transmission image; on the other hand, the reconstruction step required for DPC represents an effective smoothing of the image that can also affect resolution negatively in the presence of noise. The potential combination of both approaches as differential Zernike phase contrast might pose an interesting future imaging possibility but is beyond the scope of this work.
We expect the described scanning Zernike phase-contrast method to find impact and application not only in scanning X-ray microscopes but also in instruments using other types of radiation.
Methods
The X-rays were focused with a Fresnel zone plate ZP100-160-16 (Xradia), with an outermost zone width of 100 nm, a diameter of 160 μm and a thickness of 1,600 nm. To isolate the first-order focus of the zone plate, a central stop with 40 μm diameter and an order-sorting aperture with 25 μm diameter were used.
The phase ring was fabricated by using electron beam lithography to pattern an annulus of 75 μm inner and 85 μm outer diameter on a silicon nitride window. Gold was electroplated to a thickness of 3.52 μm.
Full-field images were obtained using a nanoXCT X-ray microscope (Xradia) in the large-field-of-view mode with a rotating-anode source providing 8 keV Cu–Kα X-rays. A zone plate with 320 μm diameter and 30nm outermost zone width was used; the resolution of the microscope is limited by chromatic aberrations to approximately 100 nm.
X-ray fluorescence was detected with a Vortex-EM (SII NanoTechnology). The annular detection was realized with a custom-built segmented photodiode detector17, which possesses an annular segmentation. An additional stop with 160 μm diameter was used in front of the detector to mask the annular detector segment optimally to the projection of the phase ring.
Further information about the set-up and detection scheme is available in the Supplementary Information.
The gold test pattern was of the type X50-30-7 (Xradia), having a smallest feature size of 50nm with an overall thickness of 700 nm.
All scanning images were recorded with a dwell time of 100 ms per pixel and a step size of 100 nm.
The contrast for Fig. 3 was calculated using (Max−Min)/(Max+Min) of the line-outs indicated in the image.
In Fig. 5, dark pixels (no intensity) resulting from synchrotron top-off events (18 in total) have been removed on a single-pixel basis from the images, by replacing their respective value with the average value of the neighbouring pixels.
Cells of Cryptomonas erosa Ehrenberg were grown for 4 days under a 14 h:10 h light/dark cycle at 16 °C in sterile WCL1 medium made from milli-Q water21. Photosynthetically active radiation during light periods was maintained at 150–250 uEinm−2 s−1 using two cool white 20W fluorescent bulbs. Samples were prepared by preserving cells with a 0.25% glutaraldehyde (EM grade) solution and drying media containing preserved cells onto Au London Finder transmission electron microscopy grids.
Supplementary Material
Acknowledgments
Many thanks to J. Kirz for discussions, L. Finney for assistance with the experiment and Xradia for providing optical components. C.H. was supported by the National Institutes of Health under Grant 5R21EB006134-02. Use of the Advanced Photon Source at Argonne National Laboratory was supported by the US Department of Energy, Office of Science, Office of Basic Energy Sciences, under Contract No. DE-AC02-06CH11357.
Footnotes
Author contributions
C.H., M.F. and B.H. conceived the experiment and C.H., M.F., B.H., S.V. and C.J. contributed to its design. Cryptomonas specimens were prepared by S.B.B. C.H., M.F., S.V. and C.J. carried out the experiment. C.H. and M.F. carried out the data analysis. S.B.B. provided marine science background. All authors discussed the results and contributed to the manuscript.
Additional information
The authors declare no competing financial interests.
Supplementary information accompanies this paper on www.nature.com/naturephysics.
Reprints and permissions information is available online at http://npg.nature.com/reprintsandpermissions.
References
- 1.Zernike F. Das Phasenkontrastverfahren bei der mikroskopischen Beobachtung. Phys Zeitschr. 1935;36:848–851. [Google Scholar]
- 2.Rudolph D, Schmahl G, Niemann B. In: Modern Microscopies. Duke PJ, Michette AG, editors. Plenum Press; 1990. pp. 59–67. [Google Scholar]
- 3.Schmahl G, Rudolph D. X-ray Microscope. 4,870,674. US Patent. 1989
- 4.Schmahl G, Rudolph D. Phase Contrast X-ray Microscope. 5,550,887. US Patent. 1996
- 5.Schmahl G, Rudolph D, Schneider G, Guttmann P, Niemann B. Phase contrast X-ray microscopy studies. Optik. 1994;97:181–182. [Google Scholar]
- 6.Schmahl G, et al. Phase contrast studies of biological studies with the x-ray microscope at BESSY. Rev Sci Instrum. 1995;66:1282–1286. [Google Scholar]
- 7.Schneider G. Cryo x-ray microscopy with high spatial resolution in amplitude and phase contrast. Ultramicroscopy. 1998;75:85–104. doi: 10.1016/s0304-3991(98)00054-0. [DOI] [PubMed] [Google Scholar]
- 8.Goodman JW. Introduction to Fourier Optics. McGraw-Hill; 1968. [Google Scholar]
- 9.Born M, Wolf E. Principles of Optics. Ch 8.3. Cambridge Univ. Press; 2006. [Google Scholar]
- 10.Zeitler E, Thomson MGR. Scanning transmission electron microscopy. Optik. 1970;31:258–280. 359–366. [Google Scholar]
- 11.Sheppard CJR, Wilson T. On the equivalence of scanning and conventional microscopes. Optik. 1986;73:39–43. [Google Scholar]
- 12.Morrison GR, et al. Development of x-ray imaging at the Daresbury SRS. Rev Sci Instrum. 1989;60:2464–2467. [Google Scholar]
- 13.Wilson T, Sheppard C. Theory and Practice of Scanning Optical Microscopy. Academic; 1984. [Google Scholar]
- 14.Siegel A, Schmahl G, Rudolph D. Method and device for producing phase-contrast images. 4,953,188. US Patent. 1990
- 15.Fahrni C. Biological applications of X-ray fluorescence microscopy: Exploring the subcellular topography and speciation of transition metals. Curr Opin Chem Biol. 2007;11:121–127. doi: 10.1016/j.cbpa.2007.02.039. [DOI] [PubMed] [Google Scholar]
- 16.Paunesku T, Vogt S, Maser J, Lai B, Woloschak G. X-ray fluorescence microprobe imaging in biology and medicine. J Cell Biochem. 2006;99:1489–1502. doi: 10.1002/jcb.21047. [DOI] [PubMed] [Google Scholar]
- 17.Hornberger B, et al. Differential phase contrast with a segmented detector in a scanning x-ray microprobe. J Synchrotron Radiat. 2008;15:355–362. doi: 10.1107/S0909049508008509. [DOI] [PMC free article] [PubMed] [Google Scholar]
- 18.Tkachuk A, et al. X-ray computed tomography in Zernike phase contrast mode at 8 keV with 50-nm resolution using Cu rotating anode X-ray source. Nanocrystallogr. 2007;222:650–655. [Google Scholar]
- 19.de Jonge MD, et al. Quantitative phase imaging with a scanning transmission x-ray microscope. Phys Rev Lett. 2008;100:163902. doi: 10.1103/PhysRevLett.100.163902. [DOI] [PMC free article] [PubMed] [Google Scholar]
- 20.Hornberger B, Feser M, Jacobsen C. Quantitative amplitude and phase contrast imaging in a scanning transmission x-ray microscope. Ultramicroscopy. 2007;107:644–655. doi: 10.1016/j.ultramic.2006.12.006. [DOI] [PubMed] [Google Scholar]
- 21.Guillard RRL. In: Culture of Marine Invertebrate Animals. Smith WL, Chanley MH, editors. Plenum Press; 1975. pp. 29–60. [Google Scholar]
Associated Data
This section collects any data citations, data availability statements, or supplementary materials included in this article.


