

Abstract
Electrocorticography (ECoG) and functional MRI (BOLD-fMRI) have been used previously to measure brain activity during working memory delay periods. These studies have separately reported oscillation changes in the theta (4-8 Hz) band and BOLD-fMRI increases during delay periods when information is maintained in memory. However, it is not known how intracranial cortical field potential (CFP) changes relate to BOLD-fMRI responses during delay periods. To answer this question, fMRI was obtained from six epilepsy patients during a visual working memory task. Then, following subdural macroelectrode implant, continuous ECoG was used to record CFPs during the same task. Time-frequency analyses showed delay period gamma band oscillation amplitude increases on electrodes located near fMRI activity, while in the theta band changes were higher for electrodes located away from fMRI activation. The amplitude of the ECoG gamma band response was significantly positively correlated with the fMRI response, while a negative correlation was found for the theta band. The findings are consistent with previous reports of local field potential (LFP) coupling in the gamma band with BOLD-fMRI responses during visual stimulation in monkeys, but are novel in that the relationship reported here persists after the disappearance of visual stimuli while information is being maintained in memory. We conclude that there is a relationship between BOLD-fMRI increases and human working memory delay period gamma oscillation increases and theta decreases. The spectral profile change provides a basis for comparison of working memory delay period BOLD-fMRI with field potential recordings in animals and other human intracranial EEG studies.
Keywords: Working memory, delay activity, gamma, theta, electrocorticography, fMRI, BOLD, oscillations, intracranial EEG
Introduction
Delay period activity refers to the change in neural activity during the interval following encoding when information is being held online for later retrieval. It was discovered in single unit recording studies of non-human primates performing working memory delayed response tasks (Fuster, 1973; Kubota and Niki, 1971), and is manifest, in most neurons, as an increase in spike rate throughout the memory delay before the monkey is cued to make a choice, and in others as a transient initial increase at the beginning of the delay (Kojima and Goldman-Rakic, 1982). Delay activity is typically reported in lateral prefrontal cortex (Kojima and Goldman-Rakic, 1984; Quintana et al., 1988; Yajeya et al., 1988), but other regions including parietal cortex have been shown to affect the magnitude of delay activity in these frontal areas (Quintana et al., 1989). Delay period activity that is not associated with working memory processing per se has also been reported, including task-relevant sensorimotor activity possibly related to enhancing stimulus detection (Cowen and McNaughton, 2007) and motivational operations like reward expectancy (Watanabe et al., 2005).
Apart from single unit studies of delay period spiking activity, functional MRI studies of working memory have also reported blood oxygen level dependent (BOLD-fMRI) increases during memory delay periods (Curtis and D'Esposito, 2003; D'Esposito et al., 1998; Yee et al., 2010; Yoon et al., 2006). The technique of electrocorticography (ECoG) allows for the recording of cortical field potentials (CFPs) from macroelectrodes electrodes (typically 2-4 mm diameter contacts) implanted below dura in neurosurgical patients. The CFPs obtained using ECoG are summed over a relatively larger volume of brain compared to typical local field potential (LFP) recordings from extracellular electrodes implanted within cortex of animals and from hybrid intracranial depth electrodes used in some patients for evaluation of surgical options to treat epilepsy. Correlates of working memory delay activity have been previously reported in humans using ECoG. One early study reported delay period increases in theta oscillation amplitude (Raghavachari et al., 2001), although a systematic investigation of frequencies higher than theta were not reported. A more recent ECoG study also found evidence for changes in gamma oscillation amplitude during working memory (Meltzer et al., 2008). While these authors made a comparison between regions showing gamma band changes with a group map of fMRI responses, no within-subject comparisons of the ECoG and fMRI responses were made.
The outstanding question that this paper seeks to address is what is the relationship between hemodynamic working memory delay activity measured with fMRI-BOLD and electrical activity measured by intracranial EEG? To answer this question, fMRI-BOLD images were collected in six patients before electrode implant during performance of a visual working memory task. After electrodes were implanted, patients performed the same task and an analysis of the time-frequency characteristics of the delay period ECoG signal was conducted. Changes were assessed as a function of proximity to fMRI activity in order to determine which frequency bands showed sustained oscillation changes related to the fMRI-BOLD response.
Based on the review of previous human intracranial EEG studies as well as the animal electrical recording and functional imaging comparisons, we hypothesized at the outset of our study specific relationships between delay period BOLD-fMRI activity and gamma- and theta-band CFP oscillations measured with ECoG. We specifically predicted that the amplitude of gamma-band oscillations would be elevated at electrodes near fMRI activity based on data supporting the the BOLD-LFP hypothesis (Logothetis, 2002), which show the fMRI-BOLD response correlates positively with cortical gamma-band LFP increases. Other evidence also shows BOLD responses that correlate positively with amplitude of theta oscillations (Ekstrom et al., 2009) in the hippocampal complex. Given the limited data relating increases in BOLD-fMRI to changes in cortical theta activity, we made no specific prediction about the direction of cortical theta activity in relation to changes in the BOLD-fMRI response. Furthermore, we had no hypotheses about other frequency bands and made no specific predictions about changes in these bands in relation to the fMRI data. It is worth noting also that all six of the patients studied here had macroelectrodes implanted over cortex, so hippocampal BOLD-theta relationships could not be evaluated.
Most previous studies of brain electrical and hemodynamic responses have been made during sensory stimulation. A motivation for the present study was to determine the relationship between electrical and hemodynamic activity during the delay period after visual stimuli have completely disappeared. Although sustained (i.e., throughout the delay interval) BOLD-fMRI delay activity has been reported in humans, it is an open question how sustained activity is reflected in intracranial electrocorticographic recordings. Therefore, a secondary objective of this study is to describe in our patient sample the distribution of sustained delay period ECoG power changes irrespective of BOLD-fMRI activity so that a complete picture of frequency-specific ECoG working memory delay activity correlates could be obtained.
Materials and Methods
Subjects
Six patients with pharmaco-resistant epilepsy (all right handed, 2 males, mean age 35) provided written informed consent for enrollment in an IRB-approved study comparing functional imaging and electrophysiological measures of brain regions important for language and memory.
Working Memory Task
A Sternberg working memory task that has been used previously in human ECoG studies of working memory (Raghavachari et al., 2001) was used for post-implant intracranial recordings. This task utilizes presentation of letters (randomized so they do not spell words), which appear one at a time for 1 sec every two seconds. Following the encoding of these stimuli, a 2 sec delay period is followed by a 1 sec display of a probe letter and a two-alternative forced-choice button press by the patient to signal whether the probe matched one of the previously encoded stimuli. The ECoG task is self-paced and consists of 50 trials. The baseline is obtained from recordings taken between trials while the patient is fixating a central cross. The task was modified to be used in an MRI scanner for the pre-implant fMRI. In this task, four random letters are presented one at a time, followed by a delay period, and then by a yes/no decision about whether a single probe letter was one of the four seen before the delay. During encoding, letters are presented for 1 second at the beginning of each 2 sec TR. The delay interval is 3 TRs (6 sec, see Figure 1d) to accommodate a lagged delay period hemodynamic response. The probe letter appears after the delay for 1 sec. An 18 sec control baseline separates the eight 14 sec blocks of encoding, delay, and probe. Delay activity is compared against this baseline which, like the ECoG task, also consists center fixation.
Figure 1. Localization of intracranial macroelectrodes and classification of their relationship to fMRI delay activity in a single patient.

Electrode locations were localized and confirmed by intraoperative photography (a) by co-registering a high-resolution CT volume (b) to the pre-surgical T1-weighted MRI that was used to reconstruct the cortical surface (c). Electrodes proximal (c, white spheres) to delay period fMRI activity increases (c, orange activity) were categorized separately from electrodes located distal (c, red spheres) to fMRI activity increases or decreases relative to baseline. Other electrodes (c, black spheres) were not considered because they did not meet criteria. An example electrode (superior lateral frontal #4 – SLF4) is highlighted with a yellow circle (a-c). The average BOLD signal from the cluster of fMRI activity near the SLF4 electrode is shown (d, white line) next to the boxcar regressor (d, white line) used to model the eight delay periods within the run (136 TRs, 272 sec total scan time). The time-frequency difference spectrum (delay minus control) is shown (e) for the SLF4 electrode.
Image Acquisition
A single pre-implant imaging session on a 3 tesla Philips scanner included the collection of one high-resolution T1-weighted anatomical volume and a single echo-planar imaging run sensitive to BOLD contrast (136 dynamics, TR=2 sec) during the block-design working memory paradigm (8 cycles, 20 sec. memory / 14 sec. visuomotor baseline). The fMRI baseline was designed to keep the attention of the patient focused but make minimal demands on working memory. It consisted of simple change detection task: detection of a change in the background color of sequentially presented crosses (7 crosses, 6 on white background with 1 randomly appearing on a green background), Patients were instructed to press a button when a cross on the green background appeared during center fixation.
Intracranial EEG Acquisition
ECoG data were sampled at 1 kHz using an EEG 1100 Nihon Koden Neurofax acquisition system. Hardware filtering limited the effective bandwidth to between 0.15 and 300 Hz. Any channels with 60 Hz artifact were excluded from further analysis. The analytic time-frequency decomposition was limited to a range of 1 to 200 Hz. Before the time-frequency analysis was performed, any channels with 60 Hz line noise were excluded from further analysis, as were channels with ictal activity occurring during any part of the recording session and any electrodes overlaying cortex that was eventually resected. Following exclusion of these electrode channels, signal from the remaining channels were digitally re-referenced to a common average reference of channels excluding those channels with 60 Hz artifact, ictal activity, or electrodes over cortex that were later resected. For each memory trial, event times for the onset and offset of each item presentation, the start and end of the delay interval, and the onset and offset of each probe stimulus were sent to an isolated continuously sampled recording channel by a TTL pulse in order to synchronize the task components with ECoG data.
Image Processing
The fMRI data were processed in AFNI (Cox, 1996) using voxelwise multiple regression to produce output t-statistic and associated p-value maps for a contrast of the difference between delay period BOLD activity and the visuomotor baseline control condition. Significant (p<0.05, uncorrected) single-subject BOLD-fMRI activity was painted onto cortical surface reconstructions made from the T1-weighted MRI using FreeSurfer v4.5.0 (Dale et al., 1999; Fischl et al., 1999).
Electrode Localization
High resolution (0.5 mm in-plane resolution, 1 mm slices) computed tomography (CT) scans were taken immediately after surgical implant of the subdural electrodes. For each patient, the CT volume was co-registered to the T1-weighted MRI that was used to make the cortical surface reconstruction. The center of each electrode was identified from its high intensity signature on the CT volume and projected to the pial layer representation of the cortical surface using a constrained correction procedure along a surface normal to correct for deformation of electrode position due to brain shift. Brain shift varies by patient depending on the location and size of craniotomy, the number and placement of electrodes, and the presence and severity of any post-surgical swelling. The distortion relative to the cortical surface reconstruction computed from the high resolution pre-surgical T1 MRI is typically manifest as a medial shift of 1-4 mm, making electrodes appear to be below the pre-surgical cortical surface, and a lateral shift in the anterior-posterior or superior-inferior direction of as many as 12 mm. Our localization of electrodes relative to pre-surgical cortical geometry is similar to other methods for correcting brain shift, and is confirmed by photographs taken at explantation (removal of electrodes) allowing for the accuracy of the brain shift correction to be verified during the second surgery (Swann et al., 2009; Tertel et al., 2010). Electrode positions are modeled as spheres on the pial surface reconstruction, and each location was confirmed and adjusted if necessary to match the locations relative to gyral/sulcal relationships as indicated by intra-operative photography. Electrodes overlapping or within 5 mm of fMRI activity were counted as proximal electrodes. A similar number of electrodes located out of range (located 10 mm or more away from) of any significant fMRI activation (delay > baseline) or deactivation (baseline > delay) were considered distal electrodes.
Intracranial EEG Processing
Signal analysis involved analytical decomposition and computation of time-frequency power spectra as described previously (Canolty et al., 2007; Swann et al., 2009) and was implemented in Matlab 7.11 (R2010b, Mathworks, Natick MA). This process is analogous to a Gabor wavelet analysis in the temporal domain, but is performed in the frequency domain for speed. Briefly, each signal was Fourier transformed from the time to frequency domain, multiplied by overlapping Gaussians centered at multiple frequencies of interest (50 frequencies, min. freq=1.0Hz, max. freq=200 Hz, fractional bandwidth=0.2), and inverse Fourier transformed back to the time domain. The resulting analytic signal had an equal number of time points as the original raw signal, but contained a number of orthogonal representations equal to the 50 different frequencies of interest. Power was calculated by squaring the amplitude of analytic signal, and was then used to construct time-frequency power spectra for two different epochs of the task, the delay interval and a control baseline interval. Each patient completed 50 trials of the working memory paradigm during ECoG recording.
For each trial, after the serial presentation of letter (i.e., item) strings, a 2 second delay period followed during which the monitor was completely blank (color black). For each channel, power spectra were computed for each of these 50 delay periods, resulting in a matrix of power spectra of size 50 (trials) × 50 (frequencies) × 2000 (time in ms) and another 50 × 50 × 2000 matrix of power spectra were computed for a baseline period taken between the end and beginning of each trial. At each channel, the matrices of spectra were averaged to produce a mean power spectrum for the delay period, Pd, and a mean power spectrum for the baseline period, Pb. These mean spectra were subtracted and normalized by trial-to-trial variance with no assumption of similar variance in the delay and baseline periods using the following equation:
where s is the variance over n=50 trials.
Thus, at each channel a single spectrum of size 50 (frequency) × 2000 (time) was computed with each element representing a standardized difference, equivalent to a t-statistic, between the delay and baseline periods.
Analysis of iEEG in Relation to fMRI Activity
The standardized difference spectra were categorized according to their proximity to fMRI delay period activity (proximal=near fMRI activity, distal=not near fMRI activation or deactivation). For each patient, all proximal and distal spectra were averaged separately, and the distal mean spectrum was subtracted from the proximal mean spectrum, which resulted in a single summary spectrum per patient that corresponded to the time-frequency difference between ECoG signals recorded near fMRI delay activity and away from any fMRI activation or deactivation. Using the gamma band as an example, the logic behind this subtraction is such that positive changes in the resulting spectra mean that gamma band activity is greater on electrodes located near fMRI activity, whereas negative changes in the resulting spectra mean gamma activity is greater on electrodes located away from fMRI activity. If positive outweigh negative changes across the delay interval across electrodes within a subject, and this trend replicates across subjects, then it can be concluded that gamma delay activity increases on average near areas where fMRI activity increases.
The summary statistic at each element of the 50 × 2000 difference spectrum is an averaged t-statistic; averaging was justified and made simple by having equivalent within-subject degrees of freedom (n=50 trials). Three sets of analyses were conducted on two ranges of frequencies that were hypothesized to show changes in activity as a function of the BOLD response during the delay period. These included the theta (4-8 Hz) and gamma (30-200 Hz) bands. Given our focus on hypothesized changes within these bands, the statistics presented here are not corrected for multiple comparisons across all seven frequency bands that could have potentially been considered. However, in the presentation of the individual and group spectra we show all seven bands but do not note statistical changes outside of theta and gamma because we did not have a priori hypotheses about how electrical activity would change as a function of fMRI in these other bands. Furthermore, given our specific prediction about the direction of gamma band changes with respect to the BOLD-fMRI response, we used 1-tailed tests when assessing the significance of the gamma band effects. Given that we had no specific prediction about the direction of the relationship between theta and fMRI, we used 2-tailed tests when assessing the significance theta band effects.
For the first analysis, each of the 6 patient difference spectra was displayed, and the sum of positive and negative t-values across the different frequency ranges was computed. A net change (+ for positive>negative change, - for positive<negative change) was tabulated to determine how electrical activity varied as a function of proximity to fMRI activation. In these maps, positive values tending toward the color red indicate electrical activity is greater on electrodes near fMRI activity, while negative values tending toward the color blue indicate activity is greater on electrodes distal to fMRI activity.
For our second analysis, the 6 individual patient difference spectra were subjected to a random-effects analysis with a threshold of 2.197 (equivalent to p<0.05 uncorrected with 6 subjects) chosen as the a priori significance threshold. This statistical approach to summarizing multiple difference spectra in order to produce a single group difference spectrum is similar to a random effects analysis for population level inference of multiple subject 3D brain image t-statistic maps, but in this case consists of multiple subject 2D t-statistic time-frequency spectra.
Additional analyses including correlation of ECoG and fMRI amplitudes, and comparisons of power spectral density between proximal and distal electrodes collapsed across the delay interval were computed in Matlab using the corrcoef, regress, and periodogram functions respectively.
Results
Task Performance
Task performance was well above chance (mean accuracy = 85.6%, SD = 12.5, mean response time = 1522 ms, SD = 430 ms) confirming intact working memory abilities in our sample of patients.
Distribution of Electrode Locations
For the analysis of ECoG activity as a function of proximity to BOLD-fMRI activity, a total of 118 electrodes were analyzed (64 proximal, 54 distal). A visual depiction of these electrodes in standard space is provided in Figure 2, and a lobar breakdown is given in Table 1. The majority of these electrodes were located in the frontal lobe, as that is where patient electrode coverage was most dense and also where the majority of working memory BOLD-fMRI delay activity was located.
Figure 2. Distribution of electrode locations proximal and distal to fMRI delay activity.

Intracranial macroelectrode positions are initially modeled as spheres on cortical surface reconstructions in native space. To aide visualization of locations across patients, each electrode sphere is transformed to standard space and displayed here in relation to a gray/white matter border surface reconstruction of the standard space (MNI) N27 brain. White spheres mark electrodes located proximal to fMRI delay activity, and red spheres indicate electrodes located distal to fMRI delay activity.
Table 1.
Breakdown of electrodes proximal and distal to fMRI activity by brain area.
| Proximal | Distal | |
|---|---|---|
| Frontal | 49 | 30 |
| Orbitofrontal | 2 | 4 |
| Parietal | 6 | 1 |
| Temporal | 6 | 18 |
| Occipital | 1 | 1 |
| Total | 64 | 54 |
Single-Subject Analyses
Individual patient time-frequency difference spectra (proximal minus distal electrodes) were computed (Figure 3). Positive and negative amplitude changes were summed throughout the delay period and displayed to the right of each spectrum (Figure 3). We examined in how many patients positive changes were greater than negative changes, or vice versa, throughout the delay interval. Five of six patients showed positive changes that outweighed negative (proximal > distal) changes in both the middle and high gamma bands (Figure 3a-e), while one patient showed negative changes that outweighed positive changes in all gamma bands (Figure 3f). For theta, the opposite pattern was found, with five of six patients showing negative changes that outweighed positive (distal > proximal) changes. The pattern of results in opposite directions for changes in gamma and theta as a function of proximity to fMRI activity motivated the next analysis of individual patient mean difference spectra using a random effects approach.
Figure 3. Individual patient time-frequency difference spectra.

Each patient's delay period difference spectrum (proximal minus distal electrodes) is shown in a separate panel (a through f). To the right of each patient's spectrum, a quantification of the positive (red bar, proximal>distal) and negative (blue bar, proximal<distal) changes across each frequency band is shown. Changes across each band were quantified by summing the time-frequency spectrum values and dividing by 2000, the number of samples in the delay period.
Random Effects Analysis
A group time-frequency difference spectrum (proximal minus distal electrodes) was computed by averaging the six individual patients' mean time-frequency spectra. Positive changes were obtained throughout the delay period (Figure 3a), mostly in the gamma range (30-200 Hz) where the average positive amplitude change exceeded our a priori statistical threshold of 2.197 (equivalent to p<0.05 uncorrected with 6 subjects). A significant negative change was obtained in the theta (-5.92) band. We examined whether positive changes were greater than negative changes, or vice versa, throughout the delay interval. These changes were quantified by summing the positive and negative standardized amplitude differences within each frequency band and dividing by 2000, the number of samples in the delay period. Summation and division by total delay time produced two numbers for each of the seven frequency bands that summarized separately the average increase and decrease in oscillation amplitude throughout the delay period (Figure 3b). Positive outweighed negative amplitude changes in low-gamma (2.52), mid-gamma (1.70), and high-gamma (1.05). Negative outweighed positive changes in the theta (-5.88) band.
The pattern of relative power differences in the group average was confirmed by plotting means (+/- SEM) of the individual patient's positive and negative time-frequency power changes (Figure 4). Here too positive changes outweighed negative power changes only in the gamma bands, with variability across patients found to be the least in the mid-gamma band (1.56) and highest in the low gamma band (4.53).
Figure 4. Group analysis time-frequency difference spectrum.

Each patient's delay period difference spectrum (proximal minus distal) was averaged to produce a single time-frequency spectrum (a) where green-to-red colors indicate greater change for proximal relative to distal electrodes and green-to-blue indicates greater change for distal relative to proximal electrodes. In each band, positive (b, red, proximal>distal) and negative (b, blue, proximal<distal) changes were quantified by integrating time-frequency values and dividing by 2000, the number of samples in the delay period. For each frequency band, the mean and subject error (+/- 1 sem) of positive and negative changes are plotted.
In summary, the results of the random effects analysis confirmed the pattern seen in the single-subject results. Specifically, gamma activity increases proximal to areas where BOLD increases. The theta band shows the opposite pattern, with increased theta activity distal to BOLD activity increases. However, the differences in frequency-specific ECoG activity relative to BOLD activity increases are not informative about whether there is a significant relationship between changes in the magnitudes of ECoG and BOLD activity. To answer this question, correlation and regression analyses were performed across the sets of electrodes.
Correlation Analysis
Relationships between the amplitude of the ECoG and fMRI responses during the delay period were analyzed by computing Pearson correlation coefficients. Positive correlations were obtained in the gamma bands. These were significant for mid-gamma (r=0.19, p=0.04, Fig. 5b), but not for low-gamma (r=0.07, p=0.43) or high-gamma (r=0.09, p=0.30). A significant negative correlation was found for theta (r=-0.22, p=0.02, Fig. 5a). To ensure that the significant relationships identified with standard correlational analyses were not driven by outliers, we also carried out robust regressions using robustfit in Matlab with the default bisquare weight function and a tuning constant of 5. The mid-gamma relationship remained positive (t = 2.01) and significant (p = 0.046), while the theta relationship remained negative (t = -1.72) and marginally significant (p = 0.09).
Figure 5. Relationship between amplitude of ECoG and fMRI delay activity.
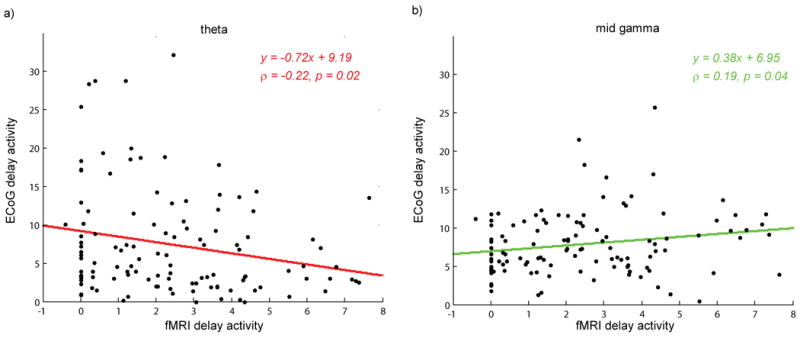
For all 118 proximal and distal electrodes, the amplitude of delay period ECoG activity was plotted against the fMRI activity. A significant negative correlation was found in the theta band (a, r=-0.22, p=0.02) and a positive correlation was found in the mid-gamma band (b, r=0.19, p=0.04).
Power Spectral Density Analysis
In order to determine whether the inverse correlation of BOLD response magnitude with theta magnitude resulted from a shift in the spectrum, the power spectral density across the delay interval was computed from the periodogram of the ECoG delay signals in each patient separately for the set of electrodes proximal to fMRI activity and for the set of electrodes distal to any fMRI activity. A consistent shift in the spectrum was noted in five out of six patients (Figure 6a-b,d-f), which was significant (p=0.02), and was manifest as lower power spectral density throughout the theta band on electrodes proximal to the fMRI activity. This shows that, on electrodes located away from fMRI activity increases (and decreases), total power in the theta band is higher compared to theta power on electrodes located near fMRI activity.
Figure 6. Theta band power spectral density is shifted lower for cortical potentials recorded near fMRI activity.

Power spectral density across the delay interval was computed from the periodogram of the ECoG signals in each patient separately for the set of electrodes proximal to fMRI activity (white) and for the set of electrodes distal to any fMRI activity (red). A consistent and significant (p=0.02) shift in the spectrum was noted in five out of six patients indicating that total power in the theta band is relatively higher for cortical potentials recorded away from fMRI delay activity.
The group and single-subject analyses showed that gamma band delay period oscillatory power is higher for electrodes near fMRI activity relative to electrodes located away from fMRI activity. The opposite relationship holds for theta, where delay period oscillatory power is greater for electrodes located away from fMRI activity compared to electrodes near fMRI activity.
Analysis of All Electrodes
A final analysis was conducted to determine, irrespective of each electrode's location relative to fMRI activity, the distribution of electrode responses showing gamma-band increases, theta-band increases, or conjoint increases in both the gamma and theta bands. A 2 standard deviation change in amplitude integrated across the entire delay period relative to baseline was used as the criterion for categorizing an individual electrode's response into one of the three categories. After removing electrodes contaminated by noise artifacts as well as those adjacent to cortex that was eventually resected to treat the epilepsy, a total of 397 electrodes were considered. Of these, 253 (63.7%) showed power increases in either the gamma (45 electrodes, 11%, Fig. 7a), theta (112 electrodes, 28%, Fig. 7b), or both the gamma and theta (96 electrodes, 24%, Fig. 7c) bands.
Figure 7. Frequency-Specific Delay Period Power Increases Irrespective of BOLD-fMRI Activity.

A total of 397 electrodes across the 6 patients were evaluated for significant (> 2 std. change) in the delay period relative to baseline. Of the total 397 electrodes, 253 (63.7%) were sorted into three categories according to sustained increases in either the gamma band (a, 45 or 11.3% of electrodes), the theta band (b, 112 or 28.2% of electrodes) or both the gamma and theta bands (c, 96 or 24.2% of electrodes).
Discussion
The main objective of this paper is to characterize oscillations in the intracranial cortical field potential in relation to the BOLD-fMRI response during a working memory delay period. Understanding how mnemonic information is coded in the brain during working memory delay periods is relevant to understanding the neural basis of working memory dysfunction in disorders as diverse as schizophrenia (Gold et al., 2010; Henseler et al., 2009), neurodegeneration (Baier et al., 2010; Lewis et al., 2003), and autism (Koshino et al., 2008; O'Hearn et al., 2008). It is also relevant for a basic understanding of how brain signals acquired from multiple modalities can be decoded to reveal the contents of working memory (Fuentemilla et al., 2010; Harrison and Tong, 2009; Hernandez et al., 2010). For these reasons, we wanted to know, given evidence in individual patients of delay period BOLD-fMRI activity, how do oscillations in the gamma and theta bands change in relation to the hemodynamic activity? Furthermore, we were interested in knowing how the magnitude of the BOLD-fMRI response was related to the magnitude of oscillatory change.
The main result obtained in this study using both single-subject and random effects analyses is that in regions of cortex exhibiting significant BOLD-fMRI delay period activation, cortical gamma oscillation amplitude increases relative to distal cortical regions showing no significant fMRI activity. The opposite pattern was obtained for the amplitude of theta oscillations. While gamma increases near to the fMRI delay activity, there is a relative decrease in theta. Additionally it was found in a separate correlational analysis of electrodes located both near and away from fMRI activation (and deactivation) that the magnitude of the BOLD-fMRI response was positively related to the magnitude of gamma activity throughout the delay interval. An inverse relationship was found to exist for theta, where lower magnitude BOLD-fMRI responses correspond to higher theta activity throughout the delay interval, and higher magnitude BOLD-fMRI response corresponds to lower theta. For cortex, where all of the subdural electrodes in these patients were located, these findings demonstrate delay-period gamma activity increases occurring near to and correlating with BOLD activity, a decrease in theta near to and correlating negatively with BOLD activity, and an increase in theta distally as confirmed by a shift in the overall power spectrum.
The correlations found between the amplitude of ECoG and fMRI activity are somewhat low, although not substantially different from the magnitudes reported in other comparisons in the human ECoG/fMRI literature. There are several physiological and methodological reasons that may account for the low correlations and small effect sizes we obtained. It has been reported recently using a delayed somatosensory discrimination task in monkeys (Jun et al., 2010) that spiking activity in prefrontal cortex neurons exhibits substantial heterogeneity suggestive of a highly distributed, not modularized, neural code for memory. This may substantially reduce the ability to find correspondence between hemodynamic and electrical measures of activity, especially when the resolution of each sums over several millimeters of cortex. The failure of the ECoG measures to account for a greater proportion of BOLD response variance could also be due to sampling of ECoG that is limited to the crown of the gyrus, whereas fMRI activity can and is often distributed along the crown as well as along the sulcus, and often is seen only within the sulcal depths. There are also inherent signal-to-noise ratio differences between the fMRI and ECoG methods, and in our study logistical and time constraints prevented patients from performing the same number of trials during fMRI than during subsequent ECoG recording. We also collected serial, not simultaneous, acquisition of fMRI and ECoG. While simultaneous acquisition of fMRI and intracranial EEG is feasible (Vulliemoz et al., 2010), and would likely increase correspondence between the two sets of results, the Sternberg task employed here is a short- not long-term memory task that all patients learned quickly and performed above chance on both testing days. Although we would expect minimal differences as a function of multiple repetitions between the acquisition days, we cannot rule out entirely that serial acquisition increased the variance in our data that is unaccounted for by our models.
We can only speculate from our findings about what the BOLD signal might mean in relation to electrophysiological changes during the delay periods of working memory delays. Two recent studies are notable in postulating about this relationship. First, it has been shown by a comparison of magnetic resonance spectroscopy and functional imaging that there is an inverse relationship between baseline GABA, an inhibitory neurotransmitter, and BOLD reactivity (Donahue et al., 2010). Separately, another recent set of experiments points to the role of increases in local neuronal processing, as opposed to increases in thalamocortical input, as being a substantial factor in driving the cortical hemodynamic response (Harris et al., 2010). One idea that could explain our findings is that relatively increased local cortical processing is required to maintain information in memory, especially since there is no ongoing sensory stimulation during the delay period to drive an increase in thalamocortical inputs. This increased local processing may manifest as relatively increased excitatory neuronal activity and decreased inhibitory activity. The increase in excitatory activity may result in a shift in the spectrum similar to what we have demonstrated, with relative increases in gamma amplitude and relative decreases in theta. The increased metabolic demands resulting from increased local neuronal processing may drive increases in blood flow, oxygen metabolism, and thereby increase the net BOLD response that we find during the delay period.
Our finding that BOLD responses are related to different changes in at least two components of the spectrum (gamma and theta), rather than changes arising from one spectral band, appears consistent with results of another group showing that the BOLD response is related to a spectral shift in relative power from low to higher frequencies (Rosa et al., 2010) possibly as a consequence of larger energy dissipation (Kilner et al., 2005). But results from a very a recent simultaneous EEG-fMRI study focusing on trial-by-trial variations could be interpreted as contradictory to the spectral shift hypothesis (Scheeringa et al., 2011). Our speculation of what may be happening physiologically to drive the BOLD and ECoG changes that we have found is admittedly simplistic because a thorough understanding of neurovascular coupling remains a topic of ongoing research and debate (Ekstrom, 2010; Vanzetta and Slovin, 2010), and regional differences in coupling could account for disparate correlations between EEG and BOLD among brain regions. Along these lines, another simultaneous EEG-BOLD study used the ELECTRA source model (Gonzalez Andino et al., 2005a; Gonzalez Andino et al., 2005b) to determine estimated local field potentials (eLFPs) between scalp EEG and fMRI obtained in the same healthy subjects (Martuzzi et al., 2009). This study of subjects during passive visual stimulation reports a correspondence between low frequency (<14 Hz) oscillations and fMRI activation, including lateral aspects of the frontal lobe, but also claims that the relationship between eLFP and BOLD signals varies both across frequencies and regions.
The negative relationship between BOLD-fMRI and theta band power is notable, especially since increases, not decreases, in cortical theta power have been found in several cognitive tasks that include response conflict (Cohen et al., 2008), working memory (Raghavachari et al., 2001; Sederberg et al., 2003), and virtual maze learning (Caplan et al., 2001; Kahana et al., 1999). These studies utilized EEG alone and do not compare EEG and fMRI changes in the same subjects. In our study, increased theta power did not occur near fMRI activity increases, nor did the amplitude of fMRI delay period activity increases covary positively with increased theta. Instead, we found a negative relationship between the magnitude of BOLD and cortical theta, which is not completely surprising when considered in the context of a recent report showing that an increase in frontal theta is correlated with a decrease in BOLD (Scheeringa et al., 2008). In that report, the increased theta corresponding to decreases in BOLD occurred predominately in medial frontal areas that were attributed to the default mode network. We found increased theta in cortical areas showing neither fMRI activity increases nor decreases, and so the conclusion cannot be drawn in our experiment that theta increases occur in areas influenced by default mode processing. Our task is also unlikely to trigger default mode processing because during the delay period, subjects are maintaining item information in working memory. Along these lines, a more recent EEG-BOLD study reports a lack of correlations between oscillatory EEG phenomena and BOLD in functional traditional working memory areas (Scheeringa et al., 2009). Another recent simultaneous scalp EEG-fMRI study of working memory found a negative BOLD correlation with theta and positive correlations at higher frequency bands, a strikingly similar pattern to our findings (Michels et al., 2010).
Our findings highlight how BOLD signals must be interpreted cautiously and in light of converging evidence obtained with other modalities like electrical and magnetic source imaging. If increases in BOLD responses during memory delay activity correspond primarily to relative increases in cortical gamma-band electrical activity and decreases in theta-band activity, then fMRI may not be sensitive to some frequency-specific electrophysiological changes such as those in areas of cortex that exhibit only increased theta activity or conjoint increases in both theta and gamma activity during delay periods. In the final analysis of the present study, we showed the ability to detect these other types of sustained oscillatory responses by analyzing all 397 implanted electrodes (excluding those with noise and overlaying epileptic regions) irrespective of the relationship to fMRI activity. The results of this analysis showed sustained delay period increases in theta (delay > baseline) in 28% of the electrodes, conjoint increases in theta and gamma in 24% of the electrodes, and increases in gamma in 11% of electrodes. Based on our comparative fMRI-ECoG analyses, it is only near the last group that showed increases in just the gamma band, and which comprised the smallest percentage of electrodes, where we would expect to find BOLD increases.
It has been reported in a visual stimulation study of alert monkeys that a comparison between the BOLD signal, LFPs, and multiunit activity reveals that the largest portion of the BOLD signal variance can be explained by an LFP range of 20-60 Hz (Goense and Logothetis, 2008). More recent visual stimulation studies find a similar pattern of gamma LFP-BOLD coupling (Lippert et al., 2010; Murayama et al., 2010) and build on the original report of LFP-BOLD coupling (Logothetis et al., 2001). Our primary finding includes this gamma band range where we found oscillatory increases during the delay period of a working memory task that correlated with the magnitude of the fMRI delay response. Our results are novel in that they are the first comparison of human ECoG and BOLD-fMRI data during the delay period of a working memory task, and they are significant in that they provided a basis for comparison of human working memory delay period fMRI results with electrophysiological results obtained in animals and other human intracranial EEG studies.
There are two other limitations of the present study. First, electrode coverage included mostly the left hemisphere frontal and temporal regions, with sparse coverage of parietal and occipital lobes, and no subcortical recordings from hippocampus or amygdala. Therefore, while the finding of a gamma band ECoG-BOLD relationship is not surprising, we cannot make statements about theta-BOLD coupling in other brain areas, like those reported in near the hippocampal complex in another study (Ekstrom et al., 2009). Second, the findings presented here are from epilepsy patients whose brain function has been shaped by years of epilepsy. Although all patients studied performed the working memory task well above chance levels, and we followed the standard convention of excluding electrodes overlaying brain tissue that was later resected in order to treat the epilepsy, caution must be taken in generalizing the findings to healthy human brains.
Conclusions
In summary, the results presented here indicate that cortical areas showing increased BOLD-fMRI activity during a working memory delay period – the period of time during which visual stimuli have disappeared and previously encoded information is being held in memory - are characterized by relative increases in the gamma band and relative decreases in the theta band of the intracranial cortical field potential.
Acknowledgments
We thank Vipulkumar S. Patel for help with collection of the MRI data, Nadeeka R. Dias for help with data analysis, and Christopher R. Conner for helpful discussions. We also thank Drs. Jeremy Slater, Giridhar Kalamangalam and Omotola Hope for referring the patients studied here for surgical intervention, and two anonymous reviewers for their helpful suggestions.
Funding: This project was funded by the Epilepsy Foundation, the Vivian L. Smith Foundation for Neurological Research, and R01DA026452. N.T. is supported in part by a K12 grant from the Center for Clinical and Translational Sciences, funded by grant number UL1RR024048 from the National Center for Research Resources. Partial funding for the purchase of the Philips 3T scanner used to collect the imaging data was provided by NIH S10 RR19186.
Footnotes
Author Contributions: Design (TME, FK, NT), Data Collection (TME, NT, MAD, TAP, FK), Data Analysis (TME, FK, KT), Writing (TME, FK)
Publisher's Disclaimer: This is a PDF file of an unedited manuscript that has been accepted for publication. As a service to our customers we are providing this early version of the manuscript. The manuscript will undergo copyediting, typesetting, and review of the resulting proof before it is published in its final citable form. Please note that during the production process errors may be discovered which could affect the content, and all legal disclaimers that apply to the journal pertain.
References
- Baier B, Karnath HO, Dieterich M, Birklein F, Heinze C, Muller NG. Keeping memory clear and stable--the contribution of human basal ganglia and prefrontal cortex to working memory. J Neurosci. 2010;30:9788–9792. doi: 10.1523/JNEUROSCI.1513-10.2010. [DOI] [PMC free article] [PubMed] [Google Scholar]
- Canolty RT, Soltani M, Dalal SS, Edwards E, Dronkers NF, Nagarajan SS, Kirsch HE, Barbaro NM, Knight RT. Spatiotemporal dynamics of word processing in the human brain. Front Neurosci. 2007;1:185–196. doi: 10.3389/neuro.01.1.1.014.2007. [DOI] [PMC free article] [PubMed] [Google Scholar]
- Caplan JB, Madsen JR, Raghavachari S, Kahana MJ. Distinct patterns of brain oscillations underlie two basic parameters of human maze learning. J Neurophysiol. 2001;86:368–380. doi: 10.1152/jn.2001.86.1.368. [DOI] [PubMed] [Google Scholar]
- Cohen MX, Ridderinkhof KR, Haupt S, Elger CE, Fell J. Medial frontal cortex and response conflict: evidence from human intracranial EEG and medial frontal cortex lesion. Brain Res. 2008;1238:127–142. doi: 10.1016/j.brainres.2008.07.114. [DOI] [PubMed] [Google Scholar]
- Cowen SL, McNaughton BL. Selective delay activity in the medial prefrontal cortex of the rat: contribution of sensorimotor information and contingency. J Neurophysiol. 2007;98:303–316. doi: 10.1152/jn.00150.2007. [DOI] [PMC free article] [PubMed] [Google Scholar]
- Cox RW. AFNI: software for analysis and visualization of functional magnetic resonance neuroimages. Comput Biomed Res. 1996;29:162–173. doi: 10.1006/cbmr.1996.0014. [DOI] [PubMed] [Google Scholar]
- Curtis CE, D'Esposito M. Persistent activity in the prefrontal cortex during working memory. Trends Cogn Sci. 2003;7:415–423. doi: 10.1016/s1364-6613(03)00197-9. [DOI] [PubMed] [Google Scholar]
- D'Esposito M, Aguirre GK, Zarahn E, Ballard D, Shin RK, Lease J. Functional MRI studies of spatial and nonspatial working memory. Brain Res Cogn Brain Res. 1998;7:1–13. doi: 10.1016/s0926-6410(98)00004-4. [DOI] [PubMed] [Google Scholar]
- Dale AM, Fischl B, Sereno MI. Cortical surface-based analysis. I. Segmentation and surface reconstruction. Neuroimage. 1999;9:179–194. doi: 10.1006/nimg.1998.0395. [DOI] [PubMed] [Google Scholar]
- Donahue MJ, Near J, Blicher JU, Jezzard P. Baseline GABA concentration and fMRI response. Neuroimage. 2010;53:392–398. doi: 10.1016/j.neuroimage.2010.07.017. [DOI] [PubMed] [Google Scholar]
- Ekstrom A. How and when the fMRI BOLD signal relates to underlying neural activity: the danger in dissociation. Brain Res Rev. 2010;62:233–244. doi: 10.1016/j.brainresrev.2009.12.004. [DOI] [PMC free article] [PubMed] [Google Scholar]
- Ekstrom A, Suthana N, Millett D, Fried I, Bookheimer S. Correlation between BOLD fMRI and theta-band local field potentials in the human hippocampal area. J Neurophysiol. 2009;101:2668–2678. doi: 10.1152/jn.91252.2008. [DOI] [PMC free article] [PubMed] [Google Scholar]
- Fischl B, Sereno MI, Dale AM. Cortical surface-based analysis. II: Inflation, flattening, and a surface-based coordinate system. Neuroimage. 1999;9:195–207. doi: 10.1006/nimg.1998.0396. [DOI] [PubMed] [Google Scholar]
- Fuentemilla L, Penny WD, Cashdollar N, Bunzeck N, Duzel E. Thetacoupled periodic replay in working memory. Curr Biol. 2010;20:606–612. doi: 10.1016/j.cub.2010.01.057. [DOI] [PMC free article] [PubMed] [Google Scholar]
- Fuster JM. Unit activity in prefrontal cortex during delayed-response performance: neuronal correlates of transient memory. J Neurophysiol. 1973;36:61–78. doi: 10.1152/jn.1973.36.1.61. [DOI] [PubMed] [Google Scholar]
- Goense JB, Logothetis NK. Neurophysiology of the BOLD fMRI signal in awake monkeys. Curr Biol. 2008;18:631–640. doi: 10.1016/j.cub.2008.03.054. [DOI] [PubMed] [Google Scholar]
- Gold JM, Hahn B, Zhang WW, Robinson BM, Kappenman ES, Beck VM, Luck SJ. Reduced capacity but spared precision and maintenance of working memory representations in schizophrenia. Arch Gen Psychiatry. 2010;67:570–577. doi: 10.1001/archgenpsychiatry.2010.65. [DOI] [PMC free article] [PubMed] [Google Scholar]
- Gonzalez Andino SL, Michel CM, Thut G, Landis T, Grave de Peralta R. Prediction of response speed by anticipatory high-frequency (gamma band) oscillations in the human brain. Hum Brain Mapp. 2005a;24:50–58. doi: 10.1002/hbm.20056. [DOI] [PMC free article] [PubMed] [Google Scholar]
- Gonzalez Andino SL, Murray MM, Foxe JJ, de Peralta Menendez RG. How single-trial electrical neuroimaging contributes to multisensory research. Exp Brain Res. 2005b;166:298–304. doi: 10.1007/s00221-005-2371-1. [DOI] [PubMed] [Google Scholar]
- Harris S, Jones M, Zheng Y, Berwick J. Does neural input or processing play a greater role in the magnitude of neuroimaging signals? Front Neuroenergetics. 2010;2 doi: 10.3389/fnene.2010.00015. [DOI] [PMC free article] [PubMed] [Google Scholar]
- Harrison SA, Tong F. Decoding reveals the contents of visual working memory in early visual areas. Nature. 2009;458:632–635. doi: 10.1038/nature07832. [DOI] [PMC free article] [PubMed] [Google Scholar]
- Henseler I, Falkai P, Gruber O. A systematic fMRI investigation of the brain systems subserving different working memory components in schizophrenia. Eur J Neurosci. 2009;30:693–702. doi: 10.1111/j.1460-9568.2009.06850.x. [DOI] [PubMed] [Google Scholar]
- Hernandez A, Nacher V, Luna R, Zainos A, Lemus L, Alvarez M, Vazquez Y, Camarillo L, Romo R. Decoding a perceptual decision process across cortex. Neuron. 2010;66:300–314. doi: 10.1016/j.neuron.2010.03.031. [DOI] [PubMed] [Google Scholar]
- Jun JK, Miller P, Hernandez A, Zainos A, Lemus L, Brody CD, Romo R. Heterogenous population coding of a short-term memory and decision task. J Neurosci. 2010;30:916–929. doi: 10.1523/JNEUROSCI.2062-09.2010. [DOI] [PMC free article] [PubMed] [Google Scholar]
- Kahana MJ, Sekuler R, Caplan JB, Kirschen M, Madsen JR. Human theta oscillations exhibit task dependence during virtual maze navigation. Nature. 1999;399:781–784. doi: 10.1038/21645. [DOI] [PubMed] [Google Scholar]
- Kilner JM, Mattout J, Henson R, Friston KJ. Hemodynamic correlates of EEG: a heuristic. Neuroimage. 2005;28:280–286. doi: 10.1016/j.neuroimage.2005.06.008. [DOI] [PubMed] [Google Scholar]
- Kojima S, Goldman-Rakic PS. Delay-related activity of prefrontal neurons in rhesus monkeys performing delayed response. Brain Res. 1982;248:43–49. doi: 10.1016/0006-8993(82)91145-3. [DOI] [PubMed] [Google Scholar]
- Kojima S, Goldman-Rakic PS. Functional analysis of spatially discriminative neurons in prefrontal cortex of rhesus monkey. Brain Res. 1984;291:229–240. doi: 10.1016/0006-8993(84)91255-1. [DOI] [PubMed] [Google Scholar]
- Koshino H, Kana RK, Keller TA, Cherkassky VL, Minshew NJ, Just MA. fMRI investigation of working memory for faces in autism: visual coding and underconnectivity with frontal areas. Cereb Cortex. 2008;18:289–300. doi: 10.1093/cercor/bhm054. [DOI] [PMC free article] [PubMed] [Google Scholar]
- Kubota K, Niki H. Prefrontal cortical unit activity and delayed alternation performance in monkeys. J Neurophysiol. 1971;34:337–347. doi: 10.1152/jn.1971.34.3.337. [DOI] [PubMed] [Google Scholar]
- Lewis SJ, Dove A, Robbins TW, Barker RA, Owen AM. Cognitive impairments in early Parkinson's disease are accompanied by reductions in activity in frontostriatal neural circuitry. J Neurosci. 2003;23:6351–6356. doi: 10.1523/JNEUROSCI.23-15-06351.2003. [DOI] [PMC free article] [PubMed] [Google Scholar]
- Lippert MT, Steudel T, Ohl F, Logothetis NK, Kayser C. Coupling of neural activity and fMRI-BOLD in the motion area MT. Magn Reson Imaging. 2010 doi: 10.1016/j.mri.2009.12.028. [DOI] [PubMed] [Google Scholar]
- Logothetis NK. The neural basis of the blood-oxygen-level-dependent functional magnetic resonance imaging signal. Philos Trans R Soc Lond B Biol Sci. 2002;357:1003–1037. doi: 10.1098/rstb.2002.1114. [DOI] [PMC free article] [PubMed] [Google Scholar]
- Logothetis NK, Pauls J, Augath M, Trinath T, Oeltermann A. Neurophysiological investigation of the basis of the fMRI signal. Nature. 2001;412:150–157. doi: 10.1038/35084005. [DOI] [PubMed] [Google Scholar]
- Martuzzi R, Murray MM, Meuli RA, Thiran JP, Maeder PP, Michel CM, Grave de Peralta Menendez R, Gonzalez Andino SL. Methods for determining frequency- and region-dependent relationships between estimated LFPs and BOLD responses in humans. J Neurophysiol. 2009;101:491–502. doi: 10.1152/jn.90335.2008. [DOI] [PubMed] [Google Scholar]
- Meltzer JA, Zaveri HP, Goncharova II, Distasio MM, Papademetris X, Spencer SS, Spencer DD, Constable RT. Effects of working memory load on oscillatory power in human intracranial EEG. Cereb Cortex. 2008;18:1843–1855. doi: 10.1093/cercor/bhm213. [DOI] [PMC free article] [PubMed] [Google Scholar]
- Michels L, Bucher K, Luchinger R, Klaver P, Martin E, Jeanmonod D, Brandeis D. Simultaneous EEG-fMRI during a working memory task: modulations in low and high frequency bands. PLoS One. 2010;5:e10298. doi: 10.1371/journal.pone.0010298. [DOI] [PMC free article] [PubMed] [Google Scholar]
- Murayama Y, Biebetamann F, Meinecke FC, Muller KR, Augath M, Oeltermann A, Logothetis NK. Relationship between neural and hemodynamic signals during spontaneous activity studied with temporal kernel CCA. Magn Reson Imaging. 2010 doi: 10.1016/j.mri.2009.12.016. [DOI] [PubMed] [Google Scholar]
- O'Hearn K, Asato M, Ordaz S, Luna B. Neurodevelopment and executive function in autism. Dev Psychopathol. 2008;20:1103–1132. doi: 10.1017/S0954579408000527. [DOI] [PubMed] [Google Scholar]
- Quintana J, Fuster JM, Yajeya J. Effects of cooling parietal cortex on prefrontal units in delay tasks. Brain Res. 1989;503:100–110. doi: 10.1016/0006-8993(89)91709-5. [DOI] [PubMed] [Google Scholar]
- Quintana J, Yajeya J, Fuster JM. Prefrontal representation of stimulus attributes during delay tasks. I. Unit activity in cross-temporal integration of sensory and sensory-motor information. Brain Res. 1988;474:211–221. doi: 10.1016/0006-8993(88)90436-2. [DOI] [PubMed] [Google Scholar]
- Raghavachari S, Kahana MJ, Rizzuto DS, Caplan JB, Kirschen MP, Bourgeois B, Madsen JR, Lisman JE. Gating of human theta oscillations by a working memory task. J Neurosci. 2001;21:3175–3183. doi: 10.1523/JNEUROSCI.21-09-03175.2001. [DOI] [PMC free article] [PubMed] [Google Scholar]
- Rosa MJ, Kilner J, Blankenburg F, Josephs O, Penny W. Estimating the transfer function from neuronal activity to BOLD using simultaneous EEG-fMRI. Neuroimage. 2010;49:1496–1509. doi: 10.1016/j.neuroimage.2009.09.011. [DOI] [PMC free article] [PubMed] [Google Scholar]
- Scheeringa R, Bastiaansen MC, Petersson KM, Oostenveld R, Norris DG, Hagoort P. Frontal theta EEG activity correlates negatively with the default mode network in resting state. Int J Psychophysiol. 2008;67:242–251. doi: 10.1016/j.ijpsycho.2007.05.017. [DOI] [PubMed] [Google Scholar]
- Scheeringa R, Fries P, Petersson KM, Oostenveld R, Grothe I, Norris DG, Hagoort P, Bastiaansen MC. Neural dynamics underlying high- and low-frequency EEG oscillations contribute independently to the human BOLD signal. Neuron. 2011;69:572–583. doi: 10.1016/j.neuron.2010.11.044. [DOI] [PubMed] [Google Scholar]
- Scheeringa R, Petersson KM, Oostenveld R, Norris DG, Hagoort P, Bastiaansen MC. Trial-by-trial coupling between EEG and BOLD identifies networks related to alpha and theta EEG power increases during working memory maintenance. Neuroimage. 2009;44:1224–1238. doi: 10.1016/j.neuroimage.2008.08.041. [DOI] [PubMed] [Google Scholar]
- Sederberg PB, Kahana MJ, Howard MW, Donner EJ, Madsen JR. Theta and gamma oscillations during encoding predict subsequent recall. J Neurosci. 2003;23:10809–10814. doi: 10.1523/JNEUROSCI.23-34-10809.2003. [DOI] [PMC free article] [PubMed] [Google Scholar]
- Swann N, Tandon N, Canolty R, Ellmore TM, McEvoy LK, Dreyer S, DiSano M, Aron AR. Intracranial EEG reveals a time- and frequency-specific role for the right inferior frontal gyrus and primary motor cortex in stopping initiated responses. J Neurosci. 2009;29:12675–12685. doi: 10.1523/JNEUROSCI.3359-09.2009. [DOI] [PMC free article] [PubMed] [Google Scholar]
- Tertel K, Tandon N, Ellmore TM. Probing brain connectivity by combined analysis of diffusion MRI tractography and electrocorticography. Comput Biol Med. 2010 doi: 10.1016/j.compbiomed.2010.11.004. [DOI] [PMC free article] [PubMed] [Google Scholar]
- Vanzetta I, Slovin H. A BOLD Assumption. Front Neuroenergetics. 2010;2 doi: 10.3389/fnene.2010.00024. [DOI] [PMC free article] [PubMed] [Google Scholar]
- Vulliemoz S, Carmichael DW, Rosenkranz K, Diehl B, Rodionov R, Walker MC, McEvoy AW, Lemieux L. Simultaneous intracranial EEG and fMRI of interictal epileptic discharges in humans. Neuroimage. 2010;54:182–190. doi: 10.1016/j.neuroimage.2010.08.004. [DOI] [PubMed] [Google Scholar]
- Watanabe M, Hikosaka K, Sakagami M, Shirakawa S. Functional significance of delay-period activity of primate prefrontal neurons in relation to spatial working memory and reward/omission-of-reward expectancy. Exp Brain Res. 2005;166:263–276. doi: 10.1007/s00221-005-2358-y. [DOI] [PubMed] [Google Scholar]
- Yajeya J, Quintana J, Fuster JM. Prefrontal representation of stimulus attributes during delay tasks. II. The role of behavioral significance. Brain Res. 1988;474:222–230. doi: 10.1016/0006-8993(88)90437-4. [DOI] [PubMed] [Google Scholar]
- Yee LT, Roe K, Courtney SM. Selective involvement of superior frontal cortex during working memory for shapes. J Neurophysiol. 2010;103:557–563. doi: 10.1152/jn.91299.2008. [DOI] [PMC free article] [PubMed] [Google Scholar]
- Yoon JH, Curtis CE, D'Esposito M. Differential effects of distraction during working memory on delay-period activity in the prefrontal cortex and the visual association cortex. Neuroimage. 2006;29:1117–1126. doi: 10.1016/j.neuroimage.2005.08.024. [DOI] [PubMed] [Google Scholar]