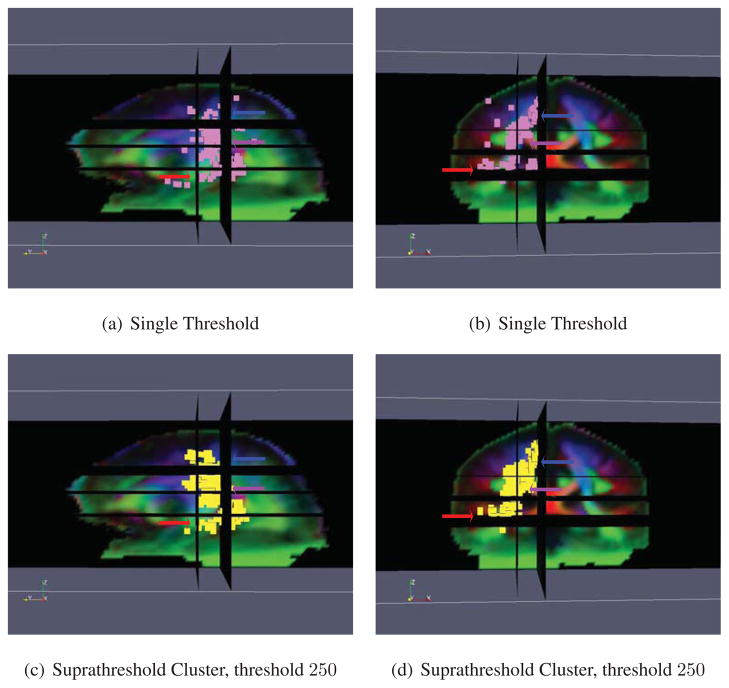
Figure 14.
Results of performing the ODF Riemannian statistical test on brain asymmetry. Figs. 14(a) and 14(c) show the sagittal view and Figs. 14(b) and 14(d) the coronal view. The pink voxels in Figs. 14(a) and 14(b) are deemed significant by the single threshold test and the yellow voxels in Figs. 14(c) and 14(d) are deemed significant by the suprathreshold cluster test. The red arrow shows the planum temporale, the purple arrow the internal capsule, and the blue arrow the corticospinal tract.

