Abstract
Of the two pathways through which we hear, air conduction (AC) and bone conduction (BC), the fundamental mechanisms of the BC pathway remain poorly understood, despite their clinical significance. A finite element model of a human middle ear and cochlea was developed to gain insight into the mechanisms of BC hearing. The characteristics of various cochlear response quantities, including the basilar membrane (BM) vibration, oval-window (OW) and round-window (RW) volume velocities, and cochlear fluid pressures were examined for BC as well as AC excitations. These responses were tuned and validated against available experimental data from the literature. BC excitations were simulated in the form of rigid body vibrations of the surrounding bony structures in the x, y, and z orthogonal directions. The results show that the BM vibration characteristics are essentially invariant regardless of whether the excitation is via BC, independent of excitation direction, or via AC. This at first appeared surprising because the cochlear fluid pressures differ considerably depending on the excitation mode. Analysis reveals that the BM vibration responds only to the lower-magnitude anti-symmetric slow-wave cochlear fluid pressure component and not to the symmetric fast-wave pressure component, which dominates the magnitude of the total pressure field. This anti-symmetric fluid pressure is produced by the anti-symmetric component of the window volume velocities. As a result, the BM is effectively driven by the anti-symmetric component of the OW and RW volume velocities, irrespective of the type of excitation. Middle ear modifications that alter the anti-symmetric component of the OW and RW volume velocities corroborate this assertion. The current results provide further clarification of the mechanisms underlying Békésy’s “paradoxical motion” concept.
Keywords: basilar-membrane velocity, cochlear fluid pressure, oval- and round-window volume velocities, anti-symmetric component, symmetric component
Introduction
A majority of studies (Békésy 1947, 1948, 1955; Peterson and Bogert 1950; Sondhi 1978; Olson 1998, 2001; Yoon et al. 2007) in the past have been concerned with how sound waves are transferred to the basilar membrane (BM) via the air conduction (AC) pathway. Through a series of such studies, it was discovered that the fluid pressure in the scala vestibuli (SV) and scala tympani (ST) could be decomposed into a “fast wave”, also known as the “symmetric wave”, and a “slow wave”, also known as the “anti-symmetric wave”, for AC stimulation.
In contrast, studies of sound wave transmission to the BM via the bone conduction (BC) pathway have been limited both in number and extent. Tonndorf (1962) proposed that the traveling wave must always commence in the basal portion of the cochlea and progress toward the apex, not only when the signal was originally applied in that region, but also when the pressure alteration was applied over the entire shell of the two scalae by compressional BC. Stenfelt et al. (2003, 2004) examined BM motion and volume displacement at the oval window (OW) and the round window (RW) for both AC and BC using temporal bone experiments. Recently, Böhnke and Arnold (2006) and Taschke and Hudde (2006) studied BC hearing with a 3-D finite element (FE) cochlear model based on micro-tomographic images. While they showed traveling wave propagation in the model for BC stimulation, the basic mechanisms for the BC pathway were not elucidated. In summary, most previous studies on BC hearing were rather limited in scope and depth of analysis, and did not provide sufficient insight into the fundamental mechanics of the BC hearing pathway.
The goal of this study is to provide greater insights into the fundamental characteristics of the BM vibration responses to different excitations. In order to do so, we developed a 3-D FE human ear model consisting of the middle ear and cochlea, and analyzed its response characteristics with respect to both BC and AC excitations. Then the detailed response characteristics of the model are examined by observing key dynamic quantities such as BM vibration patterns, cochlear fluid pressures, and OW and RW volume velocities, in response to both BC and AC excitations. Furthermore, symmetric and anti-symmetric components of both the cochlear fluid pressures and the window volume velocities were calculated, since those were previously shown to be significant factors explaining the drive mechanism of cochlear responses to AC excitation (Peterson and Bogert 1950; Olson 2001; Puria and Steele 2008).
It is noted that BC excitation has multiple components (Stenfelt and Goode 2005), and in this study we limit our analysis to its inertial components. Furthermore, the present study does not consider the active cochlear amplification mechanisms (i.e., Ren 2005; Shera 2007; Liu and Neely 2010). This is appropriate, however, for the current study where the FE model results are compared with the data obtained from human cadaver ear experiments.
Methods
The middle ear and cochlear finite element model
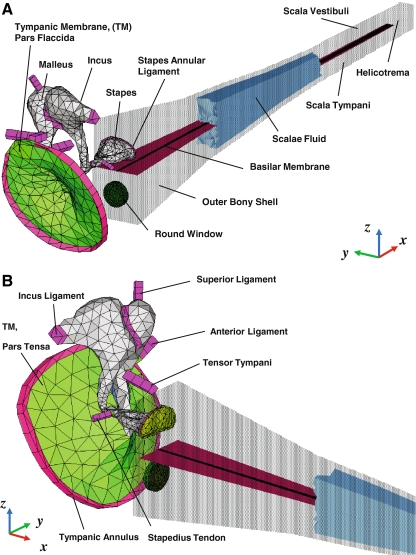
An acoustic structure fluid-coupled FE simulation was performed using the FE simulation software ACTRAN (Free field Technologies, Belgium), which was developed specifically for analyzing vibro-acoustic problems. Figure 1 shows the FE model of the human auditory periphery, consisting of the middle ear and the cochlea. The FE middle ear consists of the tympanic membrane (TM), ossicles (malleus, incus, and stapes), ligaments, and tendons. This middle ear model has been developed and reported previously (Homma et al. 2009, 2010). In this study, the cochlea was modeled as an uncoiled, two-chambered, fluid-filled duct, although the actual human cochlea has a spiral form with two and a half turns and consists of three fluid-filled channels: the SV, ST, and scala media (SM). This simplification has been commonly accepted for the study of cochlear mechanics using mathematical, FE and physical models (e.g., Allen and Sondhi 1979; de Boer 1981; Neely 1981; Steele and Lim 1999; Wittbrodt et al. 2006). The SV and ST are separated by the cochlear partition, which consists of the BM and the organ of Corti, and which for the purposes of our passive model we refer to as the BM. The BM, located between the osseous spiral lamina and the spiral ligament, varies in width as well as in thickness, and gives rise to the frequency-to-place mapping of the cochlea. The fluid in the SV is continuous with that of the ST through the helicotrema opening at the apical end.
FIG. 1.
A–B A FE model of the human auditory periphery consisting of middle ear structures and a simplified uncoiled cochlea. A posterior-medial view, B anterior-medial view. The air volumes of the ear canal and middle ear cavity are not included in the model. The walls and the scalae fluid in the cochlea have been shown here as partially transparent to allow visualization of the basilar membrane.
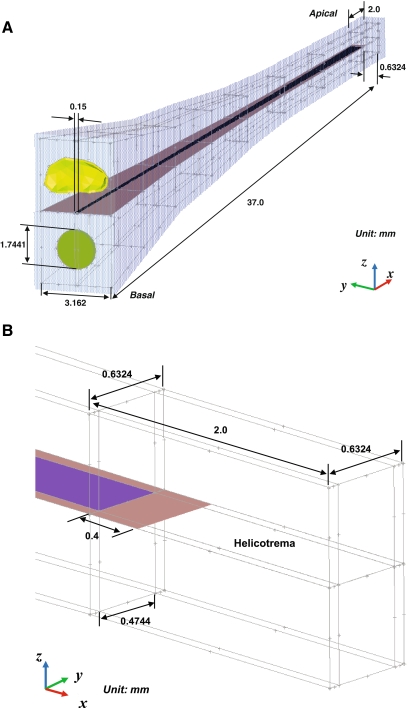
Model geometry and FE mesh As discussed previously (Homma et al. 2009, 2010), the geometries of the middle ear ossicles and the TM were constructed based on micro-CT imaging data from human-cadaver temporal bone middle ear specimens (Sim et al. 2007; Sim and Puria 2008). The geometry of the cochlear model was based on dimensions published in the literature (Thorne et al. 1999) similar to the actual curved geometry of the cochlea, including the OW, RW, SV, ST, and BM. Figure 2 shows the structure of the cochlear model with detailed dimensions and boundary conditions. The transparent light blue structure in Figure 2(A) indicates the outer bony shell surrounding the cochlea. In the cochlear model, the effect of the SM chamber was not considered and the micromechanical structure of the organ of Corti was also not included. A FE mesh model was created using the FE pre/post processing software HyperMesh (Altair Engineering, Troy, MI, USA). The stapes was attached to the cochlea through the stapes annular ligament, and the nodes along the perimeter of the stapes annular ligament were fixed to the cochlear bony shell. In the cochlea, the BM dimensions changed linearly in width from 150 μm at the base to 474 μm at the apex, and the thickness changed from 5.2 μm at the base to 0.6 μm at the apex (Wever 1947). The BM was meshed with 14,000 eight-noded hexahedral solid shell elements, BM supports were meshed with 13,687 six-noded pentahedral elements, and the RW was meshed with 1,719 six-noded pentahedral elements. The nodes along the perimeter of the RW were fixed. The SV and ST cochlear fluid volumes were 90.8463 and 91.2044 mm3, respectively. These two fluid chambers were meshed with 222,350 four-noded linear tetrahedral elements. The thickness of the bony shell, the rigid structure of the cochlea, was assumed to be 0.2 mm.
FIG. 2.
A-B Anatomical cochlear dimensions. A overall posterior-medial view, B enlarged view of the helicotrema in the apical region.
Material properties Material properties used for the middle ear structures of the FE model were reported previously (Homma et al. 2010). Material properties used for cochlear structures include density, Young’s modulus, and Poisson’s ratio. The density of rigid structures of the cochlea, such as the bony shell and BM supports, were assumed to be 5,400 kg/m3, the Poisson’s ratio, ν, was set to 0.3, and the Young’s modulus was set to 2.1 peta Pa (2.1 × 10¹⁵ Pa) to represent the rigid body. The density of the RW was set to 2,000 kg/m3, the Poisson’s ratio was set to 0.3, and the Young’s modulus was set to 0.07 MPa with an 0.857 loss factor, η. The stiffness of the BM varies along its length from the base to apex (Emadi et al. 2003; Naidu and Mountain 2007). In this study, we divided the BM into 14 equi-length sections. In order to model the stiffness change, the Young’s modulus of the BM gradually decreased from the base to the apex. The Young’s modulus of the BM was based on isotropic material properties. To represent the effect of the BM fibers in the transverse direction, we increased the y directional Young’s modulus (E22) and yz directional shear modulus (G23) to convert the isotropic material properties into orthotropic properties with an 0.3 loss factor (η). The exact values of six independent variables (E11, E22, E33, G12, G13, and G23) for orthotropic material properties were determined by tuning the resulting best-frequency-to-place cochlear map with that reported by Greenwood (1990). During the tuning process, the stiffness matrix of the Young’s modulus of the BM was tested for the property of positive definiteness to avoid physically unreasonable values. To satisfy the positive definiteness for the orthotropic material, the values and equations for the six independent variables were constrained according to elasticity theory (Sadd 2005) as:
 |
1 |
where Cij are elements of the stiffness matrix. Table 1 summarizes the BM mechanical properties used in this study. The cochlear fluid inside the SV and ST was assumed to have a density of 1,000 kg/m3. The speed of sound in this fluid was 1,500 m/s, which is equivalent to having a bulk modulus of water. Furthermore, in an attempt to introduce viscous losses in the fluid, a loss factor of 0.1 was introduced to the fluid, making the speed of sound in the fluid {1,500 + 150i} m/s. However, it should be noted that simply adding a loss factor to the fluid does not add significant damping at the BM. The effects of shear viscosity at the interfaces between solids and viscous fluids are not captured by the standard acoustic fluid elements available in the present FE software. The implication of this deficiency is discussed in a later section.
TABLE 1.
Material properties of the 14 equi-length (2.5 mm) BM sections in the cochlear model
| Distance from base (mm) | E11 (MPa) | E22 (MPa) | E33 (MPa) | ν12 | ν13 | G12 (MPa) | G13 (MPa) | G23 (MPa) |
|---|---|---|---|---|---|---|---|---|
| 0–2.5 | 28.240 | 325.90 | 28.240 | 0.025995 | 0.41743 | 9.9615 | 9.9615 | 309.96 |
| 2.5–5 | 28.233 | 315.90 | 28.233 | 0.026812 | 0.41708 | 9.5769 | 9.5769 | 299.96 |
| 5–7.5 | 28.225 | 305.90 | 28.225 | 0.027681 | 0.41671 | 9.1923 | 9.1923 | 289.96 |
| 7.5–10 | 28.217 | 295.90 | 28.217 | 0.028608 | 0.41631 | 8.8077 | 8.8077 | 279.96 |
| 10–12.5 | 28.209 | 285.90 | 28.209 | 0.0296 | 0.41589 | 8.4231 | 8.4231 | 269.96 |
| 12.5–15 | 28.200 | 275.90 | 28.200 | 0.030663 | 0.41543 | 8.0385 | 8.0385 | 259.96 |
| 15–17.5 | 28.190 | 265.90 | 28.190 | 0.031805 | 0.41494 | 7.6538 | 7.6538 | 249.96 |
| 17.5–20 | 28.179 | 255.90 | 28.179 | 0.033036 | 0.41441 | 7.2692 | 7.2692 | 239.96 |
| 20–22.5 | 28.168 | 245.90 | 28.168 | 0.034365 | 0.41384 | 6.8846 | 6.8846 | 229.96 |
| 22.5–25 | 28.156 | 235.90 | 28.156 | 0.035806 | 0.41323 | 6.5000 | 6.5000 | 219.96 |
| 25–27.5 | 28.142 | 225.90 | 28.142 | 0.037374 | 0.41255 | 6.1154 | 6.1154 | 209.96 |
| 27.5–30 | 28.128 | 215.90 | 28.128 | 0.039085 | 0.41182 | 5.7308 | 5.7308 | 199.96 |
| 30–32.5 | 28.112 | 205.90 | 28.112 | 0.040959 | 0.41102 | 5.3462 | 5.3462 | 189.96 |
| 32.5–35 | 27.880 | 122.90 | 27.880 | 0.068056 | 0.3994 | 4.9615 | 4.9615 | 106.96 |
Structural loss factors, η, of 0.3 are assumed for both axial modulus values, Eii, and shear modulus values, Gij. The Poisson’s ratio, νij, is determined from Eii and Gij. Note that ν23 = 0.3 for the every BM section
AC and BC excitation simulation AC excitations were simulated by assigning a uniformly distributed dynamic unit pressure over the TM surface on the ear canal side. Fixed displacement boundary conditions were applied to boundaries of the structure, such as the ends of the ligaments and tendons, the edge of the tympanic annulus, the BM support, and the bony shell of the cochlea. On the other hand, inertial BC excitations were simulated by assigning the same displacement vectors (both magnitude and phase) at the boundaries. These include the cochlea and the ends of the middle ear supporting structures such as the incus ligament, tensor tympani, anterior ligament, lateral ligament, stapedius tendon, and tympanic annulus. This effectively represented the rigid body vibrations of the temporal bone structure that surrounds the auditory periphery. The rigid body BC excitations were simulated in the direction of the three orthogonal axes: x (longitudinal direction to the BM), y (transverse or radial direction to the BM), and z (normal to the BM). The magnitude of the applied displacement vector, vb, was 0.01 μm for x, y, and z directional vibrations.
Model variables The response characteristics of the auditory periphery to both AC and BC excitations were determined based on various dynamic quantities of the model. Table 2 summarizes these dynamic quantities of interest in the present study. As explained in the previous section, the ear canal pressure, pEC, and the base bone vibration vector, vb, represent AC and BC excitations, respectively. From the perspective of the middle ear and cochlea with inputs and outputs, these AC and BC excitations are considered as inputs to the system. The ultimate system output variable for the present study is then the BM vibration velocity, vBM(x), along the length of the BM. The rest of the quantities, considered as the proximate variables, are internal to the system. The cochlear fluid pressures, pSV(x) and pST(x), were observed along the entire length (every 1 mm over the 35 mm from base to apex) of the BM near the surface of the BM (with a slight stand-off distance of 0.1 mm from the BM surface). Probes used to measure cochlear pressure operated by integrating the pressure field over an area corresponding the probe’s diaphragm area. Preliminary measurements indicate that the pressure averaged over an area does not differ significantly from the single-point measurements. This is due to the long wavelengths of the stimulus in relation to the diameter of the probe. The variables pOW and pRW represent the pressures near the OW and RW, which are obtained at 0.1 mm behind the center of the OW and RW in the fluid, respectively. It should be noted that pOW and pRW are often designated in the literature as pSV and pST (Merchant et al. 1996; Puria et al. 1997; Aibara et al. 2001; Gan et al. 2007; Nakajima et al. 2009), which should be distinguished from the variables pSV(x) and pST(x) here, which are observed near the surface of the BM along the BM length in this study.Volume velocities at the OW and RW are represented by UOW and URW, respectively. These were calculated from the FE results by integrating the individual volume-displacement contributions from each of the triangular elements on the OW and RW surfaces. This is expressed as
 |
2 |
where A is the surface area of the ith element and jω is the imaginary radial frequency. The normal component of the mean displacement of the element,  , is given by
 |
3 |
where d1, d2, and d3 are the complex displacement vectors at the three edge nodes of the triangular element, and n is the unit normal vector.BM velocity, vBM(x), was obtained at the center line of the BM along the whole length (every 1 mm over the 35 mm from base to apex) in the direction normal to the BM surface. It should be noted that the BM velocities for BC were obtained by calculating a differential velocity, ΔvBM, between the BM velocity (normal to the BM surface) and the base bone vibration (the velocity of the surrounding bone structure):
 |
4 |
where, vb∙n is the component of the bone vibration velocity in the direction normal to the BM surface. The differential BM velocity, ΔvBM, in the BC response is equivalent to the absolute velocity, vBM, in the AC response, with the only difference being that the bone velocity is zero for AC. In the discussion that follows, the BM velocity for BC is obtained by the differential velocity calculation.
TABLE 2.
Description of dynamic quantities for the present study
| pEC | Ear canal pressure applied at the TM |
| pOW | Fluid acoustic pressure at the OW |
| pRW | Fluid acoustic pressure at the RW |
| UOW | Volume velocity at the OW |
| URW | Volume velocity at the RW |
| pSV(x) | Fluid acoustic pressure over the SV side (0.1 mm) of the BM surface at the BM location x |
| pST(x) | Fluid acoustic pressure over the ST side (0.1 mm) of the BM surface at the BM location x |
| vBM(x) | BM vibration velocity at the BM location x |
| vb | BC excitation, which is represented as the velocity vector of the surrounding bone structure |
Decomposition analysis
To obtain insights into the characteristics of the BM responses corresponding to AC or BC excitations, an orthogonal decomposition technique was performed on the scalae fluid pressures, pSV and pST, and the window volume velocities, UOW and URW, which can be represented in vector formats as:
 |
5 |
Note that inward (toward the cochlea) movements of UOW and URW are defined as positive. These vector quantities can alternatively be described by the following transformed vectors:
 |
6 |
where Φ is an orthonormal transformation matrix. The components of the transformed vectors, p′ and U′, then are:
 |
7 |
where ps(x) and pa(x) are respective symmetric (i.e., in-phase) and anti-symmetric (i.e., out-of-phase or differential) components of the pressure vector, while Us and Ua are respective symmetric and anti-symmetric components of the volume velocity vector. This decomposition technique is equivalent to the method used by Peterson and Bogert (1950), who analyzed the scalae pressure in terms of “transverse” and “longitudinal” components, corresponding to the anti-symmetric and symmetric pressure components, respectively. These two components are also described as “slow” and “fast” waves, respectively, due to the difference in their wave speed. As discussed in Peterson and Bogert (1950), it is the “transverse” or “slow wave” component that introduces the pressure differential across the BM, which in turn forces the BM to vibrate. These fast and slow waves in the SV and ST were observed and confirmed by Olson’s measurements (1998, 2001). In addition, Puria and Steele (2008) summarized and explained properties of the waves in detail. It should be noted, however, that those analyses and explanations for the fast and slow waves did not extend this decomposition method to the volume velocities at the two windows, which plays a role in explaining the mechanics of bone conduction as discussed in this work.
Results
FE model validation
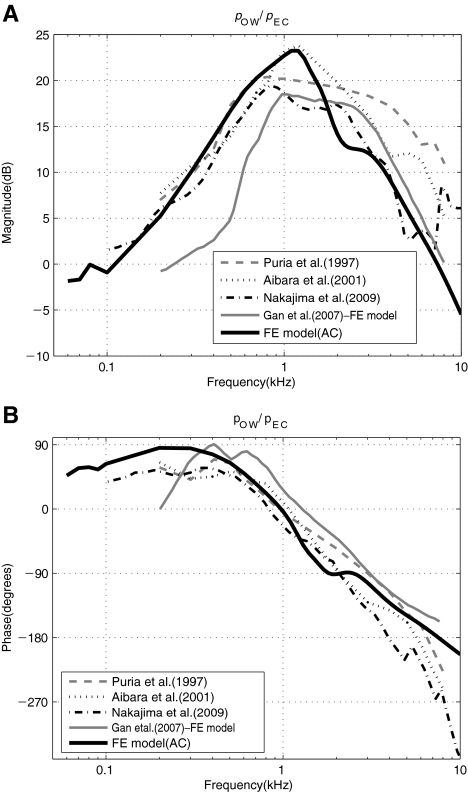
Middle ear pressure gain function The FE model developed in this study was tuned and validated first by comparing various simulated frequency responses with those from the published literature. Figure 3 shows the middle ear pressure gain function expressed as a ratio of the scalae pressure near the OW to the acoustic pressure at the TM, pOW/pEC, obtained from the FE model and from the experimental data from the literature (Puria et al. 1997; Aibara et al. 2001; Nakajima et al. 2009). The figure also shows a FE result from Gan et al. (2007), who also created a FE model for AC similar to that of the present study. The Gan et al. results are up to 5 dB lower than the others in magnitude below 1 kHz. Above 1 kHz, there are differences among the experimental results, with our model in closer agreement with the Nakajima et al. measurements.
FIG. 3.
A–B The ear canal pressure, pEC, to oval-window pressure, pOW, middle ear gain. A Magnitude in dB and B phase in degrees.
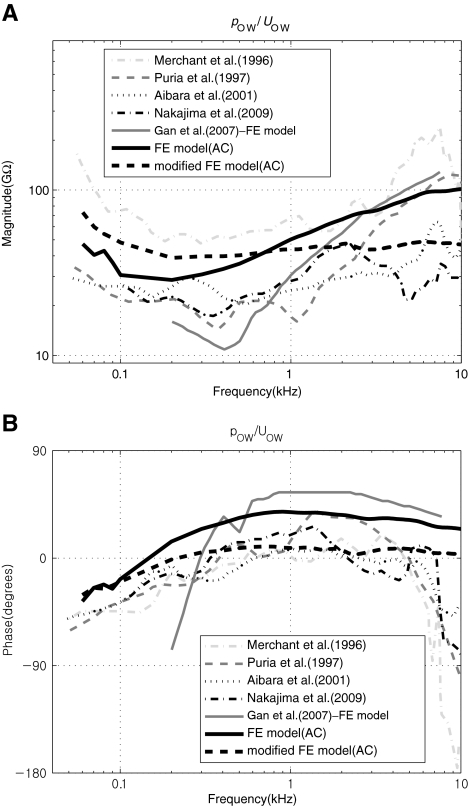
Cochlear input impedance Figure 4 shows the cochlear input impedance (the ratio of the scalae fluid pressure near the OW to the volume velocity of the OW, pOW/UOW) in the present model alongside comparisons to measured (Merchant et al. 1996; Puria et al. 1997; Aibara et al. 2001; Nakajima et al. 2009) or calculated (Gan et al. 2007) data. The figure shows that the FE results are in reasonable agreement with the published data in terms of overall response trends. However, it is observed that the simulated results exhibit less damping than the measured experimental data. In Figure 4, the thicker dashed lines labeled as “modified FE model” are for the case in which additional damping (30GΩ in resistance) was added behind the OW in the fluid. This was implemented by specifying the imaginary part of the complex Young’s modulus of the damping element to be linearly increasing with frequency, with a reference value of 1.74e5 at 1 kHz. As can be seen in the figure, the introduction of this hypothetical extra damping brings the simulated input impedance into better agreement with the experimental data. As was briefly mentioned in the previous section, this apparent damping deficiency is most likely caused by the lack of a shear viscous effect, which occurs locally at the fluid-contacting surfaces of the BM, but which is not accounted for in the current FE model. For the present study, however, the additional artificial damping element introduced to obtain the “modified FE model” result in Figure 4 was not used for the rest of the study since it does not critically affect the results or conclusions of the present study.
FIG. 4.
A–B Cochlear input impedance, pOW/UOW. A Magnitude in GΩ and B phase in degrees. The “modified” FE model is a hypothetical case in which extra damping (i.e., additional cochlear load) has been added to the stapes.
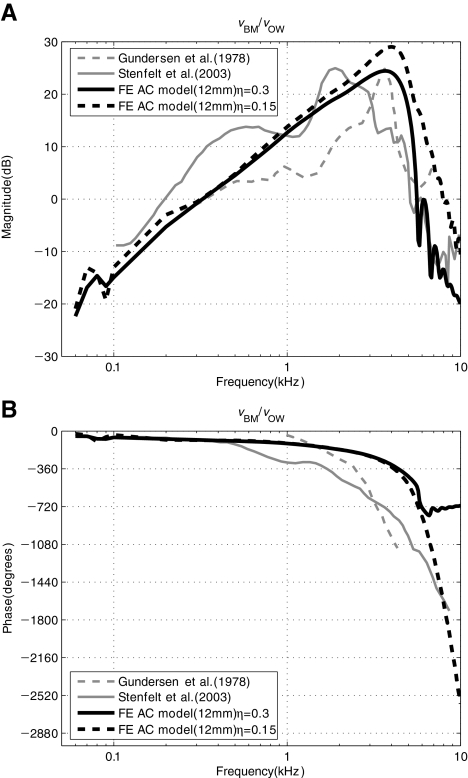
BM response: AC Figure 5 shows the simulated and measured AC response of the BM velocity, vBM, observed at a specific BM location (12 mm from the base) and normalized by the oval-window (i.e., stapes-footplate) velocity, vOW. The oval-window velocity, vOW, was obtained at the center point of the stapes footplate, in the direction normal to the footplate. The FE result in Figure 5 shows a reasonable agreement with the measured results from the literature in terms of the overall response characteristics. However, it should be noted that due to the simplified geometry of the current FE model, which is different from the more complex geometry of the actual cochlea, there is ambiguity in defining an exact BM location. This ambiguity in BM location definition may contribute to the observed differences, such as in the locations of the best-frequency (BF) magnitude peaks of the model and experimental data. In addition, the phase response of the FE model shows discrepancies with the experimental measurement responses in Figure 5(B). In the case of Stenfelt’s result, some errors in the measurement are suspected since the phase response does not show the steep decrease after BF (around 2 kHz) in spite of the existence of a traveling wave. On the other hand, the phase responses of both Gundersen et al. and our FE model show the steep decrease at the BF (around 3–4 kHz). However, since the frequency range of Gundersen et al. for the phase response is different (1–4 kHz) from that of our model (60 Hz–10 kHz), comparisons between the two results could be vulnerable to misinterpretation. It is also noted that the current FE model does not have sufficient fluid viscosity nor a high-enough BM orthotropic ratio in comparison with the real cochlea. To compensate for those factors, we increased the loss factor of the BM to 0.3. However, this high loss factor causes a phase discrepancy. In Figure 5(B), while the phase with the lower loss factor (η = 0.15, black dot line) shows a steep decrease, the phase with the high loss factor (η = 0.3, black solid line) shows a plateau after the BF region. However, the phase discrepancy above the BF position does not significantly affect the results or conclusions of this study. Therefore, we use the case with the high loss factor (η = 0.3) in the rest of the study.
FIG. 5.
A–B AC response of the BM velocity normalized by stapes-footplate velocity, vBM/vOW. The BM velocity was observed at x = 12 mm with two different BM loss factors (η = 0.15 or 0.3) for the FE results. The BM location for the experimental data by Stenfelt et al. (2003) was also reportedly at 12 mm from the RW. Stenfelt et al. (2003) also reported that Gundersen et al. (1978) had measured the BM velocity at a similar position.
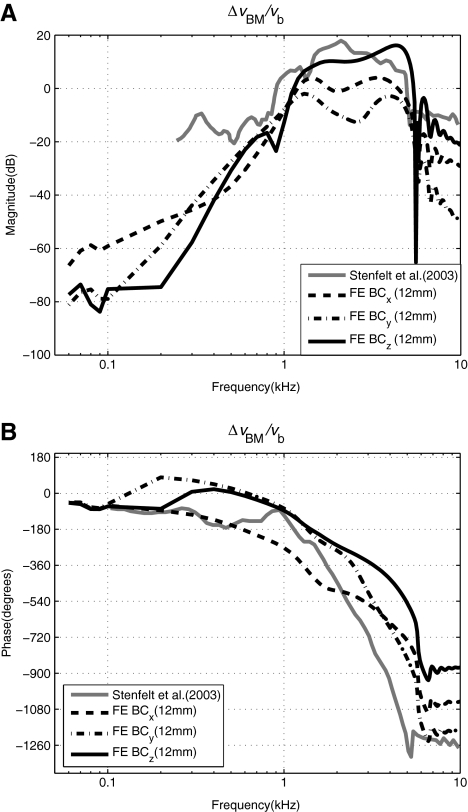
BM response: BC Figure 6 shows a comparison between the simulated and reported experimental data (Stenfelt et al. 2003) of the cochlear response with respect to BC excitation, which is expressed as the ratio of the differential BM velocity, ΔvBM, at 12 mm from the base, to the BC input bone velocity, vb. The results are shown for BC excitations given in the direction of the three orthogonal axes, x, y, and z. The direction of the BC vibration input for the data by Stenfelt et al. (2003) appears to be in the direction normal to the BM surface, thus similar to the z directional excitation in the model. However, considering the simplified geometry of the FE cochlea model, which is different from the coiled geometry of the actual cochlea, there is ambiguity in defining the direction of the BC vibration input. Despite this, the characteristics exhibited by the FE model, especially for the z directional BC vibration, are seen to be similar to those of the experimental data.
FIG. 6.
A–B Differential BM velocity normalized by the BC bone-velocity input, ΔvBM/vb, given for inputs in the direction of each of the three orthogonal axes, x, y, and z. The BM velocity was observed at x = 12 mm for the FE results. The BM location for the experimental data by Stenfelt et al. (2003) was also reportedly at 12 mm from the RW.
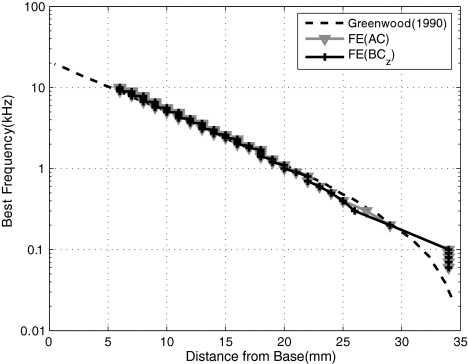
Cochlear map Figure 7 shows the FE-simulated BF cochlear map along with that obtained experimentally by Greenwood (1990). The BF map indicates the frequency corresponding to the peak BM vibration as a function of location along the BM. As shown in the figure, the BF map from the FE model is in good agreement with the data except for BFs below 200 Hz, which correspond to locations greater than x = 30 mm. This agreement with the BF map was a result of an iterative tuning of the elastic modulus values of the BM (see Table 1) for AC excitation. Once the tuning was done with AC excitation, the same BM elastic modulus values were used for all AC and BC cases. It is interesting to observe that the BF map does not change significantly due to differences in the method of cochlear excitation. The disagreement for BFs below 200 Hz is likely due to the use of a linear taper in the BM properties (Table 2) rather than an exponential taper (Puria and Allen 1991).
FIG. 7.
Simulated best-frequency (BF) map for AC and BC excitations given in the z direction, along with experimental data by Greenwood (1990). For BC excitations, the BF maps derived with x and y directional excitations were almost identical to that derived with z directional excitation.
Cochlear responses to BC and AC excitations
Having validated the FE model, the next step was to simulate and analyze the symmetric (fast wave) and anti-symmetric (slow wave) response characteristics due to excitations in the three orthogonal directions for BC and AC excitations.
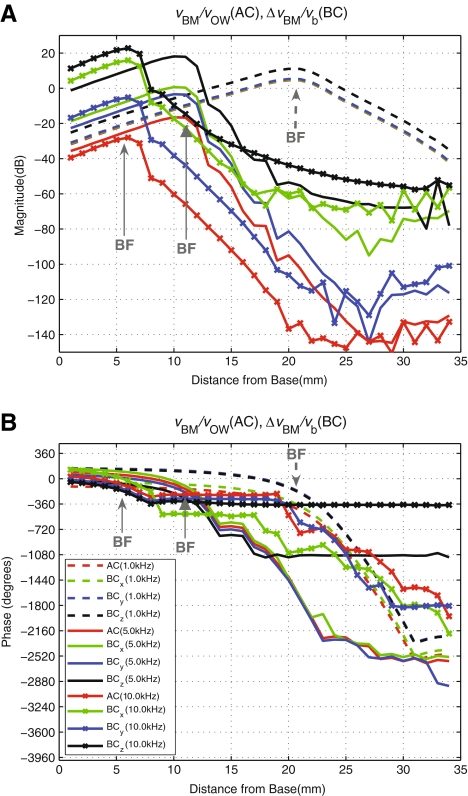
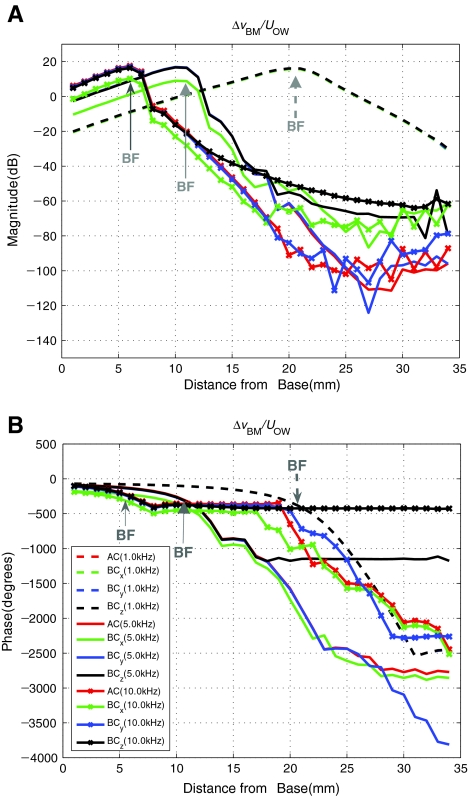
BM velocity responses to BC and AC excitations Figure 8 shows the simulated differential BM velocity distribution, ΔvBM(x), in response to BC excitations at the rigid boundary bone in the three orthogonal axis directions. The results are shown for three frequencies: 1, 5, and 10 kHz. The BC cases are normalized with respect to the rigid bone velocity magnitude, vb. The figure also shows the BM velocity profile, vBM(x), in response to AC excitation. The magnitude of the BM velocity for each AC case is normalized by the corresponding stapes velocity. Figure 8 shows that the overall shape of the BM velocity magnitude distributions for each respective frequency are similar among the different excitation cases, including between the BC excitations and the AC excitation. However, for 5 and 10 kHz at locations apical to 20 mm, the BC responses for drives in the x and z directions diverge from the y directional BC and the AC responses. The primary difference among the four cases, however, is the vertical shift in magnitude. Similarly, the phase response characteristics for all the cases are similar but slightly shifted, except for two cases (BCz for 5 and 10 kHz) where the phase diverges from the rest for BM locations past about 20 and 10 mm, respectively.
FIG. 8.
Magnitude (A) and Phase (B) of the differential BM velocity profile along the length of the BM, ΔvBM(x), normalized by the magnitude of the base bone velocity (BC excitation), vb, given in the directions of the three orthogonal axes (x, y, z) at 1, 5 and 10 kHz. This figure indicates the sensitivity of the cochlea in response to BC excitation in three directions. The BM velocity response to AC excitation (normalized by stapes velocity) is also shown for comparison. Note that AC, BCx, and BCy results at 10 kHz (red, green, and blue dotted lines, respectively) are overlapped in A. In addition, BCy and BCz phase results at 10 kHz (blue and black dotted lines, respectively) are also overlapped in B.
BM velocity normalized by OW volume velocity Figure 9 shows again the simulated differential BM velocity profile, ΔvBM(x), in response to BC excitations given in the three directions, but this time normalized by the OW volume velocity, UOW, instead of by the base bone velocity, vb. A corresponding response to the AC excitation normalized by UOW is also shown. Figure 9 shows that with the normalization of the differential BM velocity, ΔvBM(x), by the OW volume velocity, UOW, the differences among the four cases are reduced in comparison to Figure 8, to the extent that the results for 1 kHz are all aligned with one another for both magnitude and phase. However, the results for x directional excitation at 5 and 10 kHz still show some offsets in both magnitude and phase. In Figure 8, the magnitude differences at the BF (12 mm at 5 kHz and 6 mm at 10 kHz from the base) are 40 and 50 dB between AC excitation and BC z directional excitation, respectively. In Figure 9, on the other hand, the magnitude differences in the two cases are closer to 10 dB at the BF.
FIG. 9.
Same as Figure 8, but with OW volume velocity UOW used for normalization instead of the bone velocity vb. Note that the magnitude and phase differences among the four cases are now minimized in comparison to Figure 8. It is also noted that AC, BCx, BCy, and BCz results for 1 kHz are aligned with one another such that they appear to be one line. Similarly, AC, BCy, and BCz results at 5 and 10 kHz appear to be one line from the base to the BF position. In the case of AC, ΔvBM is equivalent to vBM since vb is zero.
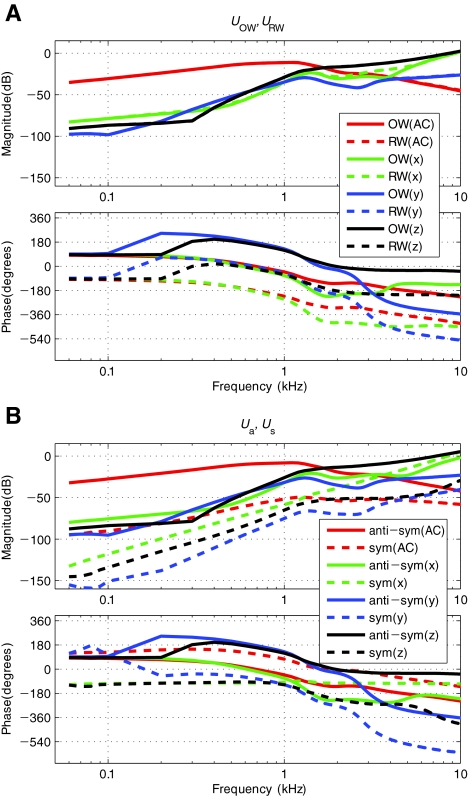
Decomposition of Volume Velocity Vectors In Figure 9, the BM velocity responses have been normalized by the OW volume velocity, UOW. This is based on a general understanding that the vibration input enters the cochlea through the OW. However, this concept is not complete, since there are circumstances in which the RW volume velocity, URW, might also matter. Only observing UOW would be sufficient in regular AC analysis where it is known that URW has the same magnitude as UOW but is 180° out-of-phase. However, this is not necessarily the case for BC (Stenfelt et al. 2003). Therefore, for BC, one has to observe both UOW and URW, which can be represented in the form of a vector, U, as introduced in Eq. 5. The transformation technique described earlier was applied to decompose the window volume velocities into symmetric and anti-symmetric components, Us and Ua. Figure 10 shows the magnitude responses of the volume velocities before the transformation, UOW and URW, and after the transformation, Us and Ua. As shown in Figure 10(A), the volume velocities at the two windows, UOW and URW, are equal in magnitude for the AC excitation case, and 180° out-of-phase, as expected. However, for BC excitations, UOW and URW are not necessarily equal in magnitude for all frequencies, as can be seen by the up to 10 dB difference in magnitude for the BC-response case with x directional input in the 2–5 kHz range. Figure 10(B) shows the corresponding symmetric and anti-symmetric volume velocities, Us and Ua. Here, the magnitude of the anti-symmetric component, Ua, is 40–60 dB larger than that of the symmetric component, Us, for AC below 1 kHz. For BC x, y, and z directional excitations, Ua is 20–50, 30–65, and 20–60 dB, respectively, larger than Us below 1 kHz. The magnitude gap for the most part becomes smaller above 1–2 kHz, for both AC and BC cases. Since Ua is always larger than Us, AC, BCy, and BCz results are consistent with the out-of-phase response relation between the two windows, UOW and URW. However, for the x directional BC excitation, it can be seen that the symmetric component, Us, approaches and eventually becomes larger in magnitude than the anti-symmetric component, Ua, at high frequencies. This is clearly related to the unmatched magnitudes between the two window volume velocities, UOW and URW, observed in Figure 10(A) for the corresponding BCx case. In other words, when the magnitude of Ua no longer dominates over that of Us, it results in the magnitudes of UOW and URW no longer being the same and their phase difference no longer being 180°.
FIG. 10.
A–B Volume velocities at the OW and RW in response to AC and BC excitations. A Window volume velocities, UOW and URW, and B corresponding anti-symmetrical and symmetrical components, Ua and Us. Note that the two window volume velocities, UOW and URW, are mostly equal in magnitude and thus the magnitude curves largely overlap one another, except for the case of the BC excitation with x directional input at high frequencies.
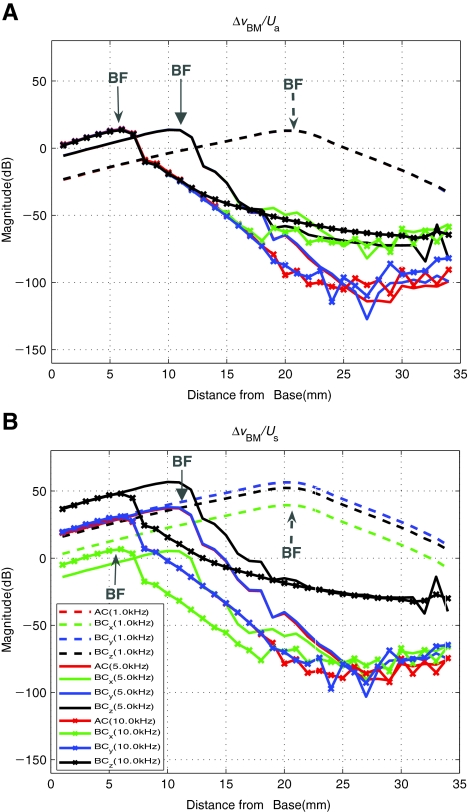
BM velocity normalized by anti-symmetric and symmetric volume–velocity components Figure 11 again shows the BM velocity distribution in response to both AC and BC excitations, but this time normalized by the anti-symmetric and the symmetric volume velocity components, Ua and Us, in Figure 11(A) and (B), respectively. Again, the results are shown for selected frequencies of 1, 5, and 10 kHz. It can be seen in Figure 11(A) that the results for the different excitation cases show even better alignment with each other when normalized by the anti-symmetric volume velocity component, Ua, in comparison with Figure 9, in which the results are normalized by the OW volume velocity, UOW, only. The results are aligned even for the 5 and 10 kHz cases, except for BM positions apical to the BF location by about 10 mm for 5 kHz (20 mm from the base) and 5 mm for 10 kHz (10 mm from the base), where the results start to diverge from one another, nearly 80 dB below the peak. In contrast, the results become further misaligned when normalized by the symmetric volume velocity component, Us. This shows that the anti-symmetric volume–velocity component, Ua, correlates with the BM vibration better than the OW volume velocity, UOW, and that there appears to be little correlation between the BM vibration and the symmetric volume velocity, Us. In terms of the magnitude of the normalized BM velocity, the case of normalization by Ua produces a peak that is 50 dB smaller than the case of normalization by Us. This is reasonable considering Figure 10, in which Ua can be seen to be approximately 20–40 dB larger than Us at 1 kHz.
FIG. 11.
A–B The differential BM velocity distributions along the length of the BM, ΔvBM(x), in response to AC and BC excitations for the frequencies 1, 5, and 10 kHz. The results are now normalized by A the anti-symmetric volume velocity (slow wave) component, Ua, and B the symmetric volume velocity (fast wave) component, Us. Compared with Figure 9, it can be seen in A that the results for the different excitation cases are in even better alignment with each other when normalized by the anti-symmetric volume velocity component, Ua. In contrast, the results are not well aligned when normalized by the symmetric volume velocity component, Us. Note that the AC, BCx, BCy, and BCz results in A are aligned with one another such that they seem to form the same line up to the BF location corresponding to the excitation frequency (1, 5, or 10 kHz).
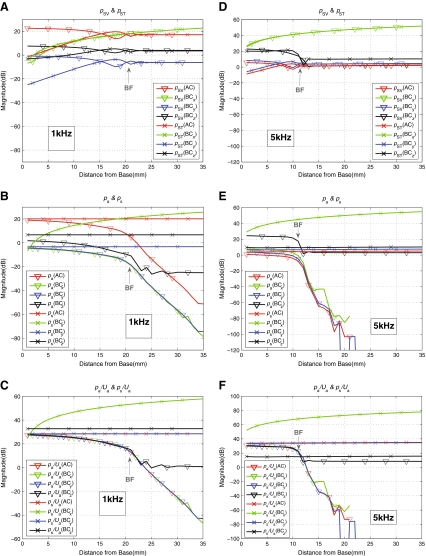
Decomposition of cochlear fluid pressure vectors Figure 12 shows the cochlear fluid pressure responses measured at 0.1 mm above and under the BM for the SV and ST along the BM length, respectively. The top figures, (A) and (D), show the SV and ST pressures, pSV(x) and pST(x), respectively, at 1 and 5 kHz. The middle figures, (B) and (E) show the corresponding anti-symmetric and symmetric pressure components, pa(x) and ps(x), respectively, for the two frequencies, as obtained by ortho-normal decomposition using Eq. 7. The bottom figures, (C) and (F), contain the anti-symmetric and symmetric pressure components, pa(x) and ps(x), normalized by the anti-symmetric volume velocity at the windows, Ua. Figure 12(A) and (D) show that, for AC excitation, the fluid pressure on the SV side of the BM, pSV(x), is larger than that on the ST side, pST(x), for BM locations basal to the BF location by 5 mm or more. At that location, the two pressure magnitudes cross one another and then become approximately equal to one other above the BF location (x = 21 mm for 1 kHz). Similar characteristics can also be observed for BC in the y and z directional input cases. The decomposed pressure plots shown in Figure 12(B) and (E) show that the symmetric pressure component, ps(x), tends to be equal to or greater than the anti-symmetric pressure component, pa(x). It can be seen that pa(x) tends to decrease in magnitude along the BM length from the base to the apex, while ps(x) tends to be constant (or to increase) in magnitude. The rate of magnitude decrease of pa(x) can be seen to increase above the BF location. An exception to this is the case for z directional BC excitation, where pa(x) becomes flat in magnitude in the BM region past the BF location. This pa(x) magnitude roll-off is qualitatively similar to the velocity roll-off characteristics at BM locations past BF for the BM velocity distributions, ΔvBM(x), seen in Figures 8, 9, and 11. On the other hand, there is little similarity in characteristics between ps(x) and ΔvBM(x).Figure 12(C) and (F) show the pressure components, pa(x) and ps(x), normalized by the anti-symmetric volume velocity component at the windows, Ua. Here, it can be seen that the magnitudes of pa(x) for different excitation cases become aligned with one another when normalized by Ua, while this is not true for the symmetric pressure component, ps(x). This result is consistent with the result in Figure 11(A), which shows a similar magnitude alignment characteristic between the BM velocity, ΔvBM(x), and the anti-symmetric volume velocity component, Ua. Again, an exception is the normalized anti-symmetric pressure, pa(x)/Ua, for the z directional BC vibration, which shows divergence from the results of the rest of the cases for BM locations apical to the BF locations (x = 21 mm for 1 kHz and x = 12 mm for 5 kHz). This divergent behavior is not reflected in Figure 11(A) for the normalized BM velocity, ΔvBM(x)/Ua, where all of the responses are consistent for the 1 kHz case. However, a similar divergence characteristic can be observed in Figure 11(A) for the 5 and 10 kHz results.
FIG. 12.
A–F Cochlear-scalae fluid-pressure distributions along the BM length, in response to AC and BC excitations at 1 kHz (left column) and 5 kHz (right column). A and D show the magnitudes of the SV pressure, pSV, 0.1 mm above the BM (in the z direction), and of the ST pressure, pST, 0.1 mm below the BM; B and E show the magnitudes of the anti-symmetric and symmetric cochlear fluid pressure components, pa and ps; and C and F show the anti-symmetric and symmetric fluid pressure components normalized by the corresponding anti-symmetric volume velocity components, Ua. Note that pa(BCx) and pa(BCy) results in B are overlapped so that they seem to be one line. In C, all pa(AC), pa(BCx), pa(BCy), and pa(BCz) results are well-aligned up to the BF location.
Effects on BC of alterations to the middle ear and cochlear windows
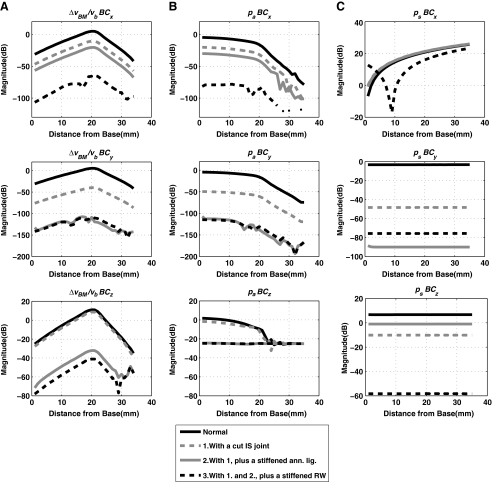
Up to this point, it has been shown that the pressure within the SV and ST, and the volume velocity at the OW and the RW can be decomposed into symmetric and anti-symmetric components [Eq. 7]. Furthermore, we have suggested that the anti-symmetric pressure normalized by the anti-symmetric volume velocity is an invariant quantity with regard to the different directional BC excitations. To further clarify the relationship between anti-symmetric pressure and anti-symmetric volume velocity, we performed structural alterations to the middle ear and the cochlear windows. The following three alterations were performed in sequence, and their cumulative effects on the response characteristics of the cochlea were simulated:
Cut the incus–stapes (IS) joint
Stiffen the annular ligament of the stapes
Stiffen the RW
Note that these alterations were performed cumulatively, such that each subsequent alteration was performed in addition to the alterations already performed for the previous steps. Figure 13 shows the effects of these alterations on the anti-symmetric volume velocity component, Ua, while Figure 14(A) and (B) show the effects on the normalized differential BM velocity, ΔvBM(x)/vb, and the anti-symmetric scalae pressure component, pa(x).
FIG. 13.
Effects of the sequential middle ear and cochlear-window alterations to the anti-symmetric volume-velocity component, Ua, for BC excitation in the x direction A, the y direction B, and the z direction C.
FIG. 14.
Effects of the sequential middle ear and cochlear-window alterations on: column A, the normalized differential BM velocity, ΔvBM(x)/vb; column B, the anti-symmetric scalae pressure component, pa(x); and column C, the symmetric scalae pressure component, ps(x); for the three directions of BC vibration. The results shown are for 1 kHz.
As shown in Figure 13, the anti-symmetric volume velocity, Ua, changes significantly with each alteration. The first alteration, the cutting of the IS joint, separates most of the middle ear structure from the system and leaves only the stapes attached at the OW. Then, stiffening the annular ligament of the stapes in the next step immobilizes the stapes and thus effectively eliminates the volume velocity at the OW, UOW. This typically results in significant reductions of the magnitude of the anti-symmetric volume velocity, Ua, though the extent of the reduction for the x directional case in Figure 13(A) can be seen to be less than those observed for the other two directions. The last step then rigidifies and immobilizes the remaining window, the RW. This further reduces the anti-symmetric volume velocity, Ua, to the level that is about 80–100 dB below the baseline level.
Figure 14 shows the effects of the alterations on the normalized differential BM velocity, ΔvBM(x)/vb, as well as on the decomposed cochlear fluid pressure components, pa(x) and ps(x). Only the results corresponding to an input frequency of 1 kHz are shown. The results indicate that the alterations have considerable effects on the cochlear responses. Generally speaking, the alterations can be seen to result in decreases in the magnitudes of ΔvBM(x)/vb and pa(x). These magnitude reductions are largely consistent with the reduction in the anti-symmetric volume velocity, Ua, observed in Figure 13 for the corresponding frequency of 1 kHz. However, an exception to this general trend can be observed for the z directional case for pa(x) in Figure 14(B), where the magnitude reductions are limited to a maximum of around 25 dB, and converge to a flat line upon stiffening the annular ligament. It is interesting to note that this is not completely reflected in the BM velocity reduction, ΔvBM(x)/vb, which reaches around 50 dB of reduction overall relative to the baseline case. The effects of these alterations on the symmetric pressure component, ps(x), as seen in Figure 14(C), do not appear to follow the common trends observed between the other two variables, ΔvBM(x)/vb and pa(x).
Discussion
Simulated BC-induced BM vibration responses
Figure 8 shows that the BM velocity responses normalized by the BC base vibration input vary significantly depending on the direction of the BC excitation. By contrast, when normalized by the OW volume velocity, UOW, as shown in Figure 9, the differences in the magnitude of the BM velocity response for different excitation directions diminish significantly. This implies that the BM velocity, ΔvBM(x), is driven by UOW not only for AC but also for BC excitations. Figure 10 shows that the two window volume velocities, UOW and URW, can be expressed in terms of anti-symmetric and symmetric components, Ua and Us, respectively. When ΔvBM(x) is normalized by Ua, as shown in Figure 11(A), the remaining small magnitude differences at 5 kHz seen in Figure 9(A) disappear up to the 17 mm BM location from the base. In contrast, normalizing by Us, as shown in Figure 11(B), only results in further separation among the cases. These observations suggest that the BM velocity is correlated with Ua rather than UOW and Us. In other words, the BM vibration is largely driven by Ua, introduced at the two windows, regardless of the method of excitation.
An examination of the cochlear fluid responses in Figure 12 provides further insight into the correlation between ΔvBM(x) and Ua. In Figure 12(B) and (E), the anti-symmetric pressure component, pa(x), falls off from the base to the apex, and its rate of decrease gets larger past the location of the BF (x = 21 and 12 mm for 1 and 5 kHz, respectively), whereas the symmetric pressure component, ps(x), either remains flat or increases in magnitude along the BM from base to apex. Figure 12(C) and (F) then show the magnitudes of pa(x) and ps(x) normalized with respect to Ua. Here, the pa(x)/Ua magnitudes for the different drive cases become aligned with one another for the most part, except for the BM locations that lie beyond the BF locations for the z directional BC excitation case. Together with the correlation between ΔvBM(x) and Ua as shown earlier (Fig. 11(A)), we conclude that the BM vibration is primarily driven by the anti-symmetric pressure component, which is introduced by the anti-symmetric volume–velocity component at the windows, regardless of the type of excitation method used (AC or BC in any of the different directions). The idea that the BM vibration is driven by the anti-symmetric pressure component in the cochlear fluid (Peterson and Bogert 1950; Olson 1998) is not new. However, the present study explores this concept in detail, and it should be noted that the present study applies the decomposition technique not only to the cochlear pressure, but also to the window volume velocities.
Mechanisms of BC hearing
BC hearing in human ears occurs through a combination of different mechanisms. Stenfelt and Goode (2005) list the following five BC mechanisms: (1) the external ear mechanism, (2) the middle ear inertial mechanism, (3) the fluid inertial mechanism, (4) the inner ear compression mechanism, and (5) pressure transmission from the cerebrospinal fluid. The external ear mechanism is where sound is generated through BC-induced vibration of the external ear canal, which then excites the eardrum. This mechanism is excluded from the present study since the external ear is not included in the model. The inner ear compression mechanism was studied by Tonndorf (1962) and Böhnke and Arnold (2006). However, the simulated BC excitations to the middle ear and cochlea in this study were in the form of rigid body translations of the bone surrounding the cochlea and the boundaries of the middle ear. Thus, the flexural response of the temporal bone which would drive the inner ear compressional BC mechanism was neglected. The rigid body BC vibration assumption is likely reasonable up to the 4–5 kHz frequency range. Hudde (2005) observed, based on FE simulations of the temporal bone in a skull model, that the compressional vibration component of the bone surrounding the middle ear and cochlea is lower than the rigid body vibration component by typically 25 dB up to a frequency of around 5 kHz. Stenfelt and Goode (2005) suggest that the compressional BC component may not be a major factor in BC hearing for the low and mid frequencies and that it may only become important for frequencies higher than 4 kHz. Furthermore, the rather reasonable agreements observed between the current FE-simulated BC response of the BM vibration and the temporal bone data also appear to indirectly support this rigid body bone vibration assumption. The fifth mechanism is that the BC-induced sound pressure in the cerebrospiral fluid in the cranial space is transmitted through a narrow fluid channel to the cochlea, which is thought to be through the cochlea aqueduct (Stenfelt and Goode 2005). This mechanism is not well-characterized to date and an anatomical examination suggests that the channel is occasionally clogged with tissues in normal ears (Gopen et al. 1997). It is thus excluded from the present study.
The BC mechanisms simulated in the present model are then the second and the third items in the list, which are the middle ear inertial and the fluid inertial components, respectively. The simulation results showing the effects of various middle ear and window alterations provide insight into these two BC mechanisms. Figure 13 shows that each cumulative alteration introduces significant changes in Ua, which, as has been discussed, apparently drives ΔvBM(x). This can be seen from Figure 14, which shows the changes in pa(x) and ΔvBM(x) due to the middle ear and window alterations at 1 kHz. By comparing Figure 14(A) and (B), one can see that the shifts in magnitude of ΔvBM(x), due to the alterations, largely correspond to those exhibited by pa(x) rather than to those exhibited by ps(x). Also, the extents of the shifts in magnitude for pa(x) and ΔvBM(x) correspond well with those observed in Ua at 1 kHz in Figure 13. This is again consistent with the earlier observation of the proportional relationships between the three quantities pa(x), Ua, and ΔvBM(x).
With the simulation of cutting the IS joint, most of the middle ear structures are removed from the system, leaving only the stapes intact at the OW. As a result, Ua tends to be attenuated in the 1–2 kHz range, relative to the normal case by up to 20 dB for the x, 45 dB for the y, and 10 dB for the z directional BC excitations, as shown in Figure 13. The degree of attenuation varies significantly for frequencies above and below the 1–2 kHz range, depending on the direction of BC excitation. This is reasonable since there is a structural resonance associated with the middle ear in response to BC excitations around this frequency range, which is explored in Homma et al. (2009, 2010). Following the cutting of the IS joint, the annular ligament of the stapes is then immobilized, which is a simulation of otosclerosis of the stapes footplate. In this case, the stapes is effectively made immobile, and therefore UOW becomes essentially zero. This causes further reductions in Ua, by up to 30 dB for the x, 110 dB for the y, and 40 dB for the z directional BC excitations, as shown in Figure 13. Going a step further, when URW is also eliminated by rigidifying the RW, Ua then becomes further reduced—to a level as much as 100 dB below the baseline case. This extreme reduction of Ua after immobilizing the two windows is to be expected in this model due to the observations so far that Ua is closely correlated with pa, as shown in Figure 12(C) and (F).
Audiological evidence suggests that the disruption of middle ear and window mobility, due to middle ear cavity fluid build-up (otitis media) as well as OW and/or RW sclerosis, results in reductions of BC hearing sensitivity. Arguably, the most well-known data are those from Carhart (1971), which reported mean BC hearing reductions of 5, 10, 15, and 10 dB at frequencies of 0.5, 1, 2, 4 kHz, respectively, due to sclerosis of the stapes footplate. It is suspected that the apparent discrepancy between the amount of reduction in BC hearing sensitivity suggested by the present model and the audiological evidence may be attributable to the presence of additional compliant boundaries within the cochlea other than the RW and OW included in the present formulation (Gopen et al. 1997; Sohmer and Freeman 2004; Shimizu et al. 2009; Kim et al. 2009).
The fluid inertial BC mechanism
The concept of the fluid inertial BC mechanism is intuitively straightforward: the cochlear fluid vibrates in response to the translational vibratory movement of the surrounding bone. The fluid moves as a nearly incompressible bulk fluid since the wavelength of the fluid acoustic wave is much larger than the size of the cochlea. The bulk fluid displacement then produces vibration of the BM. Such fluid displacement would be made possible by the presence of the compliant boundary locations where the fluid could be displaced in and out, namely the OW and RW. The FE simulation results in this study provide insights into the fundamental characteristics of the fluid inertial BC mechanism, and results show that the mechanics of the fluid inertial BC component are actually more complex than the intuitive and conceptual understanding just described.
The present results indicate that the BM responses of the fluid inertial component, regardless of the direction of the BC input vibration, are almost indistinguishable from those produced by regular AC excitation. This appears puzzling at first, particularly given the significant differences in the fluid pressure responses depending on the excitation method, as shown in Figure 10. However, this is largely consistent with the findings from past studies that the pattern of BM vibration does not change between AC and BC excitations, although it should be noted that past researchers have considered the BC excitation to be due to more of a compressional rather than a fluid inertial mechanism. Zwislocki (1953) mathematically analyzed the pattern of BM vibration, and suggested that it did not change between AC and BC excitations. Békésy (1955) and Tonndorf (1962) also demonstrated with physical models of the cochlea that the vibrational pattern on the BM did not change significantly regardless of the location of the vibrational input to the cochlea. Békésy referred to this as “paradoxical motion”. However, the provided explanations of the phenomenon in these early studies were rather more qualitative and thus were not sufficiently convincing. The decomposition analysis in the present study reveals that the BM vibration is correlated only with pa(x), which is generated by Ua. This relationship among the above three variables (pa(x), Ua, and ΔvBM(x)) does not change with the type of excitation given to the system. Therefore, even though the total fluid pressure response may vary depending on the excitation method, the relationship between the BM vibration and the anti-symmetric volume velocity stays essentially the same since the BM only responds to the anti-symmetric pressure component and not to the symmetric pressure component.
The anti-symmetric fluid pressure component
The z directional results for ΔvBM/Ua in Figure 11 and pa(x)/Ua in Figure 12 may seem to be inconsistent with the relationships among pa, Ua, and ΔvBM, which are largely independent of the BC excitation direction. In Figure 12(C), the z directional result of pa(x)/Ua diverges from the rest and stays as a constant magnitude beyond the BF location (x = 21 mm for 1 kHz). By contrast, the corresponding ΔvBM/Ua magnitude in Figure 11 does not follow this characteristic and instead keeps rolling off for x > 21 mm, and likewise for the other excitation cases. In Figure 12(F), similar characteristics can also be observed for 5 kHz. ΔvBM/Ua for the z directional vibration keeps rolling off beyond x = 13 mm, while the corresponding pa(x)/Ua magnitude becomes flat beyond this BM location. An explanation for this inconsistency can be derived from Figure 14, showing the effects of middle ear and window alterations on the BM velocity and fluid–pressure components. In Figure 14(A) and (B), the gradual reductions of Ua due to the sequential alterations result in proportional reductions in pa and ΔvBM for most cases, except for the z directional BC excitation case (see Fig. 14(B)). For this z directional BC excitation case, pa appears to converge to a flat magnitude after the second and third alterations. This results in only up to about 20 dB of magnitude reduction, despite the fact that the corresponding reduction in vBM is much larger. This indicates that, for the case of z directional BC excitation, there is an extraneous fluid pressure component in addition to the component that actually drives the BM vibration. This extraneous anti-symmetric pressure component is normally smaller than the BM-driving anti-symmetric component, except at BM locations that lie beyond the vicinity of the BF location. But when the anti-symmetric window volume velocity is diminished by the OW and then RW fixations, the BM-driving component of the anti-symmetric pressure becomes smaller and thus “buried” under the level of this extraneous anti-symmetric component. The extraneous anti-symmetric pressure component is prominent for the z directional BC vibration since the internal geometry of the present cochlear model is asymmetric with respect to this axis. On the other hand, the cochlear geometry in the model is essentially symmetric with respect to the other two directions of BC vibration, so the extraneous pressure components in these directions are symmetric, and thus do not affect the BM vibration.
Conclusion
A FE simulation model of the human auditory periphery, consisting of both the middle ear and the cochlea, was developed and analyzed to gain insight into the mechanics of BC hearing. The model allowed a detailed investigation of the middle ear and also of the cochlear fluid inertial BC mechanisms, with the latter being the possible primary mechanism of BC. The model shows a reasonable degree of agreement with experimental BC-induced BM vibrational data from the literature, as well as with AC-induced response data, such as the best-frequency-to-place map, pressure transfer function, and cochlear input impedance. Detailed analysis of this model indicates that BM vibrational characteristics, when normalized by the anti-symmetric (i.e., differential) components of the window volume velocities, are essentially invariant for AC or BC excitations, regardless of the direction of the BC excitation. This was at first surprising given that the fluid pressure responses vary significantly depending on the method of excitation. The present analysis provides further clarification for the cause of this apparent invariance of BM vibrational characteristics, which has also been observed previously by other researchers, by revealing that the BM vibration is driven only by the component of the fluid pressure that is anti-symmetric (i.e., the differential slow wave) with respect to the BM, and that this is in turn generated by the anti-symmetric window volume velocity. As a consequence of this, the BM only responds to the excitations generated at the two windows, regardless of whether these are produced via AC or BC excitation. These findings are consistent with Békésy’s idea of “paradoxical motion” of the BM for BC, and thereby provide further clarifications to the underlying mechanisms of BC.
Acknowledgments
The authors would like to thank Kevin N. O'Connor for several critical readings of this paper, leading to numerous improvements. This work has been supported in part by the Air Force Office of Scientific Research (AFOSR) STTR funding (FA9550-07-C-0088) and by a grant R01-DC07910 from the National Institute of Deafness and other Communication Disorders (NIDCD) of NIH.
References
- Aibara R, Welsh JT, Puria S, Goode RL. Human middle ear sound transfer function and cochlear input impedance. Hear Res. 2001;152:100–109. doi: 10.1016/S0378-5955(00)00240-9. [DOI] [PubMed] [Google Scholar]
- Allen JB, Sondhi MM. Cochlear macromechanics—time domain solutions. J Acoust Soc Am. 1979;66:123–132. doi: 10.1121/1.383064. [DOI] [PubMed] [Google Scholar]
- Békésy G. The variation of phase along the basilar membrane with sinusoidal vibrations. J Acoust Soc Am. 1947;19:452–460. doi: 10.1121/1.1916502. [DOI] [Google Scholar]
- Békésy G. On the elasticity of the cochlear partition. J Acoust Soc Am. 1948;20:227–241. doi: 10.1121/1.1906367. [DOI] [Google Scholar]
- Békésy G. Paradoxical direction of wave travel along the cochlear partition. J Acoust Soc Am. 1955;27:137–145. doi: 10.1121/1.1907474. [DOI] [Google Scholar]
- Böhnke F, Arnold W. Bone conduction in a three-dimensional model of the cochlea. ORL. 2006;68:393–396. doi: 10.1159/000095283. [DOI] [PubMed] [Google Scholar]
- Carhart R. Effects of stapes fixation on bone-conduction response. In: Ventry IM, Chailkin JB, Dixon RF, editors. Hearing measurement: a book of readings. New York: Appleton; 1971. pp. 116–129. [Google Scholar]
- Boer E. Short waves in three-dimensional cochlea models: solution for a ‘block’ model. Hear Res. 1981;4:53–77. doi: 10.1016/0378-5955(81)90036-8. [DOI] [PubMed] [Google Scholar]
- Emadi G, Richter CP, Dallos P. Stiffness of the gerbil basilar membrane: radial and longitudinal variations. J Neurophysiol. 2003;91:474–488. doi: 10.1152/jn.00446.2003. [DOI] [PubMed] [Google Scholar]
- Gan RZ, Reeves BP, Wang X. Modeling of sound transmission from ear canal to cochlea. Ann Biomed Eng. 2007;32:847–859. doi: 10.1023/B:ABME.0000030260.22737.53. [DOI] [PubMed] [Google Scholar]
- Gopen Q, Rosowski JJ, Merchant SN. Anatomy of the normal human cochlear aqueduct with functional implications. Hear Res. 1997;107:9–22. doi: 10.1016/S0378-5955(97)00017-8. [DOI] [PubMed] [Google Scholar]
- Greenwood DD. A cochlear frequency-position function for several species—29 years later. J Acoust Soc Am. 1990;87:2592–2605. doi: 10.1121/1.399052. [DOI] [PubMed] [Google Scholar]
- Gundersen T, Skarstein Ф, Sikkeland T. A study of the vibration of the basilar membrane in human temporal bone preparations by the use of the Mössbauer effect. Acta Otolaryngol. 1978;86:225–232. doi: 10.3109/00016487809124740. [DOI] [PubMed] [Google Scholar]
- Homma K, Du Y, Shimizu Y, Puria S. Ossicular resonance modes of the human middle ear for bone and air conduction. J Acoust Soc Am. 2009;125:968–979. doi: 10.1121/1.3056564. [DOI] [PMC free article] [PubMed] [Google Scholar]
- Homma K, Shimizu Y, Kim N, Du Y, Puria S. Effects of ear-canal pressurization on middle-ear bone- and air-conduction responses. Hear Res. 2010;263:204–215. doi: 10.1016/j.heares.2009.11.013. [DOI] [PMC free article] [PubMed] [Google Scholar]
- Hudde H (2005) A functional view on the peripheral human hearing organ. In: Communication Acoustics. Berlin: Springer. pp. 47–74
- Kim N, Homma K, Puria S, Steele CR (2009) Making sense of oval and round window volume displacement asymmetry in bone conduction: A third window near the round window. Middle-Ear Mechanics in Research and Otology Conference (MEMRO), Standford, CA., Hear Res
- Liu YW, Neely ST. Distortion product emissions from a cochlear model with nonlinear mechnoelectrical transduction in outer hair cells. J Acoust Soc Am. 2010;127:2420–2432. doi: 10.1121/1.3337233. [DOI] [PMC free article] [PubMed] [Google Scholar]
- Merchant SN, Ravicz ME, Rosowski JJ. Acoustic input impedance of the stapes and cochlea in human temporal bones. Hear Res. 1996;97:30–45. [PubMed] [Google Scholar]
- Naidu RC, Mountain DC. Basilar membrane tension calculations for the gerbil cochlea. J Acoust Soc Am. 2007;121:994–1002. doi: 10.1121/1.2404916. [DOI] [PubMed] [Google Scholar]
- Nakajima HH, Dong W, Olson ES, Merchant SN, Ravicz ME, Rosowski JJ. Differential intracochlear sound pressure measurements in normal human temporal bones. J ARO. 2009;10:23–36. doi: 10.1007/s10162-008-0150-y. [DOI] [PMC free article] [PubMed] [Google Scholar]
- Neely ST. Finite difference solution of a two-dimensional mathematical model of the cochlea. J Acoust Soc Am. 1981;69:1386–1393. doi: 10.1121/1.385820. [DOI] [PubMed] [Google Scholar]
- Olson ES. Observing middle and inner ear mechanics with novel intracochlear pressure sensors. J Acoust Soc Am. 1998;103:3445–3463. doi: 10.1121/1.423083. [DOI] [PubMed] [Google Scholar]
- Olson ES. Intracochlear pressure measurements related to cochlear tuning. J Acoust Soc Am. 2001;110:349–367. doi: 10.1121/1.1369098. [DOI] [PubMed] [Google Scholar]
- Peterson LC, Bogert BP. A dynamical theory of the cochlea. J Acoust Soc Am. 1950;22:369–381. doi: 10.1121/1.1906615. [DOI] [Google Scholar]
- Puria S, Allen JB. A parametric study of cochlear input impedance. J Acoust Soc Am. 1991;89:287–309. doi: 10.1121/1.400675. [DOI] [PubMed] [Google Scholar]
- Puria S, Steele CR. Mechano-acoustical transformation. In: Basbaum AI, Aimichi K, Gordon, Shepherd SM, Westheimer G, editors. The senses: a comprehensive reference, Vol. 3, Audition, Dallos P and Oertel D. San Diego: Academic; 2008. pp. 165–202. [Google Scholar]
- Puria S, Peake WT, Rosowski JJ. Sound-pressure measurements in the cochlea vestibule of human cadaver ears. J Acoust Soc Am. 1997;101:2754–2770. doi: 10.1121/1.418563. [DOI] [PubMed] [Google Scholar]
- Ren T. The cochlea amplifier and Ca2+ current-driven active stereocilia motion. Nat Neurosci. 2005;8:132–134. doi: 10.1038/nn0205-132. [DOI] [PubMed] [Google Scholar]
- Sadd . M.H. Elasticity. Theory, applications, and numerics. Burlington: Elsevier Butterworth-Heinemann; 2005. [Google Scholar]
- Shera CA. Laser amplification with a twist: traveling-wave propagation and gain functions from throughout the cochlea. J Acoust Soc Am. 2007;122:2738–2758. doi: 10.1121/1.2783205. [DOI] [PubMed] [Google Scholar]
- Shimizu Y, Puria S, Goode RL (2009) A new third window method for middle ear measurements in a human temporal bone model. Middle-Ear Mechanics in Research and Otology Conference (MEMRO), Stanford, CA., Hear Res
- Sim JH, Puria S. Soft tissue morphometry of the malleus-incus complex from micro-CT imaging. J Assoc Res Otolaryngol. 2008;9:5–21. doi: 10.1007/s10162-007-0103-x. [DOI] [PMC free article] [PubMed] [Google Scholar]
- Sim JH, Puria S, Steele CR. Calculation of inertial properties of the malleus-incus complex from micro-CT imaging. J Mech Mater Struct. 2007;2:1515–1524. doi: 10.2140/jomms.2007.2.1515. [DOI] [Google Scholar]
- Sohmer H, Freeman S. Further evidence for a fluid pathway during bone conduction auditory stimulation. Hear Res. 2004;193:105–110. doi: 10.1016/j.heares.2004.03.015. [DOI] [PubMed] [Google Scholar]
- Sondhi MM. Method for computing motion in a two-dimensional cochlear model. J Acoust Soc Am. 1978;61:110–119. doi: 10.1121/1.381893. [DOI] [PubMed] [Google Scholar]
- Steele CR, Lim KM. Cochlear model with three-dimensional fluid, inner sulcus and feed-forward mechanism. Audiol Neuro-Otol. 1999;4:197–203. doi: 10.1159/000013841. [DOI] [PubMed] [Google Scholar]
- Stenfelt S, Goode RL. Bone-conducted sound: physiological and clinical aspects. Otol Neurotol. 2005;26:1245–1261. doi: 10.1097/01.mao.0000187236.10842.d5. [DOI] [PubMed] [Google Scholar]
- Stenfelt S, Puria S, Hato N, Goode RL. Basilar membrane and osseous spiral lamina motion in human cadavers with air and bone conduction stimuli. Hear Res. 2003;181:131–143. doi: 10.1016/S0378-5955(03)00183-7. [DOI] [PubMed] [Google Scholar]
- Stenfelt S, Hato N, Goode RL. Fluid volume displacement at the oval and round windows with air and bone conduction stimulation. J Acoust Soc Am. 2004;115:797–812. doi: 10.1121/1.1639903. [DOI] [PubMed] [Google Scholar]
- Taschke H, Hudde H. A finite element model of the human head for auditory bone conduction simulation. ORL. 2006;68:319–323. doi: 10.1159/000095273. [DOI] [PubMed] [Google Scholar]
- Thorne M, Salt AN, DeMott JE, Henson MM, Henson OW, Gewalt SL. Cochlear fluid space dimensions for six species derived from reconstructions of three-dimensional magnetic resonance images. Laryngoscope. 1999;109:1661–1668. doi: 10.1097/00005537-199910000-00021. [DOI] [PubMed] [Google Scholar]
- Tonndorf J. Compressional bone conduction in cochlear models. J Acoust Soc Am. 1962;34:1127–1131. doi: 10.1121/1.1918259. [DOI] [Google Scholar]
- Wever EG. Theory of hearing. New York: Wiley; 1947. [Google Scholar]
- Wittbrodt MJ, Steele CR, Puria S. Developing a physical model of the human cochlea using microfabrication methods. Audiol Neurotol. 2006;11:104–112. doi: 10.1159/000090683. [DOI] [PubMed] [Google Scholar]
- Yoon YJ, Puria S, Steele CR. Intracochlear pressure and derived quantities from a three-dimensional model. J Acoust Soc Am. 2007;122:952–966. doi: 10.1121/1.2747162. [DOI] [PubMed] [Google Scholar]
- Zwislocki J. Wave motion in the cochlea caused by bone conduction. J Acoust Soc Am. 1953;25:986–989. doi: 10.1121/1.1907231. [DOI] [Google Scholar]


