Abstract
γ-Hydroxybutyric acid (GHB), a drug of abuse, demonstrates complex toxicokinetics with capacity-limited metabolism and active renal reabsorption. The objectives of the present study were to conduct a local sensitivity analysis of a mechanistic model for the active renal reabsorption of GHB and to use the results to inform the design of future studies aimed at developing therapeutic strategies for treating GHB overdoses. A local sensitivity analysis was used to assess the influence of parameter perturbations on model outputs (plasma concentrations and urinary excretion of GHB). Further, a sensitivity index was calculated for each perturbed parameter to assess the specific segments of the time course that are critical to parameter estimation. Model outputs were simulated for rats dosed with 200, 400, 600, and 1,000 mg/kg GHB intravenously and individual parameters were perturbed by two-, five-, and tenfold higher and lower than the nominal value. Model outputs were sensitive to perturbations in clearance and volume parameters. In contrast, model outputs were found to be insensitive to changes in distributional parameters suggesting that additional tissue distribution data is required. Based on the sensitivity analysis the 1,000-mg/kg GHB dose can be eliminated from future studies as the parameters can be adequately estimated from the lower doses. To further validate the use of this model, dose-specific sampling schedules were designed based on model predictions for doses of 600 and 1,500 mg/kg. These sampling schedules were able to adequately capture the inflection point and terminal elimination phase of the plasma concentration–time profiles obtained.
Key words: active renal reabsorption, gamma-hydroxybutyric acid, monocarboxylate transporters, sensitivity analysis
INTRODUCTION
γ-Hydroxybutyric acid (GHB) is an endogenous monocarboxylate found in the brain and peripheral tissues (1–3). It is also clinically used for the treatment of narcolepsy with cataplexy in the United States and Europe (marketed as Xyrem®); however, its illicit use is widespread due to its euphoric and sedative/hypnotic effects. GHB overdoses are characterized by symptoms of cardiovascular and central nervous system depression including nausea, vomiting, respiratory depression, coma, and death (4). Currently there are no available therapeutic interventions for the treatment of a GHB overdose. GHB demonstrates complex nonlinear toxicokinetics with capacity-limited metabolism, active renal reabsorption, and intestinal absorption as observed in humans and rats (5–8) which results in highly sustained systemic concentrations contributing to the observed toxic effects.
A number of pharmacokinetic/toxicokinetic models have been developed to describe the plasma concentration time course of GHB (6,8–11). In general, these compartmental models include nonlinear metabolic clearance and a single distribution compartment, but they do not include saturable renal reabsorption. Renal reabsorption of GHB is mediated by monocarboxylate transporters (MCTs) expressed in the proximal tubule of the kidney (12,13). Inhibition of these renal transporters has been shown to be a novel therapeutic strategy to treat GHB overdose by increasing renal clearance (9,14). To adequately describe all processes involved in GHB clearance, a mechanistic model describing active renal reabsorption is required. An initial model incorporating saturable renal reabsorption and nonlinear metabolic clearance was developed in our laboratory (9); however, this model described the time course of GHB in plasma alone. The initial model was extended to simultaneously describe GHB plasma concentrations and urinary excretion resulting in a mechanistic toxicokinetic model describing the saturable metabolism and active renal reabsorption of GHB (15). Simulations conducted using the mechanistic model to evaluate inhibition of active renal reabsorption demonstrated increased renal clearance and decreased plasma GHB concentrations; however, further validation of the model is required to confirm its ability to predict the toxicokinetic consequences of these therapeutic interventions.
Sensitivity analyses are a further step in the method validation process that provides information regarding which parameters have the greatest influence on model outputs. These analyses can involve perturbations in model parameters or variations in the model structure (16) and have been applied to a range of pharmacokinetic systems with varying degrees of complexity (16–18). Techniques for performing sensitivity analyses can be categorized as (1) factor screening methods, (2) local sensitivity analyses, or (3) global sensitivity analysis (19). These studies provide insight on the influence of parameters and their variability on model outputs which can be utilized to reduce the complexity of a model or design experiments to allow for accurate estimation of the most sensitive parameters.
A local sensitivity analysis involves simulation of model outputs following the perturbation of a single parameter. A sensitivity index indicates the segments of the model output profiles that are most sensitive to parameter perturbations and therefore are critical for parameter estimation. Local sensitivity analyses have been applied to evaluate both compartmental and physiologically based pharmacokinetic (PBPK) models for a range of compounds and model structures. Abraham et al. 2007 (17) performed a local sensitivity analysis to influential parameters for a group of compartmental pharmacokinetic/pharmacodynamic models describing target-mediated disposition. The authors were able to identify the sensitivity of the models to perturbations in the equilibrium dissociation constant (KD) and the initial receptor concentration, and further were able to inform future study designs to ensure accurate estimation of these influential parameters. Local sensitivity analyses are also commonly applied during the development of PBPK models to provide information regarding the required accuracy of parameter estimations, the time course of impact of parameters on model outputs, and to provide an understanding of the predictive power of the model prior to implementation (20). This approach was utilized to determine the overall parameter sensitivity for a whole-body PBPK model developed for a series of barbiturates and the parameters were ranked according to the sensitivity of the blood and tissue concentration time profiles to their perturbations (20). Hetrick et al., 1991 (21) performed sensitivity analyses for PBPK models of styrene, methylchloroform, and methylene chloride to determine the impact of input parameter variability on the observed variability in model outputs. A similar approach was used to evaluate PBPK models for trichloroethylene and oxantrazole; however, the impact of parameter perturbations on bias in the AUC was determined (22). Furthermore, these analyses utilized a percentage error on the parameter estimates to assess the impact of parameter variability on model outputs (21,22).
Global sensitivity analysis has also been recently applied to the analysis of PBPK models. A global sensitivity analysis involves perturbing multiple parameters simultaneously based on probability distribution functions surrounding the parameter and provides information regarding structural assumptions of the model and parameter interactions (19). A global approach was used to characterize the contribution of each parameter to the plasma and effect site concentration for a PBPK model of naratriptan (23). Furthermore, the authors assessed the impact of parameter variability to the probability of pain relief, the pharmacodynamic endpoint for naratriptan, thus demonstrating the applicability of this approach to the assessment of PK/PD models. A global sensitivity analysis of a PBPK model for diazepam demonstrated the utility of this technique in assessing the time course of the contribution of parameter variability which was used to reduce the structure of the model through compartment lumping (19).
Information obtained from a sensitivity analysis involving parameter perturbations of the mechanistic renal reabsorption model for GHB can be used to inform future study design in terms of dose selection and sampling time points, in addition to evaluating the predictive capacity of the model. The complex toxicokinetics of GHB necessitates the evaluation of multiple dose levels which may be optimally selected by determining the doses which are most sensitive to changes in model parameters. The objectives of the present study were (1) to conduct a local sensitivity analysis of a mechanistic model for the active renal reabsorption of GHB to evaluate the influence of parameter perturbations on model predictions and (2) to use the results to inform future study designs (in terms of dose and optimal sampling schedule) aimed at developing therapeutic strategies for the treatment of GHB overdose.
METHODS
Structural Model
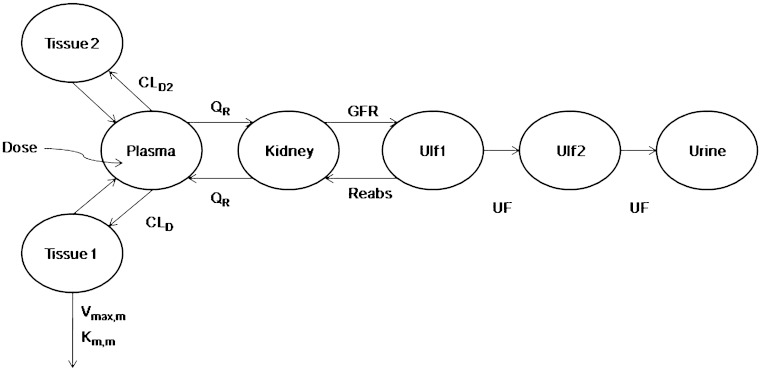
A mechanistic toxicokinetic model for γ-hydroxybutyric acid was previously developed and incorporates both active renal reabsorption and saturable metabolic clearance (15). A schematic representation of the structural model is presented in Fig. 1 with nominal parameter estimates and descriptions detailed in Table I. The differential equations corresponding to the structural model are detailed in Felmlee et al., 2010 (15).
Fig. 1.
Mechanistic toxicokinetic model for γ-hydroxybutyric acid (31)
Table I.
Nominal Model Parameter Values
| Parameter | Units | Description | Nominal value (CV% for between subject variability) |
|---|---|---|---|
| V plasma | ml | Plasma volume | 10.5 |
| V tissue1 | ml | Volume of the first tissue compartment | 75.9 (16%) |
| V tissue2 | ml | Volume of the second tissue compartment | 26.8 |
| V kidney | ml | Kidney volume | 4.0 |
| V ulf1 | ml | Volume of the first ultrafiltrate compartment | 3.0 |
| V ulf2 | ml | Volume of the second ultrafiltrate compartment | 1.0 |
| CLD | ml/min | Distributional clearance (tissue 1) | 26.9 |
| CLD2 | ml/min | Distributional clearance (tissue 2) | 3.07 |
| Q R | ml/min | Renal blood flow | 12.5 |
| V max,m | mg/min | Maximum metabolic elimination rate | 0.581 |
| K m,m | mg/ml | Metabolic Michaelis–Menten constant | 0.054 |
| GFR | mg/min/kg | Glomerular filtration rate | 10 |
| V max,R | mg/min | Maximum renal reabsorption rate | 2.34 |
| K m,R | mg/ml | Renal reabsorption Michaelis–Menten constant | 0.46 |
| UF | ml/min | Urine flow | 0.1 (114%) |
Parameter values from Felmlee et al. (31).
Sensitivity Analysis
A local (one-at-a-time) sensitivity analysis approach (24) was utilized in the present study to assess the impact of parameter perturbations on plasma concentration and urinary excretion profiles. A sensitivity index was calculated with respect to the perturbed parameter to compare the models’ sensitivity to each parameter (24). All parameters that were estimated during initial model development were included in the sensitivity analysis.
Simulations of plasma concentration and urinary excretion profiles were conducted in NONMEM VI (level 1.1, NONMEM Project Group, ICON Development Solutions, Ellicott City, MD) for rats dosed with 200, 400, 600, and 1,000 mg/kg GHB intravenously using the parameter estimates from the initial model development (Table I). Typical parameter values were perturbed two-, five-, and tenfold higher and lower than the nominal value while all other parameters were fixed. The parameter perturbation ranges were selected to be physiologically relevant. Variability parameters were fixed to zero, and model output profiles (plasma and urine) were simulated for all parameter perturbations for 360 min following dose administration. Partial derivatives were calculated based on mean population data using Eq. 1 and the sensitivity index (SI) was calculated using Eq. 2:
 |
1 |
 |
2 |
where Pi represents the individual parameter, Cp is the simulated plasma concentration at a specific time (t), and ΔPi is the incremental change in parameter Pi. For analysis of urinary excretion Cp is replaced with Ae which is the amount excreted at a specific time.
The determination of the SI by dividing the partial derivative by the plasma concentration (or drug excreted in urine) at a specific time point allows for the comparison of SIs across all of the parameters that are perturbed. When the SI equals zero, the model output is insensitive to the parameter that has been perturbed. If the absolute value of the SI is greater than zero, then the model output is sensitive to the parameter perturbation. The maximum and minimum changes in the SI are indicative of the regions of the plasma concentration or urinary excretion profiles which are sensitive to perturbations in a specific parameter.
For the nominal parameter estimates, 1,000 profiles were simulated per dose to determine the influence of population variability on the impact of parameter perturbations. The tenth and 90th percentiles for GHB plasma concentration and urinary excretion profiles for each dose were determined in SAS version 4.1 (SAS Institute, Cary, NC).
Dose Ranging Study
Male Sprague–Dawley rats (280–320 g) (Harlan, Indianapolis, IN) were housed in a room that had controlled environmental conditions with temperature and relative humidity of approximately 20 ± 2°C and 40–70%, and artificial lighting that alternated on a 12-h light–dark cycle. All rats had jugular vein cannulas implanted under ketamine/xylazine anesthesia as previously described (25) and were allowed to recover from surgery for 2 to 3 days prior to the start of the experiment. All animal care and experimental protocols were approved by the Institutional Animal Care and Use Committee at the University at Buffalo. Rats (N = 4–6 per dose) were administered an intravenous bolus of 600 or 1,500 mg/kg GHB (in sterile water). Blood samples (200 μl) were collected for up to 400 min. Sampling times were selected based on simulation studies and the results of the sensitivity analysis. Samples were transferred to heparinized tubes, and plasma was separated by centrifugation at 1,000 g for 5 min at 4°C. Plasma GHB concentrations were determined using a previously validated LC/MS/MS assay (25).
RESULTS AND DISCUSSION
Modeling and simulation provides an important tool in evaluating potential therapeutic strategies for the treatment of GHB overdose. We previously developed a mechanistic toxicokinetic model which includes capacity-limited active renal reabsorption and metabolism of GHB (15). The mechanistic nature of the model allows for the evaluation of a number of potential therapeutic strategies through simulation studies. Furthermore, these simulations can then be utilized to inform future study design in terms of dose selection and sampling schedule. The goal of the present study was to evaluate the robustness of the model predictions through the use of a local sensitivity analysis and further use these evaluations to design studies evaluating novel therapeutic strategies.
We evaluated the sensitivity of a mechanistic model describing the capacity-limited renal clearance and metabolic clearance of GHB to parameter perturbations to further validate predictability of the model. Both plasma and urine outputs were simulated for all parameter perturbations to determine the sensitivity (point sensitivity and the sensitivity index) of the individual outputs over a range of GHB doses. Parameter perturbations of two-, five-, and tenfold higher and lower than the nominal value were selected to be physiologically relevant. Plasma concentration profiles were highly sensitive to most parameter perturbations while urine outputs were most sensitive to changes in renal reabsorption parameters (Vmax,r and Km,r).
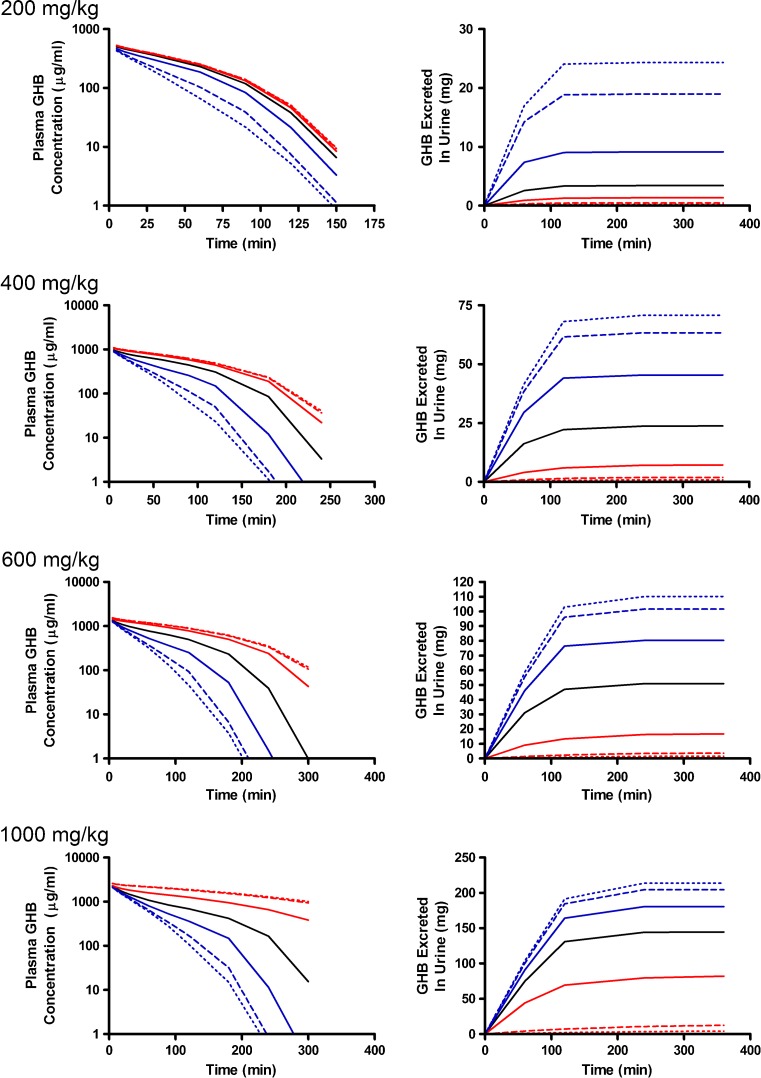
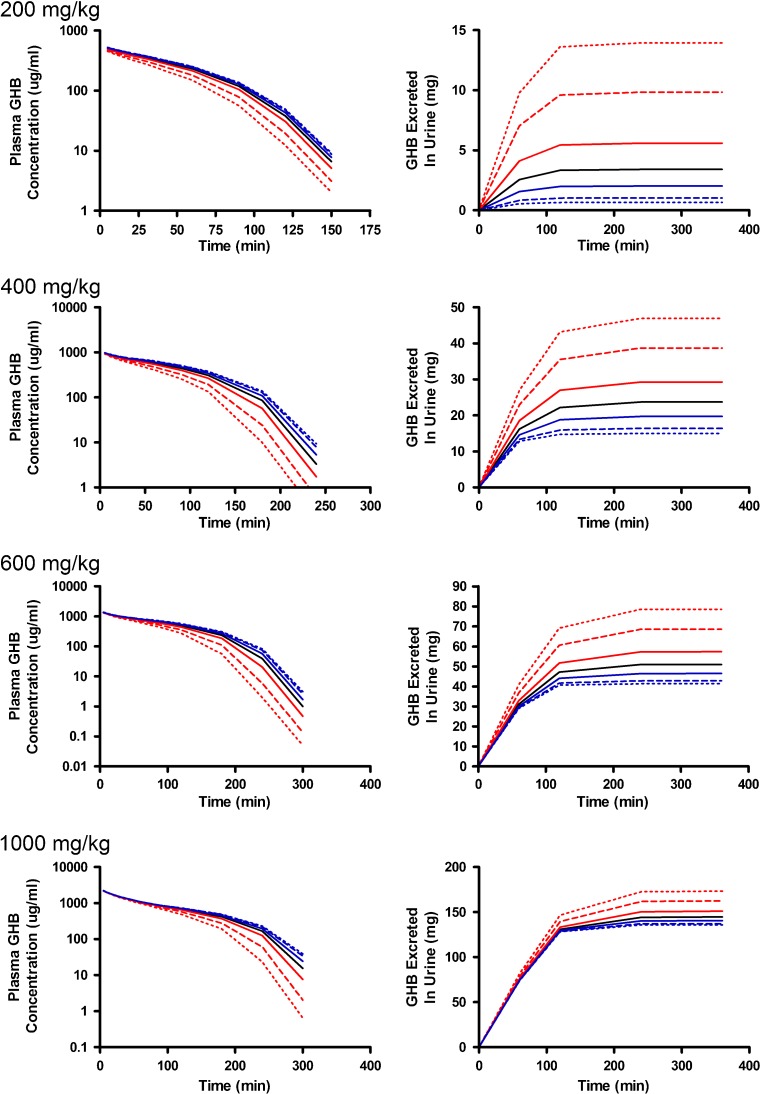
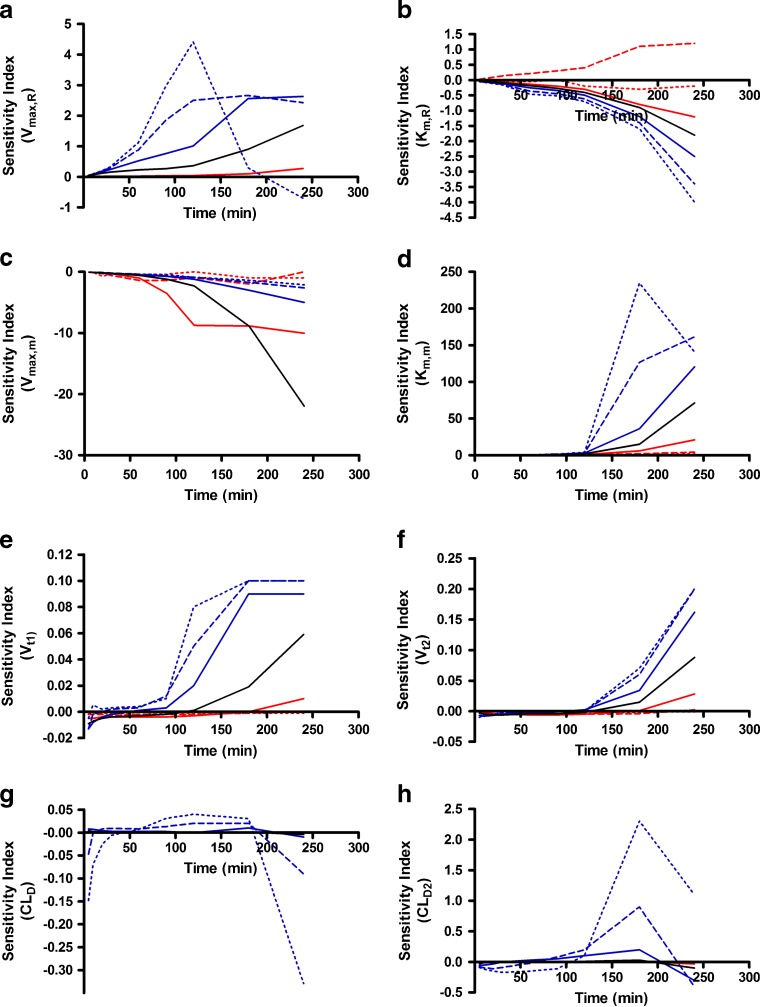
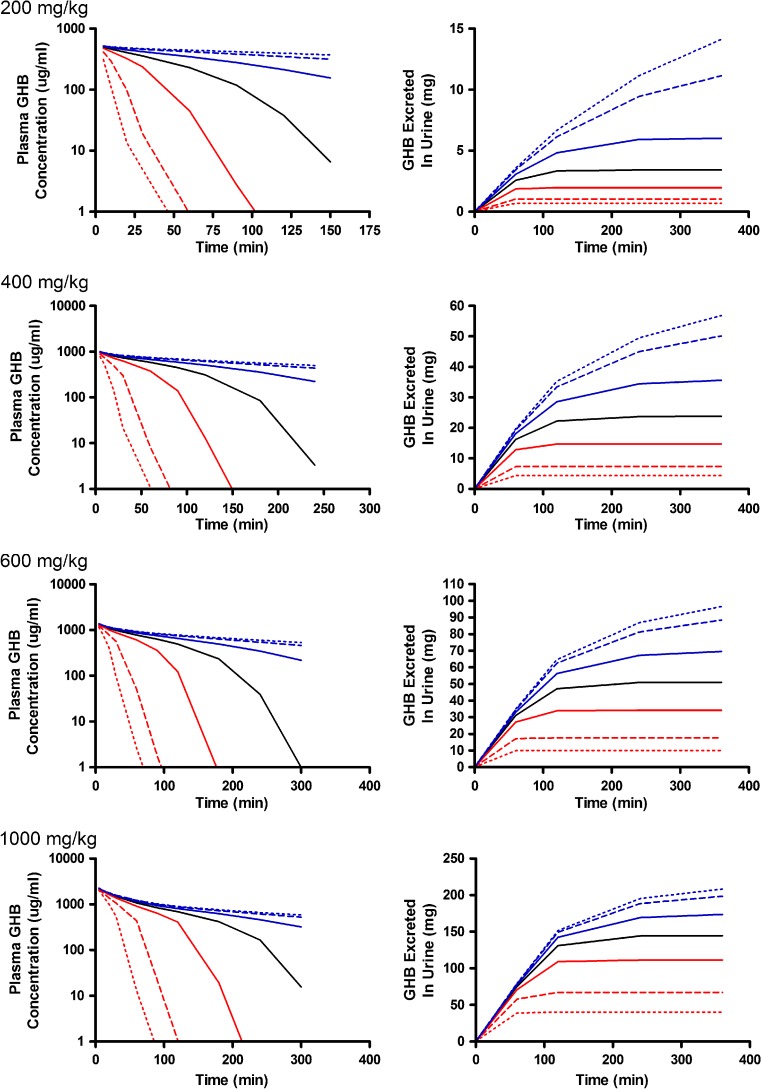
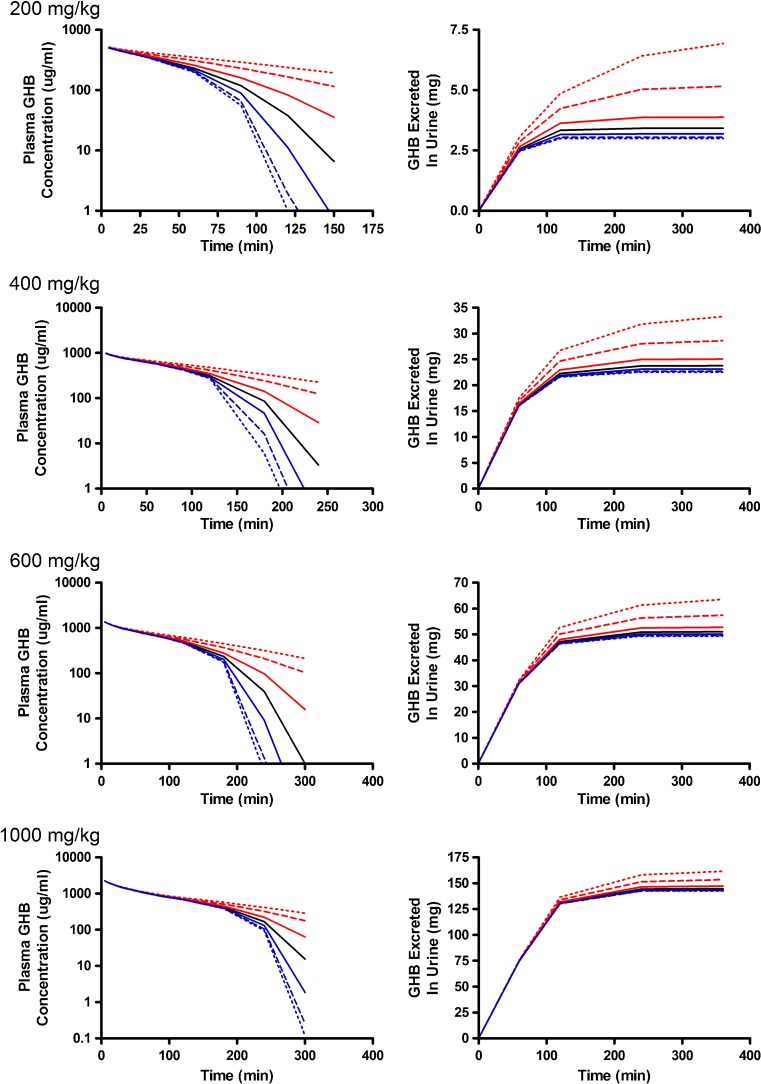
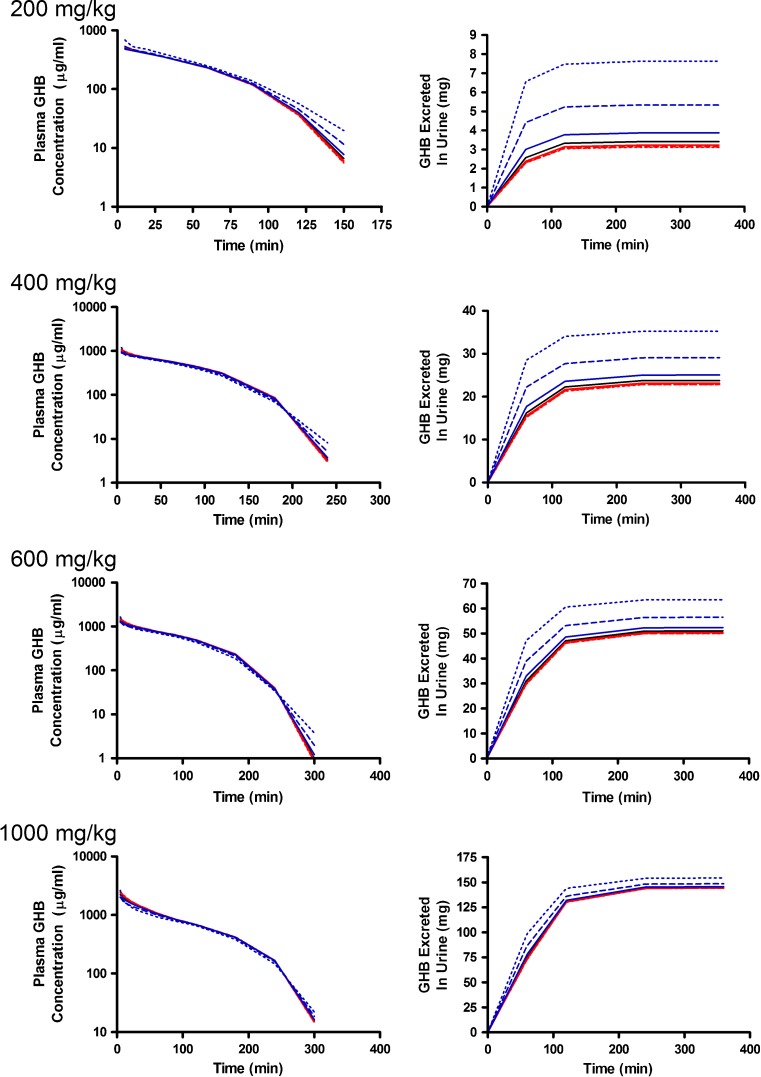
Alterations in model outputs due to perturbations in renal reabsorption parameters are detailed in Fig. 2 (Vmax,r) and Fig. 3 (Km,r). Increases in Vmax,r resulted in decreased excretion of GHB into urine and increased plasma concentrations which is consistent with the increased capacity for reabsorption (Fig. 2). Urine outputs were most sensitive to the plateau in amount excreted (Fig. 2), while plasma concentrations were highly sensitive after 120 min post-dose (Fig. 4a, b) based on the sensitivity index. Five- and tenfold higher perturbations in Vmax,r (Fig. 2) showed similar profiles suggesting that renal reabsorption was becoming saturated or limited by the amount of drug present in the tubular lumen. In contrast, changes in Km,r resulted in small changes in the plasma outputs; however, substantial changes were still observed in urine outputs (Fig. 3). Based on the sensitivity index, plasma profiles were most sensitive to the inflection point and terminal slope of the profile across all doses for both Km,r and Vmax,r (Fig. 4a, b). Future studies need to maximize collection of samples at these points. The 1,000 mg/kg was least sensitive to changes in Km,r indicating that it may be possible to eliminate this dose in future studies.
Fig. 2.
Simulated GHB plasma concentration–time and urinary excretion profiles following iv administration (200, 400, 600, or 1,000 mg/kg) with perturbations in V max,r. The nominal value of V max,r was perturbed two- (solid), five- (dashed), and tenfold (dotted) higher (red) or lower (blue) than the nominal value (solid black line)
Fig. 3.
Simulated GHB plasma concentration–time and urinary excretion profiles following iv administration (200, 400, 600, or 1,000 mg/kg) with perturbations in K m,r. The nominal value of K m,r was perturbed two- (solid), five- (dashed), and tenfold (dotted) higher (red) or lower (blue) than the nominal value (solid black line)
Fig. 4.
Sensitivity indices for a V max,r, b K m,r, c V max,m, d K m,m, e V t1, f V t2, g CLD, and h CLD2 for plasma concentration–time profiles following iv administration of 400 mg/kg GHB. The nominal value of the parameters was perturbed two- (solid), five- (dashed), and tenfold (dotted) higher (red) or lower (blue) than the nominal value (solid black line). The sensitivity indices were calculated using Eq. 2 detailed in the “METHODS” section
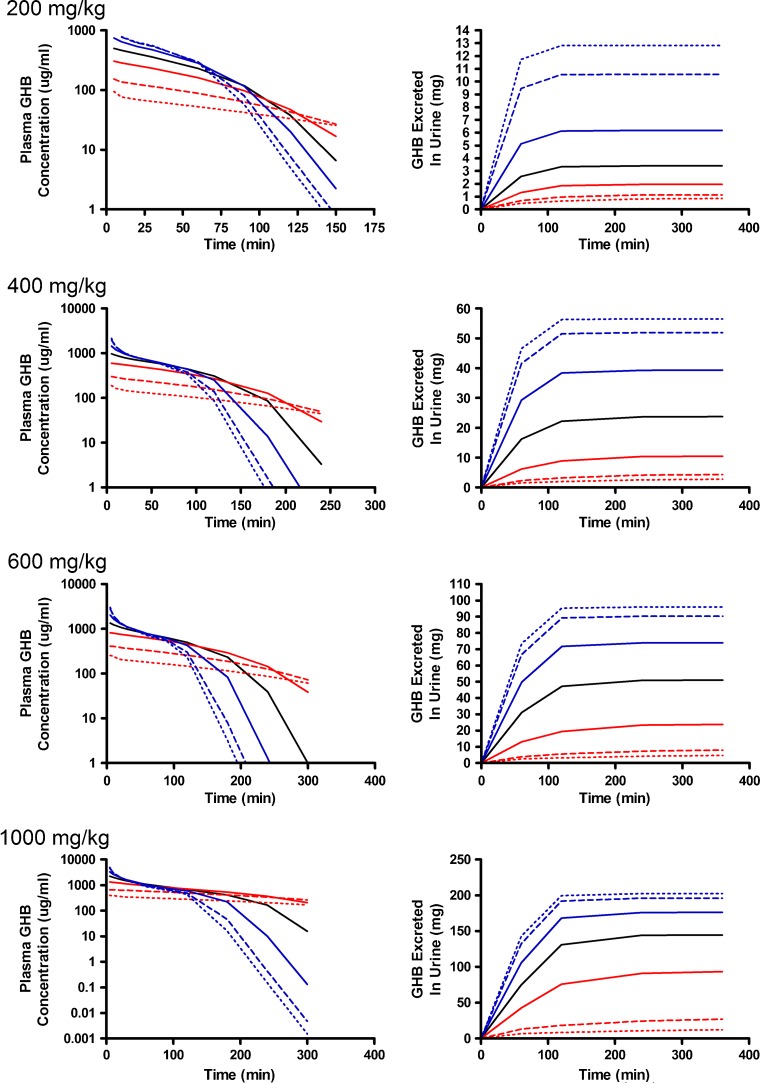
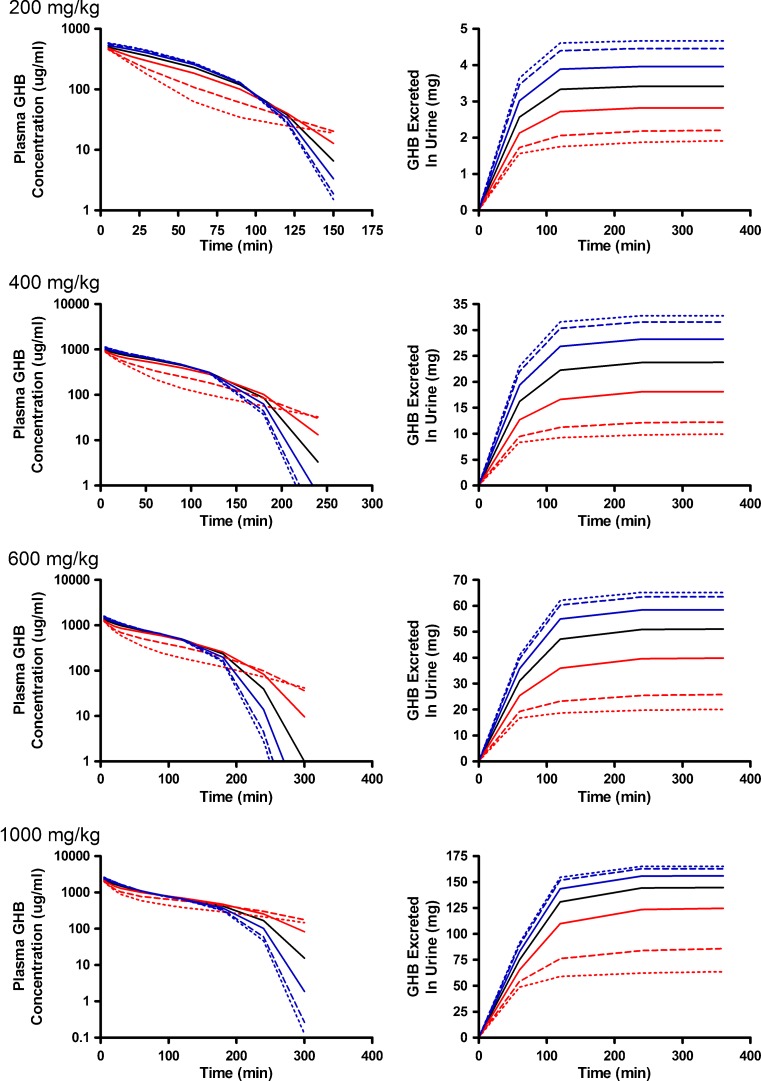
The greatest changes in plasma outputs were observed with perturbations in the metabolic clearance parameters (Vmax,m and Km,m) (Figs. 5 and 6). Plasma concentrations declined rapidly as Vmax,m was increased with linear profiles observed at the 200- and 400-mg/kg doses (Fig. 5). In contrast, lower Vmax,m values had minimal impact on the simulated plasma profiles and were not highly sensitive based on the sensitivity index (Fig. 4c) as metabolic clearance was likely saturated for the entire time course that was assessed. In this case, the amount of GHB excreted into the urine increased due to the high sustained plasma concentrations (Fig. 5). As anticipated, perturbing Km,m resulted in minimal impact to the early plasma time course, but had great effects on the inflection point of the curve and the terminal slope (Fig. 4d; 400-mg/kg dose) once the concentrations in the tissue compartment were below the Km,m. In terms of study design, it is necessary to capture this region of the time course, and if possible sample collection should be maximized in this region. The 1,000-mg/kg dose was the least sensitive to changes in this parameter likely due to the highly sustained GHB concentrations. Any therapeutic strategy that altered metabolic clearance of GHB would require careful consideration of sampling schedule and dose levels to be able to adequately capture the plasma and urine time courses.
Fig. 5.
Simulated GHB plasma concentration–time and urinary excretion profiles following iv administration (200, 400, 600, or 1,000 mg/kg) with perturbations in V max,m. The nominal value of V max,m was perturbed two- (solid), five- (dashed), and tenfold (dotted) higher (red) or lower (blue) than the nominal value (solid black line)
Fig. 6.
Simulated GHB plasma concentration–time and urinary excretion profiles following iv administration (200, 400, 600, or 1,000 mg/kg) with perturbations in K m,m. The nominal value of K m,m was perturbed two- (solid), five- (dashed), and tenfold (dotted) higher (red) or lower (blue) than the nominal value (solid black line)
The final set of parameters evaluated were those reflecting the tissue distribution of GHB (Vt1, Vt2, CLD, and CLD2) which are detailed in Figs. 7, 8, and 9. Perturbations in tissue volumes altered both model outputs with the greatest changes being observed in the shape of the plasma concentration profile when Vt1 was altered. The lower initial plasma concentrations (Fig. 7) are likely due to a larger amount of GHB taken up and being restricted in the tissue. Both volume terms were the most sensitive to changes later in the plasma time course (after 100 min) suggesting that sampling at these time points is critical for the estimation of these parameters (Fig. 4e, f). Vt2 (Fig. 8) was slightly more sensitive to parameter perturbations than Vt1; however, the model outputs are less sensitive to changes in volume parameters than the nonlinear clearance parameters. In contrast to the other parameters evaluated, the model outputs were not sensitive to changes in distributional clearance parameters (CLD and CLD2) (Fig. 9). This may be due to the lack of tissue GHB data used in model development. Model outputs are not shown for CLD2 as they are similar to those for CLD. Model outputs were sensitive to CLD2 perturbations at later time points (Fig. 4h); however, a further understanding of the tissue distribution of GHB is required. These parameters should be fixed for all future efforts using the present model.
Fig. 7.
Simulated GHB plasma concentration–time and urinary excretion profiles following iv administration (200, 400, 600, or 1,000 mg/kg) with perturbations in V t1. The nominal value of V t1 was perturbed two- (solid), five- (dashed), and tenfold (dotted) higher (red) or lower (blue) than the nominal value (solid black line)
Fig. 8.
Simulated GHB plasma concentration–time and urinary excretion profiles following iv administration (200, 400, 600, or 1,000 mg/kg) with perturbations in V t2. The nominal value of V t2 was perturbed two- (solid), five- (dashed), and tenfold (dotted) higher (red) or lower (blue) than the nominal value (solid black line)
Fig. 9.
Simulated GHB plasma concentration–time and urinary excretion profiles following iv administration (200, 400, 600, or 1,000 mg/kg) with perturbations in CLD. The nominal value of CLD was perturbed two- (solid), 5- (dashed), and tenfold (dotted) higher (red) or lower (blue) than the nominal value (solid black line)
Renal reabsorption of GHB is mediated by the MCT family of transporters with MCT1, MCT2 and MCT4 involved in the transport of GHB (12,13,26). However, expression of these transporters is not restricted to the kidneys (27). MCT1, the major isoform involved in GHB transport, is ubiquitously expressed (28) and as such may greatly influence the tissue distribution of GHB at supratherapeutic doses. GHB transport across the blood–brain barrier is mediated by MCTs, and saturation/inhibition of these transporters may result in altered brain distribution (29). In addition, the sedative/hypnotic effect may also be altered as the brain is the site of action. Studies investigating the dose dependence of the tissue distribution of GHB are necessary to elucidate the contribution of MCTs to GHB disposition. Furthermore, therapeutic strategies aimed at inhibiting MCT-mediated renal reabsorption may also impact the tissue distribution of MCTs. Development of a whole-body physiological toxicokinetic model that accounts for variations in tissue distribution may be required to more accurately predict the impact of inhibition of MCTs.
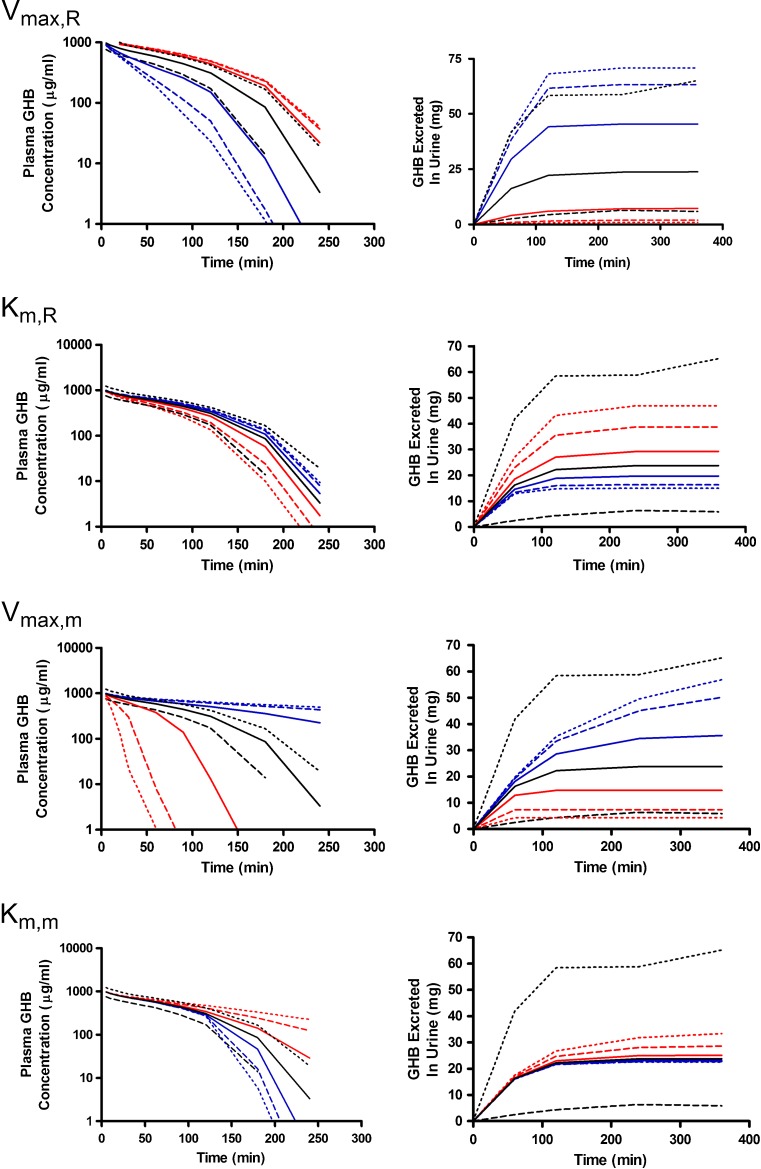
To address the relationship between the population variability in model outputs and the parameter perturbations necessary to overcome this variability, simulations were conducted using the variability parameters estimated during model development (Table I) (15). The tenth and 90th percentiles obtained from these simulations of GHB plasma concentrations and urinary excretion are presented in Fig. 10 and compared profiles resulting from perturbations in the nonlinear metabolic and renal clearance parameters. Perturbations in Vmax,R and Vmax,m greater than twofold resulted in plasma concentration profiles that fell outside of the observed variability of the nominal profiles. In contrast, perturbations in Km,R and Km,m only fell outside the variability in the nominal profiles when they were perturbed tenfold greater than the nominal value, indicating that much larger changes in affinity are required to observe changes in plasma concentration profiles. In terms of GHB urinary excretion, only perturbations in Vmax,R resulted in profiles outside of the variability in the nominal profile. Perturbations in the metabolic clearance parameters were not expected to have large effects on urinary excretion, which is consistent with the observed results. Interestingly, tenfold changes in Km,R did not overcome the observed variability; however, previous studies have demonstrated significant increases in the amount of GHB excreted in the urine following the co-administration of inhibitors of active renal reabsorption. These results suggest that the change in the apparent Km,R is greater than tenfold, but further studies are required to determine in vivo Ki values for these interactions.
Fig. 10.
Simulated GHB plasma concentration–time and urinary excretion profiles following iv administration (400 mg/kg) with perturbations in V max,R, K m,R, V max,m, and K m,m. The nominal parameter value was perturbed two- (solid), five- (dashed), and tenfold (dotted) higher (red) or lower (blue) than the nominal value (solid black line). To assess the impact of variability in model outputs the variability of the nominal parameter estimates is presented as the tenth (dashed black line) and 90th (dotted black line) percentiles calculated from the simulation of 1,000 individual profiles
One limitation of the present study is that a local sensitivity analysis was utilized instead of a more global approach. A local sensitivity analysis reflects the sensitivity of a parameter relative to the point estimates of all other parameters which have been held constant. In the present study, the local approach provides information regarding the optimal sampling times and doses so that the maximum information about each parameter will be obtained. In contrast, in a global sensitivity analysis multiple parameters are perturbed simultaneously (30). One advantage of the global approach is that it provides information regarding the interaction of various model parameters. In this case, a local sensitivity analysis provides the information necessary to move forward with study design and model development, but a more global approach could be considered in the future to address any potential interactions between model parameters.
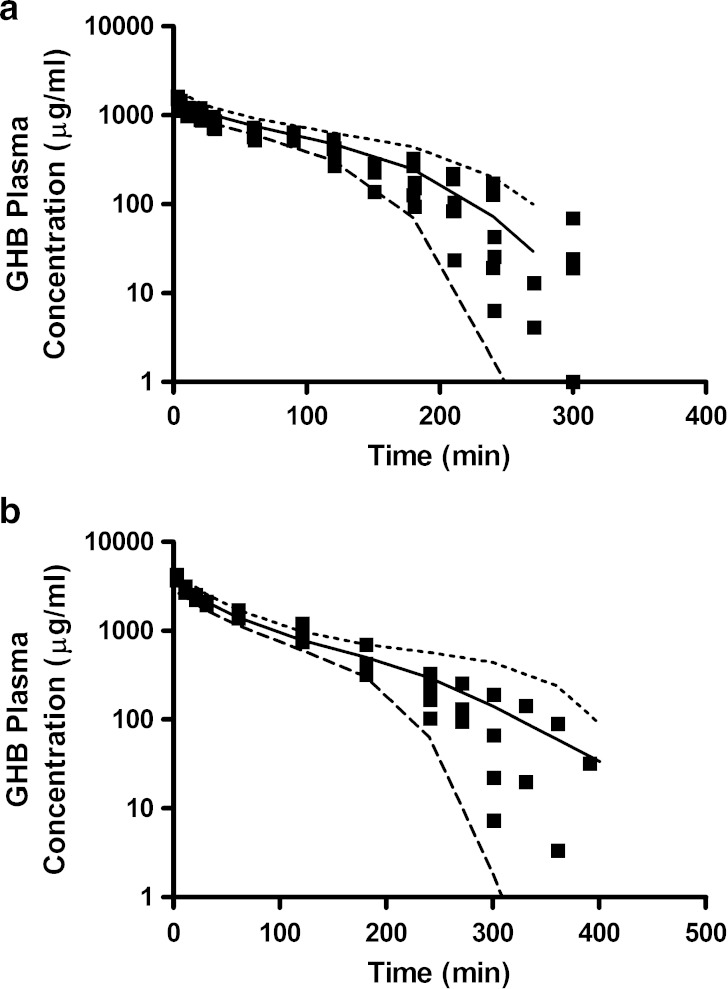
The sensitivity analysis conducted in the present study was utilized to inform the design of future studies. Based on these results the 1,000-mg/kg dose will be excluded from all future therapeutic intervention studies as it is not required for parameter estimation, thereby reducing the required animal numbers. Dose-specific schedules have been designed to maximize the number of samples collected during the inflection point of the plasma concentration–time profiles. This region appears to play a critical role in the estimation of the metabolic and renal clearance parameters which are both potential targets for therapeutic interventions. Additionally, the sampling schedule during the early plasma concentration time course will remain the same to capture tissue distribution. The present study also suggests that the current urine collection intervals are adequate to characterize the saturable renal reabsorption of GHB. Figure 11 illustrates GHB plasma concentration–time profiles predicted using the mechanistic toxicokinetic model for GHB doses of 600 and 1,500 mg/kg. Based on these simulations, sampling schedules were designed to capture the initial distribution phase and the inflection point of the curve. The solid symbols represent individual plasma samples collected from rats administered GHB 600 and 1,500 mg/kg intravenously, studies that were not included in the initial development of the model. The predicted sampling schedule was able to adequately capture the initial distribution and inflection point for doses that were within or exceeded the dose range used to develop the mechanistic toxicokinetic model. These results support the use of these model predictions for the design of future studies assessing GHB toxicokinetics. In addition to the use of the present model, future studies will assess the tissue distribution of GHB to gain an understanding of the role of MCTs in its tissue uptake. The current model may then be expanded to a full physiologically based toxicokinetic model allowing for the simultaneous prediction of plasma, urine, and tissue concentrations of GHB.
Fig. 11.
GHB plasma concentration–time profiles for rats administered (a) 600 (n = 6) or (b) 1,500 mg/kg (n = 4) GHB intravenously. Solid squares represent individual data points. The plotted lines are based on 1,000 simulated plasma concentration–time profiles for each dose based on the population toxicokinetic model described in Fig. 1 and Table I. The plotted lines were utilized to design the experimental plasma sampling schedule. The mean (solid line) and the tenth (dashed line) and 90th (dotted lined) percentiles were calculated from the predicted concentrations
CONCLUSIONS
In the present study, we evaluated the local sensitivity of a mechanistic model of active renal reabsorption for GHB. Clearance and distributional parameters were perturbed to determine their impact on plasma concentration and urinary excretion profiles. The model was sensitive to all parameters with respect to both model outputs, with distributional clearance being the only exception. The results of the sensitivity analysis were used to determine dose-specific schedules to maximize the number of samples collected during the initial distribution phase and the inflection point of the plasma concentration–time profiles in two additional studies, using doses of 600 and 1,500 mg/kg. Using the findings of this sensitivity analysis, optimal doses and optimal dose-dependent sampling schedules for both plasma and urine can be determined. This approach minimizes the number of animal studies needed to obtain estimates of pharmacokinetic parameters. Future studies will examine the tissue distribution of GHB to further improve the model and allow for predictions of concentrations in specific tissues.
ACKNOWLEDGEMENTS
This work was supported by the National Institute of Health National Institute of Drug Abuse (grant DA 023223). MAF was supported in part by a fellowship from Pfizer Global Research and Development.
Abbreviations
- GHB
γ-Hydroxybutyric acid
- MCTs
Monocarboxylate transporters
- PBPK
Physiologically based pharmacokinetic model
- SI
Sensitivity index
REFERENCES
- 1.Gold BI, Roth RH. Kinetics of in vivo conversion of gamma-[3H]aminobutyric acid to gamma-[3H]hydroxybutyric acid by rat brain. J Neurochem. 1977;28(5):1069–1073. doi: 10.1111/j.1471-4159.1977.tb10670.x. [DOI] [PubMed] [Google Scholar]
- 2.Maitre M. The gamma-hydroxybutyrate signalling system in brain: organization and functional implications. Prog Neurobiol. 1997;51(3):337–361. doi: 10.1016/S0301-0082(96)00064-0. [DOI] [PubMed] [Google Scholar]
- 3.Tedeschi L, Carai MA, Frison G, Favretto D, Colombo G, Ferrara SD, et al. Endogenous gamma-hydroxybutyric acid is in the rat, mouse and human gastrointestinal tract. Life Sci. 2003;72(22):2481–2488. doi: 10.1016/S0024-3205(03)00143-7. [DOI] [PubMed] [Google Scholar]
- 4.Okun MS, Boothby LA, Bartfield RB, Doering PL. GHB: an important pharmacologic and clinical update. J Pharm Pharm Sci. 2001;4(2):167–175. [PubMed] [Google Scholar]
- 5.Palatini P, Tedeschi L, Frison G, Padrini R, Zordan R, Orlando R, et al. Dose-dependent absorption and elimination of gamma-hydroxybutyric acid in healthy volunteers. Eur J Clin Pharmacol. 1993;45(4):353–356. doi: 10.1007/BF00265954. [DOI] [PubMed] [Google Scholar]
- 6.Lettieri JT, Fung HL. Dose-dependent pharmacokinetics and hypnotic effects of sodium gamma-hydroxybutyrate in the rat. J Pharmacol Exp Ther. 1979;208(1):7–11. [PubMed] [Google Scholar]
- 7.Arena C, Fung HL. Absorption of sodium gamma-hydroxybutyrate and its prodrug gamma-butyrolactone: relationship between in vitro transport and in vivo absorption. J Pharm Sci. 1980;69(3):356–358. doi: 10.1002/jps.2600690331. [DOI] [PubMed] [Google Scholar]
- 8.Morris ME, Hu K, Wang Q. Renal clearance of gamma-hydroxybutyric acid in rats: increasing renal elimination as a detoxification strategy. J Pharmacol Exp Ther. 2005;313(3):1194–1202. doi: 10.1124/jpet.105.083253. [DOI] [PubMed] [Google Scholar]
- 9.Wang X, Wang Q, Morris ME. Pharmacokinetic interaction between the flavonoid luteolin and gamma-hydroxybutyrate in rats: potential involvement of monocarboxylate transporters. AAPS J. 2008;10(1):47–55. doi: 10.1208/s12248-007-9001-8. [DOI] [PMC free article] [PubMed] [Google Scholar]
- 10.Fung HL, Tsou PS, Bulitta JB, Tran DC, Page NA, Soda D, et al. Pharmacokinetics of 1,4-butanediol in rats: bioactivation to gamma-hydroxybutyric acid, interaction with ethanol, and oral bioavailability. AAPS J. 2008;10(1):56–69. doi: 10.1208/s12248-007-9006-3. [DOI] [PMC free article] [PubMed] [Google Scholar]
- 11.Van Sassenbroeck DK, De Paepe P, Belpaire FM, Buylaert WA. Characterization of the pharmacokinetic and pharmacodynamic interaction between gamma-hydroxybutyrate and ethanol in the rat. Toxicol Sci. 2003;73(2):270–278. doi: 10.1093/toxsci/kfg079. [DOI] [PubMed] [Google Scholar]
- 12.Wang Q, Darling IM, Morris ME. Transport of gamma-hydroxybutyrate in rat kidney membrane vesicles: role of monocarboxylate transporters. J Pharmacol Exp Ther. 2006;318(2):751–761. doi: 10.1124/jpet.106.105965. [DOI] [PubMed] [Google Scholar]
- 13.Wang Q, Lu Y, Morris ME. Monocarboxylate transporter (MCT) mediates the transport of gamma-hydroxybutyrate in human kidney HK-2 cells. Pharm Res. 2007;24(6):1067–1078. doi: 10.1007/s11095-006-9228-6. [DOI] [PubMed] [Google Scholar]
- 14.Wang Q, Wang X, Morris ME. Effects of l-lactate and d-mannitol on gamma-hydroxybutyrate toxicokinetics and toxicodynamics in rats. Drug Metab Dispos. 2008;36(11):2244–2251. doi: 10.1124/dmd.108.022996. [DOI] [PMC free article] [PubMed] [Google Scholar]
- 15.Felmlee MA, Wang Q, Cui D, Roiko SA, Morris ME. Mechanistic toxicokinetic model for gamma-hydroxybutyric acid: inhibition of active renal reabsorption as a potential therapeutic strategy. AAPS J. 2010;12(3):407–416. doi: 10.1208/s12248-010-9197-x. [DOI] [PMC free article] [PubMed] [Google Scholar]
- 16.Nestorov IA. Sensitivity analysis of pharmacokinetic and pharmacodynamic systems: I. A structural approach to sensitivity analysis of physiologically based pharmacokinetic models. J Pharmacokinet Biopharm. 1999;27(6):577–596. doi: 10.1023/A:1020926525495. [DOI] [PubMed] [Google Scholar]
- 17.Abraham AK, Krzyzanski W, Mager DE. Partial derivative-based sensitivity analysis of models describing target-mediated drug disposition. AAPS J. 2007;9(2):E181–E189. doi: 10.1208/aapsj0902020. [DOI] [PMC free article] [PubMed] [Google Scholar]
- 18.Wu G. Sensitivity analysis of pharmacokinetic parameters in one-compartment models. Pharmacol Res. 2000;41(4):445–453. doi: 10.1006/phrs.1999.0602. [DOI] [PubMed] [Google Scholar]
- 19.Gueorguieva I, Nestorov IA, Rowland M. Reducing whole body physiologically based pharmacokinetic models using global sensitivity analysis: diazepam case study. J Pharmacokinet Pharmacodyn. 2006;33(1):1–27. doi: 10.1007/s10928-005-0004-8. [DOI] [PubMed] [Google Scholar]
- 20.Nestorov IA, Aarons LJ, Rowland M. Physiologically based pharmacokinetic modeling of a homologous series of barbiturates in the rat: a sensitivity analysis. J Pharmacokinet Biopharm. 1997;25(4):413–447. doi: 10.1023/A:1025740909016. [DOI] [PubMed] [Google Scholar]
- 21.Hetrick DM, Jarabek AM, Travis CC. Sensitivity analysis for physiologically based pharmacokinetic models. J Pharmacokinet Biopharm. 1991;19(1):1–20. doi: 10.1007/BF01062190. [DOI] [PubMed] [Google Scholar]
- 22.Varkonyi P, Bruckner JV, Gallo JM. Effect of parameter variability on physiologically-based pharmacokinetic model predicted drug concentrations. J Pharm Sci. 1995;84(3):381–384. doi: 10.1002/jps.2600840322. [DOI] [PubMed] [Google Scholar]
- 23.Gueorguieva I, Nestorov IA, Aarons L, Rowland M. Uncertainty analysis in pharmacokinetics and pharmacodynamics: application to naratriptan. Pharm Res. 2005;22(10):1614–1626. doi: 10.1007/s11095-005-6629-x. [DOI] [PubMed] [Google Scholar]
- 24.Hamby DM. A comparison of sensitivity analysis techniques. Health Phys. 1995;68(2):195–204. doi: 10.1097/00004032-199502000-00005. [DOI] [PubMed] [Google Scholar]
- 25.Felmlee MA, Roiko SA, Morse BL, Morris ME. Concentration-effect relationships for the drug of abuse gamma-hydroxybutyric acid. J Pharmacol Exp Ther. 2010;333(3):764–771. doi: 10.1124/jpet.109.165381. [DOI] [PMC free article] [PubMed] [Google Scholar]
- 26.Wang Q, Morris ME. The role of monocarboxylate transporter 2 and 4 in the transport of gamma-hydroxybutyric acid in mammalian cells. Drug Metab Dispos. 2007;35(8):1393–1399. doi: 10.1124/dmd.107.014852. [DOI] [PubMed] [Google Scholar]
- 27.Morris ME, Felmlee MA. Overview of the proton-coupled MCT (SLC16A) family of transporters: characterization, function and role in the transport of the drug of abuse gamma-hydroxybutyric acid. AAPS J. 2008;10(2):311–321. doi: 10.1208/s12248-008-9035-6. [DOI] [PMC free article] [PubMed] [Google Scholar]
- 28.Halestrap AP, Price NT. The proton-linked monocarboxylate transporter (MCT) family: structure, function and regulation. Biochem J. 1999;343(Pt 2):281–299. doi: 10.1042/0264-6021:3430281. [DOI] [PMC free article] [PubMed] [Google Scholar]
- 29.Bhattacharya I, Boje KM. GHB (gamma-hydroxybutyrate) carrier-mediated transport across the blood-brain barrier. J Pharmacol Exp Ther. 2004;311(1):92–98. doi: 10.1124/jpet.104.069682. [DOI] [PubMed] [Google Scholar]
- 30.Saltelli A, Tarantola S, Chan KP-S. A quantitative model-independent method for global sensitivity analysis of model output. Technometrics. 1999;41(1):39–56. doi: 10.2307/1270993. [DOI] [Google Scholar]
- 31.Felmlee MA, Wang Q, Cui D, Roiko SA, Morris ME. Mechanistic toxicokinetic model for gamma-hydroxybutyric acid: inhibition of active renal reabsorption as a potential therapeutic strategy. AAPS J. 2010;12(3):407–416. doi: 10.1208/s12248-010-9197-x. [DOI] [PMC free article] [PubMed] [Google Scholar]


