

Abstract
The 2008 food crisis may have increased household food insecurity and caused distress among impoverished populations in low-income countries. Policy researchers have attempted to quantify the impact that a sharp rise in food prices might have on population wellbeing by asking what proportion of households would drop below conventional poverty lines given a set increase in prices. Our understanding of the impact of food crises can be extended by conducting micro-level ethnographic studies. This study examined self-reported household food insecurity (FI) and common mental disorders (CMD) among 110 community health AIDS care volunteers living in Addis Ababa, Ethiopia during the height of the 2008 food crisis. We used generalized estimating equations that account for associations between responses given by the same participants over 3 survey rounds during 2008, to model the longitudinal response profiles of FI, CMD symptoms, and socio-behavioral and micro-economic covariates. To help explain the patterns observed in the response profiles and regression results, we examine qualitative data that contextualize the cognition and reporting behavior of AIDS care volunteers, as well as potential observation biases inherent in longitudinal, community-based research. Our data show that food insecurity is highly prevalent, that is it associated with household economic factors, and that it is linked to mental health. Surprisingly, the volunteers in this urban sample did not report increasingly severe FI or CMD during the peak of the 2008 food crisis. This is a counter-intuitive result that would not be predicted in analyses of population-level data such as those used in econometrics simulations. But when these results are linked to real people in specific urban ecologies, they can improve our understanding of the psychosocial consequences of food price shocks.
Keywords: Ethiopia, Food insecurity, Mental health, Volunteerism, Caregiving, Urban poor, Response shift
Introduction
The 2008 food crisis was the largest shock to the global economy since a similar food price shock occurred in the early 1970s. In mid-2008, global food prices had escalated rapidly to 150% of their 2006 prices, driven by a “perfect storm” of increased demand for food and biofuel crops, harvest shortfalls, rising petroleum costs, climate change, depreciation of the US dollar, and perhaps food price speculation (Dawe, 2008a, 2008b; Headey & Fan, 2008; Robles, Torero, & von Braun, 2009). While price increases were seen globally, the impact was predicted to be greater in low-income countries where poverty is combined with high spending on food as a proportion of total household expenditures (Ivanic & Martin, 2008; Zezza et al., 2008). This was true for Ethiopia, one of the world’s poorest countries, where food prices had been increasing since 2004, culminating in the 2008 spike. In fact, the available data led Ulimwengu, Workneh, and Paulos (2009) to conclude, “it is obvious.that since August 2004 the Ethiopia food price index has been consistently higher than the world index” (cf. International Monetary Fund, 2008; Loening, Durevall, & Birru, 2009). This situation prompted the government of Ethiopia to purchase wheat on the world market and provide it to urban households and millers at subsidized prices, starting in mid-2008.
A sharp rise in food prices may increase household food insecurity and cause distress among impoverished populations in low-income countries. Some researchers have attempted to predict the impact on population wellbeing by asking what proportion of households drop below conventional poverty lines given a set increase in grain prices (for a review, see Headey & Fan, 2008; cf. Deaton, 1989). Using existing national datasets, they attempt to model population heterogeneity in the impact of food price increases by stratifying according to urban and rural distinctions (food buying versus food producing and consuming) and income/asset levels. These policy studies often, but not always, predict that poor urban populations are hardest hit (contra Headey & Fan, 2008; Ivanic & Martin, 2008).
These modeling approaches have yielded influential policy-relevant insights about the links between rapid price increases, vulnerability, and poverty, but our understanding of the impact of food crises can be extended in three important ways. First, previous work notes but does not explore differential response or impact in unique samples. To say that urban populations are at risk says little about potentially substantial variation within urban populations. Such “hidden heterogeneity,” in regard to social ties, culture and behavior (e.g. livelihood), is typically ignored in econometrics predictions of food crisis outcomes that make use of population-level data (Headey & Fan, 2008).
Second, prior work does not capture how individuals actually experience food crises, but rather makes statistical predictions about what might happen in the face of rapid price increases. Thus, an important next step is to examine the lives of people as they negotiate rapid food price escalation. This approach requires the use of validated screening tools and ethnographic methods to document the psychosocially-mediated effects of food price shocks.
Third, existing studies of the 2008 food crisis have modeled the impact of food price increases on caloric intakes (FAO, 2008) or “welfare effects,” while media reports focused on urban food protests. While these are important outcomes, ethnographic studies suggest that mental health is also associated with food insecurity, and that this is driven in part by the uncertainty that is introduced into people’s lives as they struggle to meet their food needs. Such uncertainty is understood as a major contributor to anxiety and depression, which account for massive shares of the global disease burden (Hadley & Patil, 2006; Murray & Lopez, 1997; Pike, 2004). Coping strategies that buffer caloric intake might come with costs to mental health.
This study attempts to complement and extend existing research that assesses the impact of the 2008 food crisis by using qualitative and quantitative methods to examine the wellbeing of a cohort of poor community health volunteers living in Addis Ababa during the height of the crisis. In our quantitative analyses, we model two outcomes, household food insecurity (FI) and common mental disorders (CMD). FI is defined as insecure access to sufficient food for a healthy and active life (FAO, 2004). CMD is a syndrome characterized by depression, anxiety, panic, and somatic symptoms (Hanlon, Medhin, Alem, Araya, Abdulahi, Tesfaye, 2008).
Local setting
The individuals targeted here volunteer to fill critical human resource gaps in public health systems. Thus they differ from fellow urbanites in terms of livelihood. The AIDS care volunteer role in Addis Ababa positions our study participants amidst unique social networks of interaction and support, involving extremely deprived care recipients, other volunteers, and, as we will show, divine beings.
Addis Ababa is the capital of Ethiopia, with an estimated population exceeding 3 million (UN-HABITAT, 2008). In the face of a late-maturing HIV/AIDS epidemic (Iliffe, 2006; National Intelligence Council, 2002) and poorly-distributed public health services, volunteerism in community health care has grown substantially over the past decade in Addis Ababa, as in much of sub-Saharan Africa (SSA). Volunteer home-based care here is broadly similar to programs in settings throughout SSA (see Akintola, 2008a). Public health facilities rely heavily on the training of volunteers, who provide home-based palliative care, support drug adherence, and mediate patients’ access to clinical treatment and NGO assistance. Volunteers are not government health personnel; they are typically organized under NGOs, part of a civic society toward which Ethiopian governments past and present have been cooperative and antagonistic (Kloos, 1998). As Ethiopia prepared to launch free highly-active antiretroviral therapy (HAART) programs country-wide in 2005, home-based care was promoted under the widely-held assumption that it is economically imperative in settings of health professional scarcity (Ministry of Health, 2005; cf. Akintola, 2008a). Volunteers typically serve for a period of 18 months, caring for at least 5 non-kin patients, under the supervision of a local NGO. They develop close relationships with one or two patients, but maintain regular interaction with all of their assigned patients. After 18 months, patients are re-assigned to a new group of volunteer recruits, and “graduating” volunteers leave the service with unknown prospects for employment. A select few continue for another service term; an even smaller proportion gets promoted to modestly-salaried NGO positions. Volunteers receive about 5–10 USD/month to reimburse their transportation and telecommunications expenses. Some volunteers received food aid (usually wheat and cooking oil) as a stipend from their NGO. However, this practice was suspended in early-mid 2008.
Based on the above definitions of FI and CMD, we addressed several core questions. First, did rising food prices in Addis Ababa in 2008 lead to greater experience of FI and concomitant rise in CMD among volunteers in our sample? Second, do factors such as food aid, per capita income, or participation in microfinance clubs explain the observed patterns of self-reported FI and CMD symptoms? In answering these questions, we used generalized estimating equations that account for associations between responses given by the same participants over 3 survey rounds (February, July, and November 2008) to model longitudinal response profiles of FI, CMD symptoms, and covariates. We also analyzed qualitative data that contextualize the cognition and reporting behavior of caregivers in regard to FI and CMD. Although this study lacks data from a control group of non-volunteers, we exploit a key feature of the study design: the stratification of our sample according to whether a participant was a “newcomer” or “veteran” volunteer at baseline. Thus we addressed a third question: Is there a difference between newcomers and veterans in FI and CMD response profiles? This question is important for understanding how the uniqueness of the targeted population is potentially responsible for our results, and how our conclusions might generalize to community health volunteers in similar settings.
Methods
Sample
Surveys were administered to a sample of community AIDS care volunteers from two local NGOs, Hiwot HIV/AIDS Prevention, Control and Support Organization and Medhin Social Center, which provide home-based care for people with AIDS accessing treatment at a public hospital in southwest Addis Ababa (ALERT Hospital). Hiwot runs an Addis Ababa-wide AIDS care program, with thousands of volunteers. In contrast, Medhin is a small organization under the auspices of the Ethiopian Catholic Church, which focuses on neighborhoods adjacent to ALERT hospital. By including these two organizations, we intended that the sample would be more representative of community health volunteers in Addis Ababa. Four Ethiopian research assistants were trained for data collection at Rounds 1, 2, and 3. All data were collected by self-report. Data collection was conducted in pairs. Refresher training and the data collection “buddy system” aimed to maximize data quality. The study has been subject to appropriate ethical review in the United States (Emory University) and Ethiopia (Addis Ababa University Faculty of Medicine and the Armauer Hansen Research Institute/ALERT Hospital).
The sample included 110 volunteer caregivers (99 women and 11 men) of adult patients receiving treatment at ALERT Hospital. This gender ratio reflects the overwhelming proportion of women in the volunteer population. A random sample of 90 participants was drawn from the Hiwot NGO’s volunteer rosters, stratified by newcomer versus veteran status: 40 (out of 60) ‘newcomers’ who had just begun volunteering at the time of the baseline survey, and 50 (out of 70) ‘veterans’ who had all been volunteering for 12 months at the time of the baseline survey. We also included all 20 volunteer caregivers from Medhin, with an average service length of 11.7 months (±4.6, range: 4–22) at baseline. In our analyses, veterans from Hiwot and Medhin were combined as a sub-group of ‘Veterans’ (n = 70) to compare to the sub-group of ‘Newcomers’ (n = 40). A very small number of participants missed one or more survey rounds. 110 participants were surveyed at Round 1. At Round 2, 106 of the original 110 participants were surveyed, and at Round 3, 107 of the original 110 were again surveyed.
Outcome measures
A standard FI scale proposed for international use, the Household Food Insecurity Access Scale (HFIAS), was published in 2006 (Swindale & Bilinsky, 2006). We translated the 9-item HFIAS into Amharic, the lingua franca of Addis Ababa, then back-translated and revised. We pre-tested the revised Amharic tool among a convenience sample of six community volunteers who were not included in the subsequent study, and verified that they clearly comprehended and responded to each item. In the full study sample, participants were presented with ‘yes’ or ‘no’ response categories for each item. Responses pointing towards FI were coded as 1 and negative responses were coded as 0. In the interests of time and minimizing distress in responding to sensitive questions, we excluded the sub-questions related to frequency of occurrence in the published protocol (Coates, Swindale, & Bilinsky, 2007).
Participants’ households were classified into four levels of FI according to a scheme that closely parallels the published HFIAS protocol: 1) food-secure (participant answers ‘yes’ to none of the items); 2) mild FI (answers ‘yes’ to item 1 or 2 or 3 or 4, but not items 5–9); 3) moderate FI (answers ‘yes’ to item 5 or 6, but not items 7–9); and 4) severe FI (answers ‘yes’ to item 7 or 8 or 9). This scheme allows the reporting of FI (access) prevalence for each level of food insecurity and for mild, moderate and severe FI combined. Using this categorization scheme, the HFIAS performed well according to established validation criteria (Maes, Hadley, Tesfaye, Shifferaw, & Tesfaye, 2009).
To assess the distribution of CMD symptoms, we used a 29-item version of the WHO Self-Reporting Questionnaire (WHO, 1994), which incorporates 8 items derived from Amharic idioms of distress (e.g. feeling that someone has cursed you; feeling that your heart is beating too fast). The SRQF has been translated to Amharic, tested for content, construct and criterion validity (Zilber, Youngmann, Workneh, & Giel, 2004), and used in previous population research in Ethiopia (Hanlon Medhin, Alem, Araya, Abdulahi, Hughes, 2008). Participants were presented with ‘yes’ or ‘no’ response categories for each SRQF item/symptom. Affirmative responses were coded as 1 and negative responses as 0. The number of affirmative responses was summed to create an SRQF score (out of 29) for each individual at each round. Though the SRQF is not a diagnostic tool, a cutoff of 7/8 was determined by Zilber et al. (2004) to be optimal for screening CMD cases from urban Ethiopian populations, and is used in the present analysis.
Covariates
Participants reported age, gender, marital status (single, married, divorced/separated/widowed), and years of formal schooling. We categorized participants according to whether they had major responsibilities in their household food economy: that is, we distinguished between dependents living with parents or guardians, versus male and female heads of household and females living with parents but sharing food economy responsibilities (shopping and cooking). Participants reported whether they were members of traditional finance-pooling clubs called ïqub. An ïqub typically comprises a group of friends or co-workers who pool an amount of money monthly, and one member takes the sum in turn.
Participants estimated monthly household incomes at all three rounds. At Rounds 2 and 3, participants reported household composition (i.e. adults and children regularly sleeping and eating in the house). At each round, estimated household incomes were divided by the total number of people in the household to yield monthly household per capita incomes in Ethiopian Birr/mo (converted to USD/mo using a rounded exchange rate of 10 Birr to 1 USD). Household composition was not reported at Round 1. Since average household composition did not change between Rounds 2 and 3, we assumed that it also had not changed from Round 1 to Round 2. Thus we divided household incomes reported at Round 1 by the total number of people in the household at Round 2.
Participants answered three dichotomous questions addressing household economic coping “to fulfill basic needs” in the past three months: 1) starting a new income-generating activity, 2) selling household goods, and 3) keeping students home from school to help in income-generation or food preparation. We categorized participants according to whether they or anyone in their households engaged in one or more of these coping measures versus none in the three months prior to survey.
At each round, participants reported whether they were receiving free food aid from non-governmental organizations, and what kinds of foods they were receiving. Wheat grain or flour was the most common type of food aid reported; in 2007 and the first part of 2008, free wheat was accessed often from NGOs like Hiwot and Medhin, and was commonly traded for cash by recipients. We categorized participants based on whether they were receiving free wheat at the time of the survey.
At each round, participants reported their total number of care recipients, whether they were caring for at least one bedridden care recipient, and the total number of hours per week spent in volunteer activities.
Data analysis
Generalized estimating equations (GEE) accounting for intra-individual association of repeated measures, using the GENMOD procedure in SAS, were used to observe the bivariate and multivariate associations of independent variables and round of measurement with dichotomous outcomes (food insecurity and SRQF score ≥8). For multivariate analyses of both outcomes, we first determined whether a significant difference existed in the FI and CMD response profiles of newcomer versus veteran volunteers, i.e. an interaction between group and time. If the interaction term was not significant, we dropped it and examined the main effect of round. We then included per capita income and other covariates to examine whether they were associated with the outcome, and how they affected the parameter estimate for the interaction between newcomer status and round or the main effect of round. In modeling the outcome SRQF score ≥8, we included FI severity level as an independent variable. SAS (v 9.2) was used to conduct all analyses.
Ethnographic methods
Participant observation was conducted by the lead author in neighborhoods adjacent to ALERT Hospital, including attendance at volunteer trainings, caregiver and care recipient homes, and volunteers’ reporting and planning meetings, over 20 months between May 2007 and January 2009. A purposive sample of 13 volunteer caregivers (7 newcomers [5 female and 2 male], and 6 veterans [5 female and 1 male]) were recruited to complete a series of up to seven semi-structured interviews assessing motivations, costs and benefits of volunteering, food insecurity, care relationships, and wellbeing. Interviews occurred over 8 months in 2008. Analysis involved an iterative process of identifying emergent themes and grouping data into a priori and in vivo coded categories. Here, we present important themes that aid interpretation of quantitative findings on FI and CMD response profiles.
Findings
Qualitative findings
Participants in our sample clearly recognized that they and their care recipients suffer from an array of experiences subsumed under the construct of food insecurity. As one caregiver, a single mother, said, “The thing that only God and I know [is that] yesterday my children went without taking any food – nothing. I had some shoes in my house. I wanted to sell the shoes [in order to] prepare some lunch for them.” Another caregiver referred to the food insecurity and distress of one of his care recipients: “[T]here is a woman who [only] boils beans [for her family’s meals]. She is raising two children without a father… Because life now gets expensive, that troubles her mind”.
Qualitative results also pointed to positive effects on wellbeing that come with being an AIDS care volunteer, a role that positioned informants within unique social networks involving other volunteers, patients, and divine beings. The representative quotes from informants listed in Table 1 highlight cultural values that emphasize 1) empathy for those “lower” or more vulnerable, 2) reciprocity involving humans and divine entities (God, saints), and 3) mental satisfaction with helping others.
Table 1.
Quotes from semi-structured interviews
| Profile | Quote |
|---|---|
| Single man, age 35, veteran volunteer caregiver |
“[Being] a volunteer caregiver… will get you to think something good for human beings… and you will sympathize with human beings… Sometimes I will get aid from NGOs [in return for volunteering]; but you have to forget this thing. By believing in God…and doing God’s work, you can live.” (May 8, 2008) |
| Single mother, age 32, veteran volunteer caregiver |
“In all my life, what makes me the happiest…is [to see those patients] being human – being able to work and feed themselves. He is now selling second-hand clothes. She is now sewing. We are now good sisters and brothers, and I am very happy.” (October 7, 2008) |
| Young wife and mother, HIV+, newcomer volunteer caregiver |
“What motivated me to be a caregiver? First, I myself am, of course, a patient [i.e. living with HIV/AIDS]. And second, to see others’ pains like my own [and] understand how many hurt people there are. If I am not benefiting in my own way, I will get something from God. God will pay me [back for] my weariness.” (May 20, 2008) |
| Young woman from wealthier background, newcomer volunteer caregiver |
“I am working with happiness – I convinced myself for that. And because [other volunteer caregivers] are of lower economic status [than I am]…I make myself lower [i.e. humble myself]… and work together with them. That makes me very happy. It is also good for my mind.” (Oct. 17, 2008) |
As “followers” of Christianity, the religion with which 97% of participants self-identified (the vast majority of Ethiopian Orthodox denomination), volunteers often expressed expectations of divine rewards for helping others as an important motivation to volunteer. All informants expressed mental satisfaction in reaction to improvement in the health of care recipients. In the discussion, we address how these findings aid our interpretation of the quantitative results that follow.
Quantitative findings
Cronbach’s alpha (raw) for the HFIAS was 0.85, 0.84, and 0.83 at Rounds 1, 2, and 3, respectively. For the SRQF, Chronbach’s alpha was 0.89, 0.90, and 0.90. As illustrated in Table 2, at baseline, average age was 27.7 years (±6.2, range: 18–45) and average schooling was 10.3 years (±2.6). Newcomers were significantly more likely to be male (P < 0.01), due in part to recent recruiting practices that target men. Compared to veterans, newcomers were also significantly more likely to be unmarried (P = 0.04).
Table 2.
Sample descriptive statistics, by newcomer status
| Veterans (n = 70) |
Newcomers (n = 40) |
p-value | All (n = 110) |
|
|---|---|---|---|---|
| Age at baseline, years | 28.2 (±5.9) | 26.9 (±6.6) | 0.31 | 27.7 ± 6.2 |
| Female gender, % | 95.7 | 80.0 | <0.01 | 90.0 |
| Schooling at baseline, years | 10.1 (±2.3) | 10.7 (±2.6) | 0.20 | 10.3 ± 2.6 |
| Marital status at baseline, % | 0.04 | |||
| Married | 42.9 | 37.5 | 40.9 | |
| Unmarried | 25.7 | 47.5 | 33.6 | |
| Separated/divorced/widowed | 31.4 | 15.0 | 25.5 |
Summary statistics are listed by round of measurement in Table 3. Average monthly per capita income was $11.31 (±$12.49) at Round 1 and $12.49 (±$10.14) at Round 3, a statistically non-significant gain of about $0.04 USD/day. The average number of people living in participant households at Rounds 2 and 3, when data were collected, was 4.6 (±2.1) and 4.5 (±2.0), respectively. The percentage of participants whose households received free wheat as aid dropped from 38% at Round 1 to 8% by Round 3 (P < 0.0001). Participating in ïqub was fairly steady over the three rounds (8.5–10%), as was engaging in at least one economic coping measure (19–25%); the most common of these coping measures was starting a new income-generating activity. The percentage of participants who held major responsibilities in the household food economy was 77.6%. The average number of care recipients per participant was fairly constant (12–14), as was the percentage of participants who cared for at least one bedridden care recipient (20–30%). Hours/week spent volunteering was 13.4 (±6.0) at Round 1 and about 16 at Rounds 2 and 3. Because workload statistics at Round 1 did not include newcomers (they had just begun the service), we did not calculate p-values for these variables.
Table 3.
Selected summary statistics, by round of measurement
| Round |
||||
|---|---|---|---|---|
| Feb/March 2008 | July/Aug 2008 | Nov/Dec 2008 | p-value | |
| Estimated per capita household income, USD/Month | 11.31 ± 12.49 | 11.38 ± 10.63 | 12.49 ± 10.14 | 0.3 |
| Household composition, people | – | 4.6 ± 2.1 | 4.5 ± 2.0 | 0.6 |
| Food-secure | 17.3 | 22.6 | 21.5 | 0.4 |
| Food-insecure – mild | 21.8 | 26.4 | 30.8 | 0.1 |
| Food-insecure – moderate | 39.1 | 34.0 | 29.9 | 0.1 |
| Food-insecure – severe | 21.8 | 17.0 | 17.8 | 0.3 |
| Engaged in one or more economic | ||||
| Coping measures in past 3 months, % | 24.6 | 18.9 | 22.4 | 0.7 |
| Started new income-generating activity, % | 18.2 | 8.5 | 16.8 | 0.8 |
| Sold household goods, % | 6.4 | 8.5 | 7.5 | 0.7 |
| Kept students home to help prepare food, % | 0.9 | 5.7 | 2.8 | 0.3 |
| In charge of household food economy, % | 77.6 | – | – | – |
| Receiving wheat as food support, % | 38.2 | 18.9 | 8.4 | <0.0001 |
| Member of ïqub, % | 10.0 | 8.5 | 10.4 | 0.9 |
| SRQF score | 6.9 ± 5.9 | 6.2 ± 5.9 | 5.0 ± 5.5 | 0.004 |
| Number of care recipients | 11.7 ± 5.1 | 13.2 ± 6.2 | 14.0 ± 7.8 | – |
| At least one bedridden care recipient, % | 19.7 | 28.6 | 20.4 | – |
| Hours per week | 13.4 ± 6.0 | 16.1 ± 8.1 | 16.2 ± 9.8 | – |
In July 2008, the average prices of sorghum (white and red), wheat (white), maize, teff (red), and barley (white and mixed) had risen roughly 80% over their February 2008 levels, and during December 2008 were lower but still 54% over their February 2008 levels (lead author’s calculations from data provided by the Ethiopian Commodity Exchange, 2008; cf. Ulimwengu et al., 2009). Despite this marked increase in food prices over and above any seasonal cycles to which city-dwellers might be accustomed, at Round 2 the prevalence of moderate and severe FI had dropped to 50.9% from its Round 1 level of 60.9%, and dropped again slightly at Round 3 to 47.7% (P < 0.01). Thus, over time, participants were less likely to report moderate and severe FI and more likely to report mild FI and food security. The percentage of participants who reported at least 8 SRQF symptoms dropped over the study period, from 37.3% at Round 1 to 25.2% at Round 3 (P = 0.03). SRQF scores decreased from 6.9 (±5.9) at Round 1 to 5.0 (±5.5) at Round 3 (P = 0.004). Fig. 1 illustrates the important mismatch between the trends in average market price of seven grains in Addis Ababa and participants’ reports of moderate and severe FI and CMD symptoms. Fig. 1 also illustrates the link between FI and CMD.
Fig. 1.
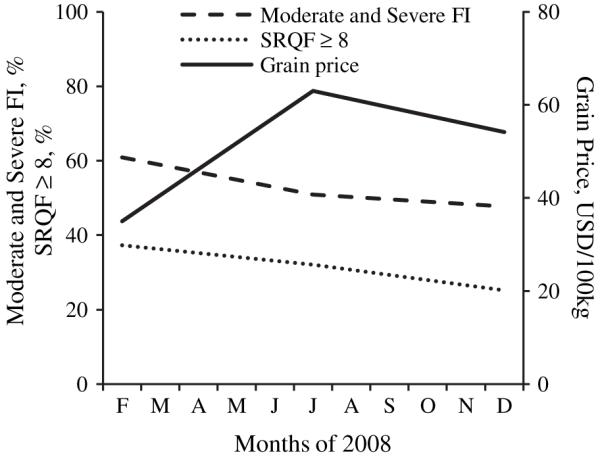
Combined moderate and severe FI prevalence (%), SRQF ≥ 8 (%) and average grain prices (USD/100 kg) in Addis Ababa.
Regression outcomes
Food Insecurity (FI)
Household per capita income was inversely associated with FI (P < 0.001). Not having major responsibilities in the household food economy (P < 0.05) independently reduced the likelihood of FI. Round of measurement was not associated with FI after the inclusion of covariates. Fig. 2 illustrates the difference between newcomer and veteran volunteers in combined mild, moderate, and severe FI prevalence. At baseline, newcomers and veterans did not differ in their reports of FI (P = 0.15). Yet by Round 2, newcomers were less likely to report FI (P < 0.05); therefore, the interaction term was included in the multivariate model summarized in Table 4. The interaction between round and newcomer status remained significant (P < 0.05) after the inclusion of covariates.
Fig. 2.
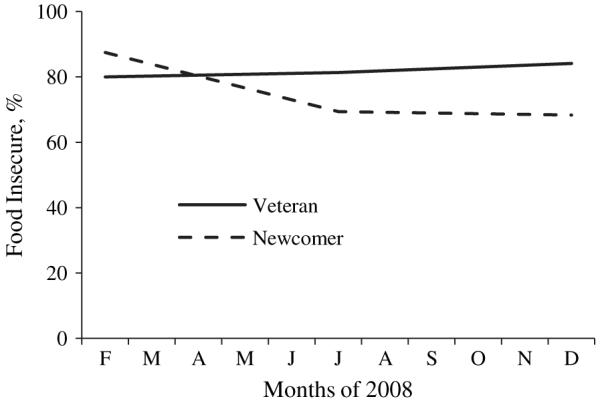
Combined mild, moderate and severe FI prevalence (%) as a function of Newcomer status and round of measurement.
Table 4.
Multivariate GEE results predicting dichotomous outcome of food insecurity (standard errors in parentheses)
| Model 1 | Model 2 | |
|---|---|---|
| Intercept | 2.21 (0.55)**** | 3.57 (2.14) |
| Newcomer × Round | −0.66 (0.27)* | −0.74 (0.36)* |
| Newcomer | −0.98 (0.68) | −1.69 (0.91)† |
| Round | −0.52 (0.12)** | −0.42 (0.26) |
| Household per cap income (Birr/month) | −0.01 (0.00)*** | |
| Male gender | 0.60 (0.74) | |
| Education (yrs) | 0.03 (0.09) | |
| Age (yrs) | 0.03 (0.06) | |
| No economic coping measures | −0.14 (0.32) | |
| No wheat as food support | −0.21 (0.42) | |
| Single | −0.77 (0.94) | |
| Married | −1.69 (1.00)† | |
| Divorced/separated/widowed (ref) | – | |
| Not member of ïqub | 0.48 (0.43) | |
| Not in charge of household food econ | −1.86 (0.74)* |
Indicates p < 0.10
indicates p < 0.05
indicates p < 0.01
indicates p < 0.001
indicates p < 0.0001.
Common Mental Disorder (CMD) symptoms
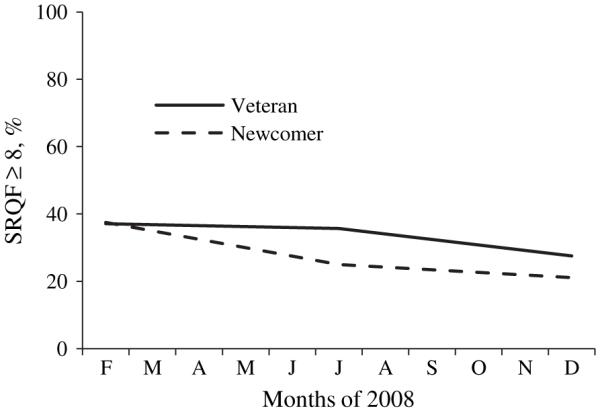
The most important result from this model is that FI severity was associated with SRQF score in a dose-response manner: participants reporting mild, moderate, and severe FI were increasingly likely to report SRQF scores ≥8 (Table 5). Participants that engaged in economic coping measures were more likely to report SRQF scores ≥8. At baseline, newcomers and veterans did not differ in the percentage of participants who reported SRQF scores ≥8. The apparently stronger improvement among newcomers in Fig. 3 was not significant; therefore, the interaction term was dropped from the model. No caregiver workload variable was associated with the outcome.
Table 5.
Multivariate GEE results predicting dichotomous outcome SRQF score ≥ 8 (standard errors in parentheses)
| Model 1 | Model 2 | |
|---|---|---|
| Intercept | −0.37 (0.37) | 1.87 (1.84) |
| Newcomer × round | – | – |
| Newcomer | −0.20 (0.36) | 0.16 (0.48) |
| Round | −0.26 (0.12)* | −0.20 (0.18) |
| Food-secure | −4.31 (0.83)**** | |
| Food-insecure – mild | −1.93 (0.47)**** | |
| Food-insecure – moderate | −0.86 (0.33)** | |
| Food-insecure – severe (ref) | – | |
| Household per cap income (Birr/month) | 0.00 (0.00) | |
| Male gender | −0.07 (0.82) | |
| Education (yrs) | 0.02 (0.07) | |
| Age (yrs) | −0.00 (0.04) | |
| No economic coping measures | −1.21 (0.36)*** | |
| No wheat as food support | −0.06 (0.40) | |
| Single | 0.18 (0.57) | |
| Married | 0.32 (0.42) | |
| Divorced/separated/widowed (ref) | – | |
| Not member of ïqub | −0.05 (0.50) | |
| Not in charge of household food econ | 0.27 (0.69) | |
| Number of care recipients | −0.00 (0.03) | |
| No bedridden care recipients | −0.47 (0.34) | |
| Hours per week | −0.01 (0.02) |
indicates p < 0.05
indicates p < 0.01
indicates p < 0.001
indicates p < 0.0001.
Fig. 3.
SRQF ≥ 8 as a function of Newcomer status and round of measurement.
Discussion
This longitudinal observational study took place in deprived neighborhoods of Addis Ababa during the 2008 food crisis, when the economic status of already poor people is hypothesized to have deteriorated in the face of rising food costs and disappearing food aid (International Monetary Fund, 2008; Ulimwengu et al., 2009). Our data clearly show that food insecurity was highly prevalent among AIDS care volunteers, and that FI was associated with household economic factors and mental health. We have shown elsewhere that FI in this sample was associated with lower dietary diversity (Maes et al., 2009). Importantly, these findings demonstrate that FI is not only a rural issue. Addis Ababa is just one example of an urban center with a large class of underemployed (Serneels, 2007), chronically food-insecure (Gebre-Egziabher et al., 1994; Smith, Alderman, & Aduayom, 2006), and resource-strapped households. In general, households experience food insecurity not because food is unavailable, but because they cannot afford to buy food (cf. Sen, 1981). Our data clearly have implications that extend to urban settings in Africa with large community health volunteer workforces, and the more than 50% of the global population that now lives in urban centers (UN-HABITAT, 2008).
And yet, this urban sample did not report increasingly severe FI or CMD during the peak of the 2008 food crisis. This is a counter-intuitive result that would not be predicted in econometrics simulations using population-level data. But when linked to real people in specific urban ecologies, these results improve our understanding of the consequences of food price shocks.
Why did participants in this poor urban sample seem buffered from the local food crisis?
Food insecurity is a key sub-domain of the quality-of-life construct (QOL). Response shifts in QOL measures are expected in longitudinally-repeated self-report surveys – if and when participants are undergoing experiences that encourage re-evaluations of personal health and/or social status (Sprangers & Schwartz, 1999). Response shift is considered a marker of cognitive and affective adaptation in which meanings, standards, and social comparisons change along with the practice of altruistic care (Gibbons, 1999; Schwartz & Sendor, 1999; Sprangers & Schwartz, 1999). The sufficiency of accessible food is a potentially subjective assessment, sensitive to shifting internal standards and social comparisons. We argue that since volunteer caregivers repeatedly interact with care recipients (and other volunteers) who are perceived to be poorer and hungrier, FI is prone to response shifts in this sample.
That response shift at least partly explains the trend in FI in this sample is supported by our observation that newcomers were more likely than were veterans to report improved FI status at Rounds 2 and 3, because we expect newcomers to be affected more strongly by their new role. We find additional support for the response shift hypothesis from semi-structured interviews, which allowed us to probe participants’ experiences and values related to volunteer caregiving, poverty, and FI. Narratives provided insights into the material and psychological costs and rewards involved in volunteer caregiving, and the mechanisms (including divine) by which costs are exacted and rewards are meted. The shifting of internal standards and social comparisons related to FI is not necessarily a conscious process (Sprangers & Schwartz, 1999), but it is implied in statements about empathizing with the struggles of patients and other volunteers, an emotional habit that was reinforced by expectations of divine reward and ongoing interaction between volunteers and care recipients.
Can we unite theories of volunteerism, FI, and CMD to explain why volunteer caregivers in Addis Ababa did not report worsening food insecurity and mental distress during the worst food crisis in recent history? Recently, regression analysis of data on self-reported health and happiness of religious volunteers and non-volunteers in the USA provided evidence of a positive, causal influence of religious volunteering on happiness (Borgonovi, 2008). Volunteerism and altruistic behavior have been studied for their hypothesized effects on wellbeing, with longitudinal data showing that adult volunteers enjoy better physical health and lower risk of mortality (Piliavin, 2003; Post, 2005; Thoits & Hewitt, 2001). Oman, Thoreson, and McMahon (1999) suggest these outcomes stem from the reduction of destructive self-absorption by the altruistic features of volunteerism, mediated by supportive relationships (Holt-Lunstad, Uchino, Smith, & Hicks, 2007) in which empathy thrives (Mikulincer, Shaver, Gillath, & Nitzberg, 2005). Volunteer care relationships, like all relationships, are mediated by neuroendocrine mechanisms with links to cardiovascular and immune function (Kiecolt-Glaser, McGuire, Robles, & Glaser, 2002; Seeman et al., 2004). There are probably bidirectional arrows among psychological altruism, empathy, and increased wellbeing (Batson & Shaw, 1991; Cohn & Fredrickson, 2006).
Perhaps this helps to explain why SRQF scores did not worsen over time in this sample. Mental health could have been buffered from stressors by the psychological benefits mediated by volunteers’ unique social networks, while response shift, also mediated by volunteers’ social networks, at least partly explains the surprising pattern in FI. We found that FI severity was associated with high SRQF scores in a dose-response manner. Biocultural anthropologists employ a feedback model between FI and CMD, in which stressful experiences like FI lead to anxiety/depression, while the experience of more CMD symptoms prevents or inhibits individuals from engaging in FI-mitigating strategies (Weaver & Hadley, 2009). Some researchers have attempted to test these alternative pathways (e.g., Heflin, Siefert, & Williams, 2005). However, the directionality of effects between FI and CMD is beyond the scope of this paper.
Alternative explanations
We ultimately cannot rule out alternative explanations for the FI response profiles observed here, in particular potential biases introduced by our longitudinal, community-based design. There are at least two plausible alternative explanations for our results. First, we considered the assumption of stochasticity in reported FI. FI is an example of a time-varying covariate that participants can intentionally alter – a potential source of bias in observational research (Fitzmaurice, Laird, & Ware, 2004). However, FI-mitigating behaviors are not totally voluntary; they are heavily constrained by socioeconomic factors.
Bias would also be introduced if participants changed their responses according to changing expectations of the researcher-participant relationship. It is possible that at Round 1, participants expected that the researchers would use their answers to determine eligibility to receive aid. We attempted to minimize such expectations while obtaining informed consent from participants. Still, some may have maintained such expectations, leading them to report more severe FI at Round 1. After Round 1, participants may have become convinced that the researchers would not give aid, and thus were less inclined to report FI in hopes of receiving aid.
Implications and future questions
Headey and Fan (2008) argued that policy researchers have provided useful but limited insights into which types of households are most vulnerable to rising food prices. This study suggests that social networks can buffer the full psychological effects of a food crisis if they include relationships that provide for downward social comparisons and/or mental satisfaction through giving care to nonkin. Keys limitations of our study are that we did not explore caregivers’ social networks of resource exchange in greater depth, their patterns of borrowing or spending from personal savings, or their access to government-subsidized wheat; these could help differentiate the roles of material versus psychological resources in the processes that apparently buffered this population. Nevertheless, our data support the conclusion that social networks of psychological support and exchange matter; policy-makers need to recognize this.
Our longitudinal results do not negate our important cross-sectional findings, which highlight the concrete socioeconomic challenges and high rate of food insecurity faced by urban-dwellers in our sample. The households of these AIDS care volunteers, who fill critical human resource gaps in public health systems, were often moderately to severely food-insecure even prior to the peak of the food crisis. Across SSA, AIDS care volunteers are crucial to local and global economies of care, especially in the age of HAART (Akintola, 2008a; Ogden, Esim, & Grown, 2006). They tend to have few opportunities for employment; nevertheless they engage in volunteer activities that do not ostensibly support their food security. They are usually women, who are often socioeconomically marginalized, at increased risk of HIV-related stigmatization (Bond, 2006), and at increased risk for CMD (Desjarlais, Esienberg, Good, & Kleinman, 1995; Hanlon et al., 2009; Heflin et al., 2005; Patel, Araya, de Lima, Ludermir, & Todd, 1999). In SSA, both family and volunteer caregivers for people with TB and AIDS may be over-burdened and at increased risk of CMD (Akintola, 2008b; Orner, 2006; WHO, 2002). Future research will help to determine whether our results reflect a general pattern of FI and CMD among community health volunteers in other settings characterized by high rates of unemployment.
This discussion provokes important policy questions: should the apparent resilience of our study population be supported with food or other material aid? Should they be relieved of their duties with efforts to put care and support in the hands of paid professionals? Or should they become paid community health workers (cf. Kim & Farmer, 2006; Pfeiffer et al., 2008; Swidler & Watkins, 2009)? Answers to these questions are beyond the scope of this paper. We emphasize that debate over the rights of food-insecure volunteers to receive remuneration for their labor and over the sustainability of volunteer-based programs will be aided by mixed ethnographic and quantitative research that characterizes the economic and psychosocial costs and benefits of the volunteer role in various settings.
Future studies should also address links among FI, food crisis, response shift, and the potential benefits of altruism. Response shift in this context is understood as adaptation to not only illness, but also poverty as a widespread condition of material deprivation that constrains the means to achieve health and socioeconomic goals. Future research should use rigorous, mixed-methods study designs, involving control groups and longitudinally-repeated measures where possible, multiple measures of constructs such as FI, non-invasive biomarkers of distress, and control variables such as social networks of support, negative life events, self-efficacy, and adult attachment security. In-depth life history interviews, multilevel modeling and cultural consensus analysis will effectively contribute to this avenue of research.
Acknowledgements
Data collection was supported by the National Science Foundation (Cultural Anthropology Dissertation Improvement Grant #0752966), the Emory University Global Health Institute, and the Emory AIDS International Training and Research Program (NIH/FIC D43 TW01042). We gratefully acknowledge Peter J. Brown, Ronald Barrett, Jed Stevenson, and the anonymous reviewers for their insights on this paper.
References
- Akintola O. Unpaid HIV/AIDS care in southern Africa: forms, context, and implications. Feminist Economics. 2008a;14(4):117–147. [Google Scholar]
- Akintola O. Defying all odds: coping with the challenges of volunteer caregiving for patients with AIDS in South Africa. Journal of Advanced Nursing. 2008b;63(4):357–365. doi: 10.1111/j.1365-2648.2008.04704.x. [DOI] [PubMed] [Google Scholar]
- Batson C, Shaw L. Evidence for altruism: toward a pluralism of prosocial motives. Psychological Inquiry. 1991;2(2):107–122. [Google Scholar]
- Bond V. Stigma when there is no other option: understanding how poverty fuels discrimination toward people living with HIV in Zambia. In: Gillespie S, editor. AIDS, poverty, and hunger: Challenges and responses. International Food Policy Research Institute; Washington, DC: 2006. pp. 181–198. [Google Scholar]
- Borgonovi F. Doing well by doing good: the relationship between formal volunteering and self-reported health and happiness. Social Science & Medicine. 2008;66(11):2321–2334. doi: 10.1016/j.socscimed.2008.01.011. [DOI] [PubMed] [Google Scholar]
- Coates J, Swindale A, Bilinsky P. Household food insecurity access scale (HFIAS) for measurement of food access: Indicator guide. USAID; Washington, DC: 2007. [Google Scholar]
- Cohn M, Fredrickson B. Beyond the moment, beyond the self: shared ground between the selective investment theory and the broaden-and-build theory of positive emotions. Psychological Inquiry. 2006;17(1):39–44. [Google Scholar]
- Dawe D. Have recent increases in international cereal prices been transmitted to domestic economies? The experience in seven large Asian countries. Food and Agriculture Organization of the United Nations; Rome, Italy: 2008a. [Google Scholar]
- Dawe D. The unimportance of “low” world grain stocks for recent world price increases. Food and Agriculture Organization of the United Nations; Rome, Italy: 2008b. [Google Scholar]
- Deaton A. Rice prices and income distribution in Thailand: a non-parametric analysis. Economic Journal. 1989;99(395):1–37. [Google Scholar]
- Desjarlais R, Esienberg L, Good B, Kleinman A. World mental health: Problems and priorities in low-income countries. Oxford University Press; New York: 1995. [Google Scholar]
- Ethiopian Commodity Exchange Historical market prices. 2008 http://www.ecx.com.et/HistoricalPrice.aspx.
- Fitzmaurice G, Laird N, Ware J. Applied longitudinal analysis. Wiley-Interscience; Hoboken, NJ: 2004. [Google Scholar]
- Food and Agriculture Organization of the United Nations . The state of food insecurity in the world. FAO; Rome: 2004. [Google Scholar]
- Food and Agriculture Organization of the United Nations . Number of hungry people rises to 963 million. FAO; Rome: 2008. [Google Scholar]
- Gebre-Egziabher A, Lee-Smith D, Maxwell D, Memon PA, Mougeot L, Sawio C. Cities feeding people: An examination of urban agriculture in east Africa. International Development Research Centre; Ottawa: 1994. [Google Scholar]
- Gibbons F. Social comparison as a mediator of response shift. Social Science & Medicine. 1999;48(11):1517–1530. doi: 10.1016/s0277-9536(99)00046-5. [DOI] [PubMed] [Google Scholar]
- Hadley C, Patil C. Food insecurity in rural Tanzania is associated with maternal anxiety and depression. American Journal of Human Biology. 2006;18(3):359–368. doi: 10.1002/ajhb.20505. [DOI] [PubMed] [Google Scholar]
- Hanlon C, Medhin G, Alem A, Araya M, Abdulahi A, Hughes M, et al. Detecting perinatal common mental disorders in Ethiopia: validation of the self-reporting questionnaire and Edinburgh postnatal depression scale. Journal of Affective Disorders. 2008;108:251–262. doi: 10.1016/j.jad.2007.10.023. [DOI] [PubMed] [Google Scholar]
- Hanlon C, Medhin G, Alem A, Araya M, Abdulahi A, Tesfaye M, et al. Measuring common mental disorders in women in Ethiopia: reliability and construct validity of the comprehensive psychopathological rating scale. Social Psychiatry and Psychiatric Epidemiology. 2008;43(8):653–659. doi: 10.1007/s00127-008-0342-0. [DOI] [PMC free article] [PubMed] [Google Scholar]
- Hanlon C, Medhin G, Alem A, Tesfaye F, Lakew Z, Worku B, et al. Impact of antenatal common mental disorders upon perinatal outcomes in Ethiopia: the P-MaMiE population-based cohort study. Tropical Medicine & International Health. 2009;14(2):156–166. doi: 10.1111/j.1365-3156.2008.02198.x. [DOI] [PubMed] [Google Scholar]
- Headey D, Fan S. Anatomy of a crisis: The causes and consequences of surging food prices. International Food Policy Research Institute (IFPRI); Washington, DC: 2008. [Google Scholar]
- Heflin C, Siefert K, Williams D. Food insufficiency and women’s mental health: findings from a 3-year panel of welfare recipients. Social Science & Medicine. 2005;61(9):1971–1982. doi: 10.1016/j.socscimed.2005.04.014. [DOI] [PubMed] [Google Scholar]
- Holt-Lunstad J, Uchino B, Smith T, Hicks A. On the importance of relationship quality: the impact of ambivalence in friendships on cardiovascular functioning. Annals of Behavioral Medicine. 2007;33(3):278–290. doi: 10.1007/BF02879910. [DOI] [PubMed] [Google Scholar]
- Iliffe J. The African AIDS epidemic: A history. Ohio University Press; Athens, Ohio: 2006. [Google Scholar]
- International Monetary Fund . The federal democratic Republic of Ethiopia: Selected issues. International Monetary Fund (IMF); Washington, DC: 2008. [Google Scholar]
- Ivanic M, Martin W. Implications of higher global food prices for poverty in low-income countries. World Bank; Washington, DC: 2008. [Google Scholar]
- Kiecolt-Glaser J, McGuire L, Robles T, Glaser R. Emotion, morbidity, and mortality: new perspectives from psychoneuroimmunology. Annual Review of Psychology. 2002;53:83–107. doi: 10.1146/annurev.psych.53.100901.135217. [DOI] [PubMed] [Google Scholar]
- Kim J, Farmer P. AIDS in 2006 – moving toward one world, one hope? New England Journal of Medicine. 2006;355(7):645–647. doi: 10.1056/NEJMp068166. [DOI] [PubMed] [Google Scholar]
- Kloos H. Primary health care in Ethiopia under three political systems: community participation in a war-torn society. Social Science & Medicine. 1998;46(4–5):505–522. doi: 10.1016/s0277-9536(97)00194-9. [DOI] [PubMed] [Google Scholar]
- Loening J, Durevall D, Birru Y. Inflation dynamics and food prices in an agricultural economy: The case of Ethiopia. World Bank; Washington, DC: 2009. [Google Scholar]
- Maes K, Hadley C, Tesfaye F, Shifferaw S, Tesfaye Y. Food insecurity among volunteer AIDS caregivers in Addis Ababa, Ethiopia was highly prevalent but buffered from the 2008 food crisis. The Journal of Nutrition. 2009;139(9):1758–1764. doi: 10.3945/jn.109.108548. [DOI] [PubMed] [Google Scholar]
- Mikulincer M, Shaver P, Gillath O, Nitzberg R. Attachment, caregiving, and altruism: boosting attachment security increases compassion and helping. Journal of Personality and Social Psychology. 2005;89(5):817–839. doi: 10.1037/0022-3514.89.5.817. [DOI] [PubMed] [Google Scholar]
- Ministry of Health, Federal Democratic Republic of Ethiopia . Guideline for implementation of antiretroviral therapy in Ethiopia. Addis Ababa: 2005. [Google Scholar]
- Murray C, Lopez A. Mortality by cause for eight regions of the world: global burden of disease study. Lancet. 1997;349(9061):1269–1276. doi: 10.1016/S0140-6736(96)07493-4. [DOI] [PubMed] [Google Scholar]
- National Intelligence Council . The next wave of HIV/AIDS: Nigeria, Ethiopia, India, and China. National Intelligence Council; Washington, DC: 2002. [Google Scholar]
- Ogden J, Esim S, Grown C. Expanding the care continuum for HIV/AIDS: bringing carers into focus. Health Policy and Planning. 2006;21(5):333–342. doi: 10.1093/heapol/czl025. [DOI] [PubMed] [Google Scholar]
- Oman D, Thoreson C, McMahon K. Volunteerism and mortality among community-dwelling elderly. Journal of Health Psychology. 1999;4:301–316. doi: 10.1177/135910539900400301. [DOI] [PubMed] [Google Scholar]
- Orner P. Psychosocial impacts on caregivers of people living with AIDS. AIDS Care. 2006;18(3):236–240. doi: 10.1080/09540120500456565. [DOI] [PubMed] [Google Scholar]
- Patel V, Araya R, de Lima M, Ludermir A, Todd C. Women, poverty and common mental disorders in four restructuring societies. Social Science & Medicine. 1999;49(11):1461–1471. doi: 10.1016/s0277-9536(99)00208-7. [DOI] [PubMed] [Google Scholar]
- Pfeiffer J, Johnson W, Fort M, Shakow A, Hagopian A, Gloyd S, et al. Strengthening health systems in poor countries: a code of conduct for nongovernmental organizations. American Journal of Public Health. 2008;98(12):2134–2140. doi: 10.2105/AJPH.2007.125989. [DOI] [PMC free article] [PubMed] [Google Scholar]
- Pike I. The biosocial consequences of life on the run: a case study from Turkana District, Kenya. Human Organization. 2004;63(2):221–235. [Google Scholar]
- Piliavin J. Doing well by doing good: benefits for the benefactor. In: Keyes C, Haidt J, editors. Flourishing: Positive psychology and the life well-lived. American Psychological Association; Washington, DC: 2003. pp. 227–247. [Google Scholar]
- Post S. Altruism, happiness, and health: it’s good to be good. International Journal of Behavioral Medicine. 2005;12(2):66–77. doi: 10.1207/s15327558ijbm1202_4. [DOI] [PubMed] [Google Scholar]
- Robles M, Torero M, von Braun J. When speculation matters. International Food Policy Research Institute (IFPRI); Washington, DC: 2009. [Google Scholar]
- Schwartz C, Sendor R. Helping others helps oneself: response shift effects in peer support. Social Science & Medicine. 1999;48:1563–1575. doi: 10.1016/s0277-9536(99)00049-0. [DOI] [PubMed] [Google Scholar]
- Seeman T, Glei D, Goldman N, Weinstein M, Singer B, Lin Y-H. Social relationships and allostatic load in Taiwanese elderly and near elderly. Social Science & Medicine. 2004;59:2245–2257. doi: 10.1016/j.socscimed.2004.03.027. [DOI] [PubMed] [Google Scholar]
- Sen A. Poverty and famines: An essay on entitlement and deprivation. Oxford University Press; Oxford: 1981. [Google Scholar]
- Serneels P. The nature of unemployment among young men in urban Ethiopia. Review of Development Economics. 2007;11:170–186. [Google Scholar]
- Smith L, Alderman H, Aduayom D. Food insecurity in sub-Saharan Africa: New estimates from household expenditure surveys. International Food Policy Research Institute; Washington, DC: 2006. [Google Scholar]
- Sprangers M, Schwartz C. Integrating response shift into health-related quality of life research: a theoretical model. Social Science & Medicine. 1999;48(11):1507–1515. doi: 10.1016/s0277-9536(99)00045-3. [DOI] [PubMed] [Google Scholar]
- Swidler A, Watkins S. “Teach a man to fish”: the sustainability doctrine and its social consequences. World Development. 2009;37(7):1182–1196. doi: 10.1016/j.worlddev.2008.11.002. [DOI] [PMC free article] [PubMed] [Google Scholar]
- Swindale A, Bilinsky P. Development of a universally applicable household food insecurity measurement tool: process, current status, and outstanding issues. Journal of Nutrition. 2006;136(5):1449–1452. doi: 10.1093/jn/136.5.1449S. [DOI] [PubMed] [Google Scholar]
- Thoits P, Hewitt L. Volunteer work and well-being. Journal of Health and Social Behavior. 2001;42:115–131. [PubMed] [Google Scholar]
- Ulimwengu J, Workneh S, Paulos Z. Impact of soaring food price in Ethiopia. International Food Policy Research Institute (IFPRI); Washington, DC: 2009. [Google Scholar]
- UN-HABITAT . State of the world’s cities 2008/2009. United Nations Human Settlements Programme (UN-HABITAT); Nairobi, Kenya: 2008. [Google Scholar]
- Weaver L, Hadley C. Moving beyond hunger and nutrition: a systematic review of the evidence linking food insecurity and mental health in developing countries. Ecology of Food and Nutrition. 2009;48(4):263–284. doi: 10.1080/03670240903001167. [DOI] [PubMed] [Google Scholar]
- World Health Organization . A user’s guide to the self reporting questionnaire (SRQ) WHO; Geneva: 1994. [Google Scholar]
- World Health Organization . Community home-based care in resource-limited settings: A framework for action. WHO; Geneva: 2002. [Google Scholar]
- Zezza A, Davis B, Azzarri C, Covarrubias K, Tasciotti L, Anriquez G. The impact of rising food prices on the poor. Food and Agriculture Organization of the United Nations; Rome, Italy: 2008. [Google Scholar]
- Zilber N, Youngmann R, Workneh F, Giel R. Development of a culturally-sensitive psychiatric screening instrument for Ethiopian populations. In: Ros-Tonen M, editor. Netherlands-Israel development research programme research for policy series. Royal Tropical Institute and KIT Publishers; Amsterdam: 2004. [Google Scholar]