

Abstract
Atomic force microscopy (AFM) and fluorescence microscopy are widely used for the study of protein-DNA interactions. While AFM excels in its ability to elucidate structural detail and spatial arrangement, it lacks the ability to distinguish between similarly sized objects in a complex system. This information is readily accessible to optical imaging techniques via site-specific fluorescent labels, which enable the direct detection and identification of multiple components simultaneously. Here, we show how the utilization of semiconductor quantum dots (QDs), serving as contrast agents for both AFM topography and fluorescence imaging, facilitates the combination of both imaging techniques, and with the addition of a flow based DNA extension method for sample deposition, results in a powerful tool for the study of protein-DNA complexes. We demonstrate the inherent advantages of this novel combination of techniques by imaging individual RNA polymerases (RNAP) on T7 genomic DNA.
INTRODUCTION
AFM is a well-established characterization tool for protein-DNA complexes, which has been detailed in several review articles (Bustamante and Rivetti, 1996; Hansma, 2001; Yang and Wang, 2003). The nanometric features of both DNA and DNA-binding proteins allow AFM imaging to precisely locate protein binding sites, as well as, provide detailed structural analysis of binding protein-induced DNA conformations, such as bending or looping. Dynamic interactions, such as transcription and diffusion of proteins along DNA, can also be examined by AFM. However, a constraint on the precision of current AFM analysis is the limited contrast mechanism used for imaging. Most commonly, an image’s contrast arises from height variations, resulting in a 3D representation of the sample topography. In the case of protein-DNA complexes, multiple interacting units must be accurately distinguished by their difference in size. A single protein species can be easily distinguished from its interacting DNA fragment; yet, as the complexity of the protein-DNA complex increases (i.e., multi-subunit interactions or variation in oligomeric state), analysis becomes problematic; especially when information on the multiple components is desired. Another constraint on AFM imaging is its low throughput. The technique is inherently slow and generating large data sets is timely and requires user supervision.
These limitations may be addressed by optical microscopy utilizing fluorescence. Using a CCD camera, optical imaging requires short acquisition time, typically, a fraction of a second is required for a full field of view, 50–300 μm2. AFM imaging of a similar area would require several hours of scanning. Even when taking into account the higher sample density achievable by AFM, the technique is 3–4 orders of magnitude slower compared with fluorescence imaging. Fluorescent labeling of proteins and DNA allows multiple components to be distinguished by color (multiplexing), and coupled with the short integration times needed for optical images, allows high throughput data acquisition of complex, multi-component systems. Nevertheless, optical imaging has its own constraints; typically it is diffraction-limited, which limits the resolution to about half the wavelength of the observed fluorescence.
While recent advances in super resolution schemes have allowed nanometer resolution optical imaging of fluorescently labeled samples (Betzig and Patterson, 2006; Rust and Bates, 2006), the complementary nature of AFM and optical microscopy make them a powerful combination for the characterization of various systems down to the single molecule level (Ebenstein and Mokari, 2002). In this work, we demonstrate the integration of fluorescence microscopy and AFM in the context of DNA and specifically aligned protein-DNA complexes. This synergetic integration results in a powerful method for assembly, deposition, and analysis of DNA binding proteins bound to their cognate DNA. Beyond its potential for biological applications, such as transcription mapping and genomic analysis, the method is relevant to the assembly of controlled nanostructures composed of nanoparticles specifically bound to a DNA template via various molecular recognition routes. It also offers a low-cost and efficient optical screening tool for subsequent AFM studies, allowing one to rapidly scan large areas by optical microscopy and “zoom-in” on potentially interesting regions for detailed structural analysis by AFM.
MATERIALS AND METHODS
Protein expression and purification
Biotinylated E. coli catabolite activator protein (CAP) or T7 RNA polymerase (T7-RNAP) proteins were created by cloning the desired amino acid sequence into the vector pAN-4 (Avidity) containing a N-terminal AviTag peptide. The resulting plasmids, containing the N-terminal Biotin AviTag and an N-terminal hexa-histidine tag were transformed into AVB101 cells (Avidity). These cells over-express biotin-ligase, which recognizes the peptide tag and introduces a single biotin molecule at the N-terminus. For each clone, an overnight culture (10 ml) from a single colony was subcultured into 1 L of LB media with 100 μg/ml of ampicillin and 25 μg/ml chloramphenicol at 37°C and grown to an OD600 of 0.4–0.6. Cells were induced with 1 mM IPTG and biotin was added to a final concentration of 50 μM. The cells were grown an additional 3 h at 37°C, and then harvested by centrifugation for 15 min at 5000×g, 4°C. The cell pellet was resuspended in 35 ml of nickel binding buffer (NBB: 50 mM sodium phosphate, 10 mM Tris-HCl, 0.5 M NaCl, 5 mM imidazole, 4 mM 2-mercaptoethanol (2-ME), 5% glycerol, pH 8.0 for T7 RNAP and 7.4 for CAP), disrupted by sonication, and the lysate was centrifuged for 30 min at 15 000×rpm, 4°C; all subsequent steps were maintained at 4°C.
1 ml of Ni-NTA agarose beads (Qiagen) was equilibrated with 10 ml of NBB in a 20 ml disposable column (Econo-Pac, Bio-Rad), and the cleared lysate was passed through the column by gravity flow, followed by a 10 ml NBB (plus 10 mM imidazole) wash. Proteins were eluted with 3 column volume (CV) of NBB containing 20 mM, 40 mM, and 150 mM imidazole, respectively, and fractions were collected at 1 CV each. The fractions were analyzed by SDS-PAGE, and peak fractions containing the desired protein were pooled. If further purification was necessary, the pooled fractions were diluted with TGED buffer (20 mM Tris-HCl, pH 7.9, 0.1 mM EDTA, 1 mM dithiothreitol (DTT), 5% glycerol) to a final NaCl concentration of 0.1 M. The resulting sample was loaded onto a Heparin-Sepharose column (GE Healthcare) pre-equilibrated with TGED with 0.1 M NaCl, using Aktä purifier (GE Healthcare). Protein was eluted with a gradient from TGED +0.1 M NaCl to 1 M NaCl over 120 min at 0.25 ml/min. Fractions containing pure protein were pooled and dialyzed against storage buffer (10 mM Tris-HCl, pH 7.9, 50% glycerol, 0.1 mM EDTA, 0.1 mM DTT, 0.05 M NaCl), then stored at −20°C. The typical yield is about 5–10 mg of purified protein from a 1 L culture. E. coli RNAP was purchased from Epicentre.
Surface preparation
Functionalized glass coverslips were prepared as follows: glass coverslips (22 × 22 mm2, number 1.5, Fisher) were washed with 1% (w/v) fresh Alconox (Fisher) solution and sonicated for 15–30 min with heating. Coverslips were then washed with copious amounts of deionized water and baked at 500°C for 2–3 h to remove any organic contamination. For molecular combing, a drop of polystyrene/xylene solution (15 mg/ml) was spin cast on a clean glass coverslip at 3000–6000 rpm for 1 min. For flow stretching, a 10 μl solution of 5–6 μg/ml poly-lysine (Sigma) in water was sandwiched between two cooled coverslips, and allowed to dry overnight. The sandwiched coverslips may be used for up to a week with reproducible results or stored at −20°C for longer periods. Before imaging, sandwiched coverslips are separated and an un-treated coverslip (“out of the box”) is placed on top of the poly-lysine surface. This top coverslip is slightly hydrophobic and serves to trap free QDs from the sample. This was verified by separately imaging the upper and lower coverslip after sample deposition.
Sample preparation and deposition
Protein-DNA samples were prepared as follows: CAP was reacted with the DNA under minimal saturation conditions (Ebright and Ebright, 1989), substituting the Tris binding buffer with HEPES buffer to allow subsequent cross-linking using 2% formaldehyde. In a typical reaction 10 nM DNA (1 μg) was reacted for 30 min with 40 nM CAP-biotin followed by addition of 120 nM of streptavidin conjugated QDs (Qdot 655, Invitrogen) and 0.3 μl of 1 μm YOYO-1 DNA stain. The sample was incubated in the dark for 30–60 min and loaded onto a 0.5% agarose gel for electrophoretic separation. The sample was split into two bands one corresponding to free QD and the other, comprising of QD and DNA signal that was wide and shifted from the free DNA control band. This band was cut out of the gel and the contained sample was eluted using a commercial spin column (Freeze n′ squeeze, Bio-Rad). T7-RNAP samples were prepared by reacting 3 nM of T7 genome (Boca Scientific) with 30–167 nM of biotinylated T7-RNAP (6 μL total volume) for 20 min at 37°C in the T7 binding buffer (30 mM Hepes pH 7.0, 25 mM K-Glutamate, and 15 mM Mg-acetate). To stabilize the DNA-RNAP complex, transcription was allowed to initiate by feeding the reaction with 1 μl of 1 mM GTP, UTP, and CTP and incubating at 37°C for an additional 5 min. When a large excess of RNAP was used (>60 nM), non-specific binding was reduced by challenging with heparin before the addition of NTPs. 0.6 μl of 1 mg/ml heparin-sepharose (GE Healthsciences) was added to a 6 μl reaction and incubated for 30 s at 37°C. The sample was then centrifuged at max speed in a benchtop centrifuge, and 5 μl were removed from the supernatant. Typical reactions contained 1 μg of DNA to which 0.3 μl of a 1 mM stock solution of YOYO-1 in DMSO was added. Streptavidin conjugated QDs were diluted to 100 nM and filtered by a 100 kDa pore size membrane (YM-100, Centricon) to eliminate free streptavidin. The flow-through was discarded and the QDs were resuspended in HEPES buffer to a final concentration of 20 nM. 5 μl of the QD solution was added and the sample was further incubated in the dark for 30 min.
For molecular combing, 50 μl of DNA solution is pipetted on the center of the polystyrene coated coverslip and slowly rolled off by tilting it in a shallow angle back towards the sample reservoir.
For flow-induced stretching (Meng and Benson, 1995), 0.5 μl of the prepared sample is diluted into 50 μl of 100 mM of HEPES pH 7.0 containing 0.1% of n-dodecyl-β-D-maltoside (DDM). A 3 μl droplet containing ~5 ng of DNA was deposited at the interface between two parallel coverslips, one of which was functionalized with poly-lysine. Capillary force immediately sucked the droplet in between the coverlips, stretching the DNA and immobilizing it on the poly-lysine surface, presumably by electrostatic interaction. We found that adding 0.1% of DDM, a very mild nonionic surfactant (Stubbs and Smith, 1976), improved the extension uniformity and reduced non-specific binding of free QDs to the poly-lysine surface (Huang and Wu, 2005).
AFM imaging
Samples were scanned in tapping mode using a MFP-3D AFM (Asylum Research) and using arrowhead cantilevers for easy positioning of the tip in the optical field of view (NanoWorld, Arrow NCR). AFM images were processed using the MFD-3D software. The AFM head was mounted on the stage of an inverted optical microscope and can be moved with high precision relative to the optical axis of the microscope with the aid of two piezo motors (New Focus, Picomotor). For correlated AFM –optical images, the arrow shaped cantilever was first identified in the field of view using a 4X long working distance microscope objective. The tip was brought within a few microns from the coverslip surface and was centered in the field of view by moving the AFM head relative to the objective using the motorized microscope stage. Final calibration was done by switching to the 60X imaging objective, engaging the AFM tip and registering the tip position to a specific pixel in the image.
We note that the lower than expected features of QDs are typical for AFM imaging in tapping mode (Ebenstein and Nahum, 2002).
Fluorescence microscopy and image processing
The sample was imaged on an inverted microscope (IX71, Olympus) with a 60X, oil immersion objective (Plan-Apo, 1.45NA, Olympus). A magnifying lens resulted in a field of view of ~50 μm2. Fluorescence was excited with a Xenon arc lamp through a 470 ± 15 nm bandpass filter and images were collected with an electron multiplying CCD (EMCCD) (DU997, Andor). The resolution of 97 nm/pixel allowed high- resolution localization of fluorescence spots. Images of the YOYO-1 stained DNA were acquired with a 535 ± 25 nm band-pass filter. QD fluorescence was acquired with a bandpass filter centered at 655 nm (or as required for other QD colors). An automatic protocol was written to acquire color planes sequentially and overlay the separate planes into a multicolor image (IQ, Andor). The contrast of each color channel was modified independently to sharpen DNA edges for subsequent analysis and to enhance the image for presentation.
RESULTS AND DISCUSSION
The first step towards a successful combination of AFM and fluorescence microscopy for single molecule applications is to identify an agent exhibiting contrast in both imaging modalities. Semiconductor quantum dots (QDs) are natural candidates for such applications since they exhibit both exceptional fluorescence properties (Michalet and Pinaud, 2005) and have a well defined size, easily detected by AFM (Wang and Tessmer, 2008). Figure 1 is an example of a correlated AFM-fluorescence image utilizing QDs as single molecule probes. The streptavidin conjugated QDs bind biotinylated T7-RNAP enzymes interacting with their genomic targets. T7 genomic DNA, represented in green is stained with the intercalating dye YOYO-1, while QDs are visualized as individual red spots. The DNA-RNAP-QD complex is deposited on a poly-lysine functionalized glass coverslip and imaged (see Material and Methods). Correlation between the two images is achieved by first imaging the AFM cantilever and registering the tip location in the field of view (Figure 1, inset). After the optical image is taken, the tip may be addressed to any desired area in the field of view for detailed structural analysis, as demonstrated in Figure 1. The AFM zooms-in on a 10 μm2 region of the fluorescence image revealing structural detail inaccessible optically, like the fine arrangement of DNA bundles which seem as a single DNA strand in the optical image or “dark” QDs which are not detected optically (Ebenstein and Mokari, 2002). Further demonstration is given in Figure 1(c) and (d) where two proximal QDs display an overlapping signal in the fluorescence image, but are easily distinguishable in the AFM image.
Figure 1.

(a) CCD fluorescence image of QD labeled RNAP (red) bound to DNA (green); (b) AFM amplitude image of the 10 μm2 marked on the fluorescence image, (inset) the AFM cantilever imaged through the glass coverslip for registration of the tip location in the field of view; (c) and (d) fluorescence and AFM blowups of a region containing two close QDs with overlapping signals in the fluorescence image (scale bar 1 μm).
To facilitate optical localization of QDs along DNA, it is beneficial to have the DNA linearly extended on the imaging surface. Molecular combing (Allemand and Bensimon, 1997; Michalet and Ekong, 1997) utilizes the drag force of a receding meniscus to stretch DNA molecules anchored by their extremities to chemically modified glass. For AFM analysis of combed DNA, the glass surface must remain flat after it is cleaned and modified. Spin coating a thin layer of polystyrene on the coverslip, prior to combing, results in a highly hydrophobic surface suitable for efficient combing, while still enabling AFM imaging. As demonstrated in Figure 2(a) a 6.8 kb linearized plasmid can be efficiently combed. It is important to note that at this high density, individual DNA molecules are not resolvable optically. Figure 2(b) displays an optical image of a more dilute sample.
Figure 2.
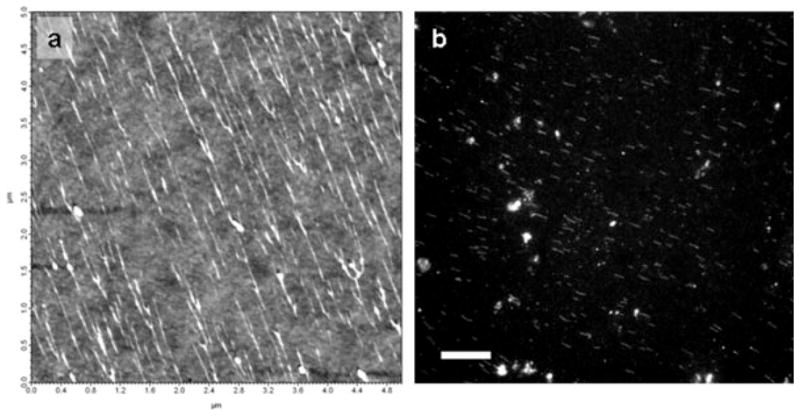
(a) AFM height image of 6.8 kb linearized plasmids combed on polystyrene coated glass; (b) CCD fluorescence image of a 100X dilution of the same sample (scale bar 10 μm).
To test the applicability of molecular combing to the alignment of QD-labeled DNA-binding proteins, we constructed an artificial 2.4 kb DNA model system, biotinylated on one end and containing a consensus binding site for E. coli catabolite activator protein (CAP) near the opposite end. CAP was biotinylated on its N terminus, and the protein’s ability to bind both its DNA binding sequence and streptavidin were verified using a gel shift assay (5% polyacrylamide).
First AFM imaging was tested by depositing a few μl of sample on freshly cleaved mica, allowing the solution to dry, and imaging. AFM images revealed isolated complexes deposited on the mica surface. As seen in Figure 3(a), the DNA is extended to a linear form and displays two protrusions on its extremities, which we attribute to the two QDs, one attached to the biotinylated end of the DNA and the other to the biotinylated CAP protein. We assume that the slow evaporation process resulted in flow stretched complexes (Wang and Lin, 1998).
Figure 3.
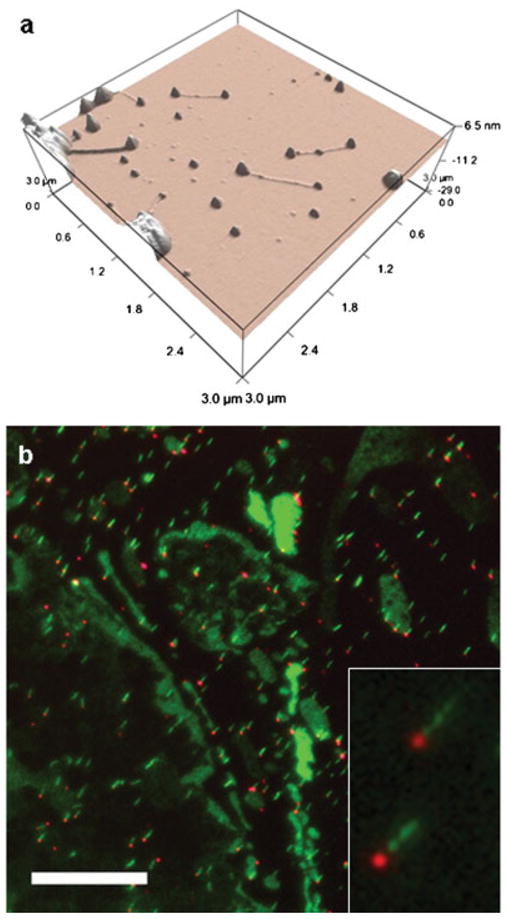
(a) AFM height 3d rendering of extended 2.4 kb DNA with QDs on both ends; (b) CCD fluorescence image of the same sample after combing on a polystyrene coated coverslip. Only one QD (red) remains bound to DNA (green), (scale bar 10 μm).
Then optical imaging was tested by combing the sample as described (Material and Methods Section) and imaging (Figure 3b). Clearly, only one QD remains attached to the DNA under these conditions. Since the direction of combing is known, and the missing QD is in majority of the cases downstream from the combing direction, we postulate that one QD binds nonspecifically to the surface in solution and serves to anchor the DNA while the receding meniscus stretches it. The receding meniscus exerts a highly localized drag force, which scales with the cross-sectional area of the object experiencing it (either DNA or QD). Calculation of the force acting on DNA under similar experimental conditions yielded a force of roughly 160 pN (Bensimon and Simon, 1995). Taking a diameter of 10–20 nm for the QD, this force may increase by two orders of magnitude, generating a considerably larger force than is necessary to break the interaction between biotin and streptavidin, which holds the QD to either protein or DNA (Florin and Moy, 1994; Lee and Kidwell, 1994; de Odrowaz Piramowicz and Czuba, 2006). As the meniscus reaches the second QD, the force is dramatically increased due to the larger diameter of the QD relative to the DNA molecule and the QD is detached. Similar results have been obtained for QD-labeled RNA polymerase on combed T7-DNA (data not shown).
One method of reducing the stretching force is by adding a layer of heavy alcohol as a mediator between the aqueous buffer solution and the hydrophobic surface. Such a layer reduces surface tension and enables combing of DNA-protein complexes (Gueroui and Place, 2002). The alcohol must be added on-top of the DNA solution after immersion of the surface and acts on the interface as the coverslip is pulled out of the incubation chamber. The disadvantage of this technique is that additional combing experiments cannot be repeated with the combing solution until the alcohol is completely removed, since it interacts with the hydrophobic surface upon dipping it in solution and hinders successive combing.
Another approach to extend DNA is by use of laminar flow over a positively functionalized surface (Meng and Benson, 1995), this technique was shown to reproducibly elongate protein-DNA complexes and has the advantage of being easy to implement while using very small amounts of sample (Wu and Schwartz, 2007). Functionalization of glass coverslips with poly-lysine resulted in surfaces that are suitable for DNA extension, while remaining flat enough for AFM analysis as seen in Figure 1. Using this technique, we were able to elongate DNA bearing multiple QD-labeled RNAP (Figure 4b).
Figure 4.
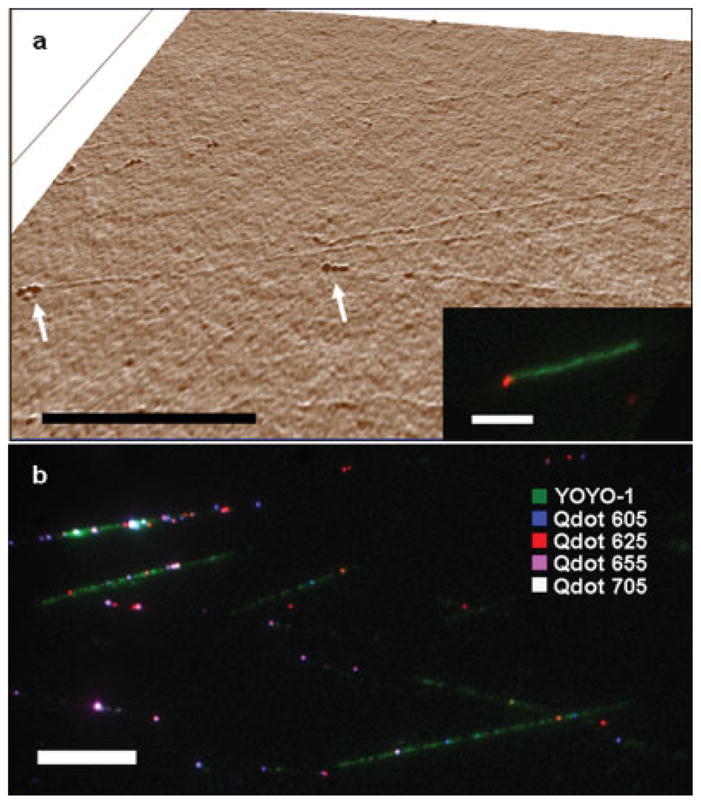
(a) AFM height 3d rendering of extended T7 Bacteriophage DNA reacted with E. coli RNAP. The protrusions at the end of the DNA fiber, confirm binding of RNAP to the expected location; (Inset) fluorescence image of the same sample after incubation with QDs that were conjugated with antibodies against E. coli RNAP confirms specific QD binding on the single molecule level (Scale-bars 5 μm); (a) pseudo color image of RNAP-biotin cross linked to aligned DNA and bound to streptavidin-QDs of four different colors (Scale-bar 10 μm).
With these developments, we now have an integrated platform for examining a wide range of interactions. To demonstrate the inherent advantages of this combination, we examined the interaction of two distinct RNA polymerases, E. coli RNAP and T7 RNAP, with the T7-bacteriophage genome.
T7 is a phage that infects E. coli. The full sequence of its 39 936 bp double stranded genome, as well as, extensive genetic characterization has been published (Dunn and Studier, 1983). The T7 genome contains 17 promoters for the T7-RNAP out of which five possess the same 23 bp consensus sequence. In addition, three strong E. coli RNAP promoters reside on one end of the genome, harnessing the host enzyme to transcribe the early T7 genes within 4–8 min of infection. These early genes are responsible for shutting down of the host metabolism and hijacking its translation machinery. The first T7 gene encodes for the production of the T7 RNAP. This highly efficient single unit enzyme transcribes the majority of T7 genes, including those responsible for T7 DNA replication, phage assembly and finally, lysis of the host bacteria. Figure 4(a) shows an amplitude AFM image of extended T7 genome that was incubated with E. coli RNAP. Three protrusions are clearly seen towards the end of the DNA molecule and are attributed to bound RNAP. The spacing between the enzymes is on the order of 50 nm (150 bp) and can not be resolved using conventional far field optics. The inset shows a fluorescence image of the same sample after labeling the RNAP with a QD conjugated to a specific antibody against E. coli RNAP (WP001, Neoclone). This is a clear demonstration of the superior resolving power of AFM relative to optical microscopy, while the fluorescence label gives information on the specific identity of the observed AFM feature.
In Figure 4(b), T7-RNAP-biotin was incubated with the T7 genome followed by labeling with four different colors of streptavidin conjugated QDs which can be seen decorating the YOYO-1 stained DNA backbone. This demonstrates the potential application of fluorescence imaging not only to detect but also to identify multiple interacting species in a single experiment.
CONCLUSION
By combining AFM and fluorescence microscopy, we are able to correlate optical information with nanoscopic physical characterization offered by the AFM. In this work, we utilize QDs as multimodal contrast agents, harnessing both their unique optical properties and their size and rigid structure, to specifically label DNA and protein for AFM and fluorescence microscopy. In such a combined mode of operation, the AFM may serve as a validation tool for binding and morphology followed by high throughput optical data acquisition. In other scenarios, rapid optical screening may be followed by detailed AFM analysis of a region of interest. Either way, the two imaging techniques provide complimentary information offering the experimentalist enhanced capabilities and access to more complex biological systems. Facile image analysis and localization of proteins along DNA is achieved by elongation and alignment of the DNA samples, which may also increase throughput by allowing higher sample density. Beyond its potential for biological applications, such as transcription mapping and genomic analysis, the method is relevant to the assembly of controlled nanostructures composed of nanoparticles specifically bound to a DNA template through protein-DNA molecular recognition.
Acknowledgments
This work was supported by the UCLA-DOE Institute for Genomics and Proteomics (grant DE-FC02-02ER63421) and NIH grant R01-EB000312. Y. E is supported by a Human Frontier Science Program Cross disciplinary Fellowship. We thank Mr Josh Antelman and Dr Xavier Michalet for their help with DNA combing.
References
- Allemand JF, Bensimon D, Jullien L, Bensimon A, Croquette V. pH-dependent specific binding and combing of DNA. Biophys J. 1997;73 (4):2064–2070. doi: 10.1016/S0006-3495(97)78236-5. [DOI] [PMC free article] [PubMed] [Google Scholar]
- Bensimon D, Simon AJ, Croquette V, Bensimon A. Stretching DNA with a receding meniscus: experiments and models. Phys Rev Lett. 1995;74 (23):4754–4757. doi: 10.1103/PhysRevLett.74.4754. [DOI] [PubMed] [Google Scholar]
- Betzig E, Patterson GH, Sougrat R, Lindwasser OW, Olenych S, Bonifacino JS, Davidson MW, Lippincott-Schwartz J, Hess HF. Imaging intracellular fluorescent proteins at nanometer resolution. Science. 2006;313(5793):1642–1645. doi: 10.1126/science.1127344. [DOI] [PubMed] [Google Scholar]
- Bustamante C, Rivetti C. Visualizing protein-nucleic acid interactions on a large scale with the scanning force microscope. Annu Rev Biophys Biomol Struct. 1996;25(1):395–429. doi: 10.1146/annurev.bb.25.060196.002143. [DOI] [PubMed] [Google Scholar]
- de Odrowaz Piramowicz M, Czuba P, Targosz M, Burda K, Szymoński M. Dynamic force measurements of avidin-biotin and streptavdin-biotin interactions using AFM. Acta Biochim Pol. 2006;53(1):93–100. [PubMed] [Google Scholar]
- Dunn JJ, Studier FW. Complete nucleotide sequence of bacteriophage T7 DNA and the locations of T7 genetic elements. J Mol Biol. 1983;166(4):477–535. doi: 10.1016/s0022-2836(83)80282-4. [DOI] [PubMed] [Google Scholar]
- Ebenstein Y, Mokari T, Banin U. Fluorescence quantum yield of CdSe/ZnS nanocrystals investigated by correlated atomic-force and single-particle fluorescence microscopy. Appl Phys Lett. 2002;80(21):4033–4035. [Google Scholar]
- Ebenstein Y, Nahum E, Banin U. Tapping mode atomic force microscopy for nanoparticle sizing: tip-sample interaction effects. Nano Lett. 2002;2(9):945–950. [Google Scholar]
- Ebright RH, Ebright YW, Gunasekera A. Consensus DNA site for the Escherichia coli catabolite gene activator protein (CAP): CAP exhibits a 450-fold higher affinity for the consensus DNA site than for the E. coli lac DNA site. Nucleic Acids Res. 1989;17(24):10295–10305. doi: 10.1093/nar/17.24.10295. [DOI] [PMC free article] [PubMed] [Google Scholar]
- Florin EL, Moy VT, Gaub HE. Adhesion forces between individual ligand-receptor pairs. Science. 1994;264(5157):415–417. doi: 10.1126/science.8153628. [DOI] [PubMed] [Google Scholar]
- Gueroui Z, Place C, Freyssingeas E, Berge B. Observation by fluorescence microscopy of transcription on single combed DNA. Proc Natl Acad Sci. 2002;99(9):6005–6010. doi: 10.1073/pnas.092561399. [DOI] [PMC free article] [PubMed] [Google Scholar]
- Hansma HG. Surface biology of DNA by atomic force microscopy. Annu Rev Phys Chem. 2001;52(1):71–92. doi: 10.1146/annurev.physchem.52.1.71. [DOI] [PubMed] [Google Scholar]
- Huang B, Wu H, Kim S, Zare RN. Coating of poly(dimethylsiloxane) with n-dodecyl-[small beta]-d-maltoside to minimize nonspecific protein adsorption. Lab Chip. 2005;5(10):1005–1007. doi: 10.1039/b509251e. [DOI] [PubMed] [Google Scholar]
- Lee GU, Kidwell DA, Colton R. Sensing discrete streptavidin-biotin interactions with atomic force microscopy. Langmuir. 1994;10(2):354–357. [Google Scholar]
- Meng X, Benson K, Chada K, Huff EJ, Schwartz DC. Optical mapping of lambda bacteriophage clones using restriction endonucleases. Nat Genet. 1995;9(4):432–438. doi: 10.1038/ng0495-432. [DOI] [PubMed] [Google Scholar]
- Michalet X, Ekong R, Fougerousse F, Rousseaux S, Schurra C, Hornigold N, van Slegtenhorst M, Wolfe J, Povey S, Beckermann JS, Bensimon A. Dynamic molecular combing: stretching the whole human genome for high-resolution studies. Science. 1997;277(5331):1518–1523. doi: 10.1126/science.277.5331.1518. [DOI] [PubMed] [Google Scholar]
- Michalet X, Pinaud FF, Bentolila LA, Tsay JM, Doose S, Li JJ, Sundaresan G, Wu AM, Gambhir SS, Weiss S. Quantum dots for live cells, in vivo imaging, and diagnostics. Science. 2005;307(5709):538–544. doi: 10.1126/science.1104274. [DOI] [PMC free article] [PubMed] [Google Scholar]
- Rust MJ, Bates M, Zhuang X. Sub-diffraction-limit imaging by stochastic optical reconstruction microscopy (STORM) Nat Methods. 2006;3 (10):793–795. doi: 10.1038/nmeth929. [DOI] [PMC free article] [PubMed] [Google Scholar]
- Stubbs GW, Smith HG, Jr, Litman BJ. Alkyl glucosides as effective solubilizing agents for bovine rhodopsin. A comparison with several commonly used detergents. Biochim Biophys Acta. 1976;426(1):46–56. doi: 10.1016/0005-2736(76)90428-4. [DOI] [PubMed] [Google Scholar]
- Wang W, Lin J, Schwartz DC. Scanning force microscopy of DNA molecules elongated by convective fluid flow in an evaporating droplet. Biophys J. 1998;75(1):513–520. doi: 10.1016/S0006-3495(98)77540-X. [DOI] [PMC free article] [PubMed] [Google Scholar]
- Wang H, Tessmer I, Croteau DL, Erie DA, Van Houten B. Functional characterization and atomic force microscopy of a DNA repair protein conjugated to a quantum dot. Nano Lett. 2008;8(6):1631–1637. doi: 10.1021/nl080316l. [DOI] [PMC free article] [PubMed] [Google Scholar]
- Wu T, Schwartz DC. Transchip: single-molecule detection of transcriptional elongation complexes. Anal Biochem. 2007;361(1):31–46. doi: 10.1016/j.ab.2006.10.042. [DOI] [PMC free article] [PubMed] [Google Scholar]
- Yang Y, Wang H, Erie DA. Quantitative characterization of biomolecular assemblies and interactions using atomic force microscopy. Methods. 2003;29(2):175–187. doi: 10.1016/s1046-2023(02)00308-0. [DOI] [PubMed] [Google Scholar]