

Abstract
Mapping and monitoring impervious surface dynamic change in a complex urban-rural frontier with medium or coarse spatial resolution images is a challenge due to the mixed pixel problem and the spectral confusion between impervious surfaces and other non-vegetation land covers. This research selected Lucas do Rio Verde County in Mato Grosso State, Brazil as a case study to improve impervious surface estimation performance by the integrated use of Landsat and QuickBird images and to monitor impervious surface change by analyzing the normalized multitemporal Landsat-derived fractional impervious surfaces. This research demonstrates the importance of two step calibrations. The first step is to calibrate the Landsat-derived fraction impervious surface values through the established regression model based on the QuickBird-derived impervious surface image in 2008. The second step is to conduct the normalization between the calibrated 2008 impervious surface image with other dates of impervious surface images. This research indicates that the per-pixel based method overestimates the impervious surface area in the urban-rural frontier by 50-60%. In order to accurately estimate impervious surface area, it is necessary to map the fractional impervious surface image and further calibrate the estimates with high spatial resolution images. Also normalization of the multitemporal fractional impervious surface images is needed to reduce the impacts from different environmental conditions, in order to effectively detect the impervious surface dynamic change in a complex urban-rural frontier. The procedure developed in this paper for mapping and monitoring impervious surface area is especially valuable in urban-rural frontiers where multitemporal Landsat images are difficult to be used for accurately extracting impervious surface features based on traditional per-pixel based classification methods as they cannot effectively handle the mixed pixel problem.
Keywords: impervious surfaces, urban-rural frontier, Landsat, QuickBird, regression analysis
1. Introduction
Digital change detection in urban environments is a challenge due to the following factors: urban land use/cover changes usually account for a small proportion of the study area and are scattered in different locations; they are often confounded with other changes because of the complexity of impervious surfaces and similar spectral features between impervious surfaces and other non-vegetation land covers; a large number of mixed pixels often result in poor classification accuracy due to the heterogeneous nature of urban environments and the limitation of spatial resolution in the remotely sensed image. Although many change detection techniques, such as principal component analysis, image differencing, and post-classification comparison, can be applied for urban land use and cover change detection (Singh, 1989; Coppin and Bauer, 1996; Coppin et al., 2004; Lu et al., 2004; Kennedy et al., 2009), the detection results are often poor, especially in urban-rural frontiers. The majority of previous change detection techniques are based on the comparison of spectral responses or classified images at the per-pixel scale. However, per-pixel based methods are problematic in accurately mapping and monitoring urban land use/cover change if medium or coarse spatial resolution images are used (Seto and Liu, 2003; Lu and Weng, 2004). Recent research has indicated that the subpixel-based impervious surface data sets have the potential to detect urban expansion (Yang et al., 2003a; Xian and Crane, 2005; Xian, 2007; Xian et al., 2008).
Urban landscapes can be regarded as a complex combination of buildings, roads, grass, trees, soil, water, and so on. In coarse and medium spatial resolution images such as Landsat Thematic Mapper (TM), mixed pixels have been recognized as a problem in the effective use of remotely sensed data in land use/cover classification and change detection (Fisher, 1997; Cracknell, 1998; Lu and Weng, 2004). As shown in Fig. 1, mixed pixels are common in TM imagery, but this problem almost does not exist in the QuickBird image (0.6 m spatial resolution here). Building shapes, roads, and the boundaries between different land covers can be clearly identified on the QuickBird image, but these features cannot be detected in the Landsat TM color composite because of its relatively coarse spatial resolution (i.e., 30 m). This demonstrates the difficulty in urban land use/cover classification or change detection with Landsat TM images. If traditional per-pixel based methods such as maximum likelihood classifier are used for urban land use/cover classification, urban areas may be significantly overestimated, but rural areas may be significantly underestimated (Lu and Weng, 2004). This situation worsens if multitemporal remote sensing data are used for urban land use/cover change detection, especially in the urban-rural frontiers. It is imperative to develop some new methods that can be used effectively to detect the dynamic change of urban land use/cover at the sub-pixel level with limited or no training samples for the historical remote sensing data.
Fig. 1.

A comparison of color composites between Landsat TM and QuickBird images (2008), illustrating the mixed pixel problem in relatively coarse spatial resolution images.
Impervious surfaces are generally defined as any anthropogenic materials that water cannot infiltrate and are primarily associated with human activities and habitation through construction of transportation and buildings (Slonecker et al. 2001). Research on impervious surface extraction from remotely sensed data has attracted interest since the 1970s (Slonecker et al., 2001; Brabec et al., 2002; Weng, 2007). Many methods have been developed for mapping impervious surfaces with different spatial resolution images from high spatial resolution such as IKONOS and QuickBird (Mohapatra and Wu, 2008; Lu and Weng, 2009; Wu, 2009), medium spatial resolution such as Landsat TM and Terra ASTER (Deguchi and Sugio, 1994; Slonecker et al., 2001; Hodgson et al., 2003; Wu and Murray, 2003; Yang et al., 2003a; 2003b; Dougherty et al., 2004; Jennings et al., 2004; Wu, 2004; Xian and Crane, 2005; Lu and Weng, 2006a; 2006b; Powell et al., 2008; Wang et al., 2008; Weng et al., 2008; Esch et al., 2009; Hu and Weng, 2009; Weng et al., 2009) and coarse resolution such as DMSP-OLS (Elvidge et al., 2007; Sutton et al., 2009). The main methods include per-pixel image classification (Hodgson et al., 2003; Dougherty et al., 2004; Jennings et al., 2004), subpixel classification (Ji and Jensen, 1999; Phinn et al., 2002; Rashed et al., 2003), neural network (Mohapatra and Wu, 2008; Wang et al., 2008; Hu and Weng, 2009; Wu, 2009), regression tree model (Yang et al., 2003a; 2003b; Xian and Crane, 2005; Xian, 2008; Xian et al., 2008; Yang et al., 2009), the combination of high-albedo and low-albedo fraction images (Wu and Murray, 2003; Wu, 2004; Lu and Weng, 2006a; 2006b; Weng et al., 2009), and through the established relationship between impervious surfaces and vegetation cover (Gillies et al., 2003; Bauer et al., 2008). However, impervious surface areas are often overestimated or underestimated when medium spatial resolution images are used, depending on the relative proportion of impervious surfaces in a pixel (Wu and Murray, 2003; Lu and Weng, 2006a; Greenfield et al., 2009).
Ridd (1995) assumed that land-cover in urban environments is a linear combination of three components: vegetation, impervious surface, and soil (V-I-S). The V-I-S model provides a guideline for decomposing urban landscapes and a link for these components to remote-sensing spectral characteristics. Several studies have adopted this model as a basis for understanding the urban environment (Madhavan et al., 2001; Rashed et al., 2001; Phinn et al., 2002). Because of the complexity of impervious surfaces in remote sensing spectral signatures and the mixed pixel problem in medium or coarse spatial resolution images (see Fig. 1), sub-pixel based methods have obtained increasing attention in recent years (Wu and Murray, 2003; Wu, 2004; Lu and Weng, 2006a; 2006b; Weng et al., 2009). These methods are especially valuable for accurately extracting impervious surfaces in the urban-rural landscapes.
Although previous research has explored methods for examining urban expansion based on impervious surface dynamic change (Yang et al., 2003a; Xian, 2007; Powell et al., 2008; Xian et al., 2008), detection of the impervious surface change in a complex urban-rural frontier with medium spatial resolution images remains a challenge. Because increase in impervious surface occurs mainly in the urban-rural frontiers over disperse locations, it is imperative to develop a processing method that can rapidly monitor the impervious surface change in a large area. Therefore, the objectives of this research are (1) to develop a new method to improve impervious surface estimation through the integrated use of Landsat TM and QuickBird images and (2) to examine urban expansion through the analysis of normalized multitemporal impervious surface images.
2. Study area and data sets
2.1 Description of the study area
Lucas do Rio Verde (hereafter called simply Lucas) in Mato Grosso State, Brazil has a small urban extent with a relatively short history, covering a proximate area of 3,660 km2 with flat terrain (see Fig. 2). It was established in the early 1980s and has experienced a rapid urbanization since then. The study area includes both an urban area, defined in Brazil as a county seat with population size of approximately 29,000 and rural areas distant from any urban places where the primary activities are agricultural and pastoral activity. The region is connected to Santarém, a river port in the Amazon, and to the heart of the soybean growing area at Cuiabá by the BR-163 highway which runs through the município and its county seat. The economic base of Lucas is large-scale agriculture, including the production of soy, cotton, rice, and corn as well as poultry and swine. The county is at the epicenter of soybean production in Brazil, and it is expected to grow in population three-fold in the next ten years (personal communication with secretariat for planning at Lucas). Annual precipitation is around 2032 – 2286 mm, mainly starting in September to ending in April. The dry season is between May and August. The major vegetation includes primary forest, cerrado, and limited areas of plantation and regenerating vegetation. Deforestation was begun in late 1970s with the construction of BR-163 highway, especially after the establishment of Lucas County. According to the census data, population in Lucas was 4,332 in 1991, increased to 16,145 in 2000 and to 28,017 in 2007 (http://www.citypopulation.de/Brazil-MatoGrosso.html). Because it is, at present, a relatively small town yet has complex urban-rural spatial patterns derived from its highly capitalized agricultural base, large silos and warehouses, and planned urban growth, Lucas is an ideal site for exploring the approaches to map and monitor the impervious surface dynamic change.
Fig. 2. Study area – Município de Lucas do Rio Verde, Mato Grosso State, Brazil.

2.2 Data sets used in research
Landsat images from 1977 to 2008 and QuickBird images acquired in 2007 and 2008 were used in this research (see Table 1). The quality of time series Landsat images was first visually examined in order to find cloud-free images and those with minimal system-induced errors such as stripping or bad pixels. For all selected Landsat images, radiometric and atmospheric calibration was conducted with the image-based dark-object subtraction method (Lu et al., 2002; Chander et al., 2009). All images were geometrically registered into a UTM (zone 21, south) projection with geometric errors of less than one pixel, so that all images have the same coordinate system. The nearest neighbor resampling technique was used to resample the Landsat images into a pixel size of 30 m by 30 m during image-to-image registration.
Table 1. Landsat and QuickBird images used in research.
| Sensor data | Acquisition date | Spectral and spatial resolutions |
|---|---|---|
| MSS | July 8 and 9, 1977 | Four visible and near infrared bands with 80 m spatial resolution |
| TM | June 21, 1984 August 9, 1990 June 6, 1996 September 17, 2002 July 17, 2005 June 21, 2007 May 22, 2008 |
Three visible bands (blue, green, and red), one near infrared (NIR) band, and two shortwave infrared (SWIR) bands with 30 m spatial resolution |
| ETM | August 10, 1999 | The same as TM, but including one panchromatic band with 15 m spatial resolution |
| QuickBird | April 2, 2007 June 20, 2008 |
Three visible bands (blue, green, and red) and one near infrared (NIR) band with 2.4 m, and one panchromatic band with 0.6 m spatial resolution |
3. Methods
One critical step in this research is to map impervious surface data sets, which is difficult in a complex urban-rural frontier based on Landsat images. In order to improve impervious surface mapping performance, QuickBird imagery is used to calibrate the Landsat-derived impervious surface image. The strategy of mapping and monitoring impervious surface change is illustrated in Fig. 3. The major steps include (1) mapping impervious surfaces with a hybrid method based on QuickBird imagery; (2) extracting per-pixel impervious surface images from Landsat images based on the thresholding of maximum and minimum filtering images and unsupervised classification; (3) mapping fractional images of high-albedo, low-albedo, vegetation, and soil endmembers with the linear spectral mixture analysis; (4) producing fractional impervious surface images by adding high-albedo and low-albedo fraction images while removing non-impervious surface pixels by combining the per-pixel impervious surface images from step 2; (5) establishing a regression model to calibrate the 2008 Landsat-derived impervious surfaces using the 2008 QuickBird-derived impervious surface imagery; (6) normalizing multitemporal Landsat-derived impervious surface images; (7) evaluating impervious surface estimates with the 2007 QuickBird-derived impervious surface imagery; and finally (8) examining impervious surface dynamic change. The following subsections provided detailed descriptions for above steps.
Fig. 3. Strategy of integrating Landsat TM and QuickBird images for mapping impervious surfaces and of monitoring imperious surface dynamic change.

3.1 Mapping impervious surfaces with QuickBird imagery
The QuickBird images were used to develop impervious surface images at a local scale, and the developed impervious surface images were used for establishing a calibration model for modifying the Landsat-derived impervious surface image and for evaluating the results independently. QuickBird imagery has four multispectral bands with 2.4 m spatial resolution and one panchromatic band with 0.6 m spatial resolution. In order to make full use of both the multispectral and panchromatic images, the wavelet merging technique (Lu et al., 2008) was used to merge the QuickBird multispectral bands and panchromatic band into a new multispectral image with 0.6 m spatial resolution. A hybrid method which consisted of thresholding, unsupervised classification, and manual editing was used to produce the impervious surface image from the fused QuickBird imagery (Lu et al., 2010).
In general, vegetation has significantly different spectral features compared to impervious surfaces in the normalized difference vegetation index (NDVI) image. Clear and deep water bodies have much lower spectral values than impervious surfaces in the near infrared (NIR) wavelength image. Therefore, the vegetation and water pixels can be masked out with selected thresholds on NDVI and NIR images. The major steps for the hybrid approach included: (1) producing the NDVI image from QuickBird red and NIR images and then masking vegetation out with the selected threshold on the NDVI image; and masking water out with the selected thresholds on the NIR image; (2) extracting spectral signatures of the non-vegetation pixels; using an unsupervised classification algorithm to classify the extracted spectral signatures into 50 clusters and then merging the clusters into impervious surfaces and other classes; (3) manually editing the extracted impervious surface image to eliminate the non-impervious surface pixels such as bare soils, shadows, and wetlands which are confused with the impervious surface class due to similar spectral features (Lu et al., 2010).
Although unsupervised classification can separate most impervious surfaces from bare soils and wetlands, some confusion still remains between bare soil and bright impervious surfaces, and among dark impervious surfaces, shadowed impervious surfaces, wetlands or shadows from tree crowns. Therefore, visually examining the extracted impervious surface image is necessary to further refine the impervious surface image quality by eliminating the confused pixels, e.g., bare soils, non-impervious surface shadows, and wetlands. These impervious surface images with spatial resolution of 0.6 m were resampled to 30 m to generate fractional impervious surface images for use as reference data. This method was used to map impervious surface distribution for the 2007 and 2008 QuickBird images. The accuracy assessment based on randomly selected 450 sample plots indicated that overall accuracy of 98% for both 2007 and 2008 QuickBird images was achieved, based on visual interpretation on the QuickBird color composite.
3.2 Developing per-pixel based impervious surfaces from Landsat images
Per-pixel impervious surface mapping is often based on the image classification of spectral signatures (Shaban and Dikshit, 2001; Hodgson et al., 2003; Dougherty et al., 2004; Jennings et al., 2004), but medium or coarse spatial resolution images often generate relatively poor results, especially in a complex urban-rural frontier, because of the spectral confusion between impervious surfaces and other land covers and the mixed pixel problems (Wu and Murray, 2003; Lu and Weng, 2006a; 2006b). This research for mapping per-pixel impervious surfaces was based on the combination of filtering images and unsupervised classification of Landsat spectral signatures. The fact that the red-band images in Landsat TM/ETM+/MSS have high spectral values for impervious surfaces but have low spectral values for vegetation and water/wetland provides a potential to rapidly map impervious surface areas. The minimum and maximum filter with a window size of 3×3 pixels was separately applied to the Landsat red band image. The image differencing between maximum and minimum filtering images was used to highlight linear features (mainly roads) and other impervious surfaces. Examining the differencing image indicated that a threshold of 13 (the value from differencing image) can be used to extract the impervious surface image. The spectral signature of the initial impervious surface image was then extracted and was further classified into 60 clusters using an unsupervised classification method, to refine the impervious surface image by removing the pixels with non-impervious surfaces. Finally, manual editing of the impervious surface image was conducted to make sure that all impervious surfaces, especially in urban regions, were extracted. The same procedure was applied to all selected Landsat images to generate the per-pixel based time series impervious surface data sets.
3.3 Developing fractional images with linear spectral mixture analysis
As per-pixel methods based on medium or coarse spatial resolution often overestimate or underestimate impervious surface areas, it is important to estimate fractional impervious surface images in order to improve area estimation. Of the many methods for mapping impervious surfaces (Slonecker et al., 2001; Brabec et al., 2002), the linear spectral mixture analysis (LSMA)-based method has proven valuable for extracting fractional impervious surfaces from Landsat images (Wu and Murray, 2003; Lu and Weng, 2006a). LSMA is regarded as a physically based image processing tool. It supports repeatable and accurate extraction of quantitative subpixel information (Smith et al., 1990). The LSMA approach assumes that the spectrum measured by a sensor is a linear combination of the spectra of all components (endmembers) within the pixel and that the spectral proportions of the endmembers reflect proportions of the area covered by distinct features on the ground (Adams et al., 1995). A detailed description of LSMA is found in previous literature (e.g., Smith et al., 1990; Lu and Weng, 2004).
From the view of remotely sensed data, the urban landscape can be assumed a combination of four components: high-albedo objects, low-albedo objects, vegetation, and soil (Lu and Weng, 2004; 2006a). Previous research has indicated that the fraction images which are developed with LSMA have physical meaning (Wu and Murray, 2003; Lu and Weng, 2006a). The high-albedo fraction image highlights land covers with high spectral reflectance, such as bright impervious surfaces and dry bare soils; and the low-albedo fraction image highlights the land covers with low spectral reflectance, such as dark impervious surfaces, forested shade, water and wetlands. The soil fraction image highlights soil information, mainly located in agriculture and pasture lands and the vegetation fraction image highlights the forest and plantation information. Impervious surfaces are mainly concentrated in high-albedo and low-albedo fraction images (Lu and Weng, 2006a; 2006b).
In the LSMA approach, the selection of suitable endmembers is a key to successfully extracting fractional images. Minimum noise fraction transform (MNF) is often used to convert Landsat images into a new data set to support the selection of high quality endmembers. Four endmembers: vegetation, low-albedo, high-albedo, and soil, were identified from the MNF components (Lu and Weng, 2006a). A constrained least squares solution was then used to unmix the Landsat TM/ETM image into four fractional images and one error image. Because MSS has only four bands and the study area had very limited impervious surfaces in 1977, three endmembers (i.e., high-albedo, low-albedo and vegetation) were used.
3.4 Developing fractional impervious surface images through the combination of fractional images and per-pixel impervious surface images
One critical step in mapping impervious surfaces is the removal of impervious surface free pixels. By combining per-pixel impervious surfaces with high-albedo and low-albedo fraction images, a fractional impervious surface image was generated with the following rules: if the pixel is an impervious surface in the per-pixel based impervious surface image, then that pixel is extracted from the sum of high-albedo and low-albedo fraction images; otherwise, zero is assigned to the pixel. This procedure was used separately to map fractional imperious surface images from the multitemporal Landsat images.
3.5 Refining impervious surface areas by the integrated use of Landsat- and QuickBird-derived impervious surface images
Previous research has indicated that impervious surface areas developed from Landsat TM images are often overestimated or underestimated, depending on the proportion of impervious surfaces in a pixel (Wu and Murray, 2003; Lu and Weng, 2006a). One method which can be used to calibrate this bias is to develop a regression model to calibrate the TM-derived impervious surface images. In this research, the overlap area between the 2008 QuickBird-derived and the corresponding Landsat-derived impervious surface images were selected and used for sample collection based on the selection of one pixel for every five on the overlapped images. Because many pixels were non-impervious surfaces, they had zero values. After removal of all samples with zero values, 1512 samples were used to develop the calibration model. A scatterplot-based method was used to examine the relationship between both the 2008 Landsat-derived and QuickBird-derived impervious surface images. A regression model was developed to conduct the calibration.
3.6 Refining the multitemporal impervious surface images by image-to-image normalization
The mapping of impervious surface areas from time series remote sensing images can often be affected by different environmental conditions, such as soil moisture, atmospheric conditions, and vegetation phenology (Wu and Yuan, 2008; Hu and Weng, 2009). It is therefore necessary to calibrate the bias caused by these different conditions. It can be assumed that the same invariant locations in different dates of Landsat images should have the same fraction impervious surface areas in a pixel. Thus, a calibration model can be developed to calibrate the multitemporal impervious surface images. All the Landsat-derived fractional impervious surface images were stacked into one file. Pseudo-invariant objects, i.e., unchanged impervious surface objects from the time series fractional impervious surface images were selected. A total of 24 sample points were selected along the major highway and urban areas, with the assumption that the unchanged impervious surfaces have the same fraction value in a pixel. A regression model corresponding to each pair of images was developed based on the relationship between the reference data from the calibrated 2008 fractional impervious surface image and subject images from other dates of Landsat-derived fractional impervious surface images. The regression models were then used to calibrate the extracted impervious surface images in order to reduce the impervious surface estimation bias caused by external factors such as different vegetation phenology and atmospheric conditions.
3.7 Evaluating the extracted fractional impervious surface images
Evaluation of impervious surface estimates can be challenging due to the difficulty in obtaining reference data, especially for historical data sets. High spatial resolution images such as aerial photographs and QuickBird images are often used to collect reference data. In this research, a 2007 QuickBird-derived impervious surface image was used to evaluate the 2007 Landsat TM-derived fractional impervious surface image after image normalization. The impervious surface image developed from the 2007 QuickBird image with 0.6 m spatial resolution was resampled to 30 m to produce a fractional impervious surface image. In order to reduce the geometric error between the QuickBird- and TM-derived impervious surface images, a window size of 3×3 pixels was used to select samples, based on the overlap area on both 2007 QuickBird- and TM-derived impervious surface images. Scatterplot analysis, correlation analysis, and root mean square error (RMSE) were used to examine the quality of the TM-derived fractional impervious surface image.
3.8 Examining the impervious surface dynamic change
In the urban-rural frontier, impervious surface increase is mainly due to the construction of individual buildings and roads. Because the areas of these objects are often smaller than the pixel size of Landsat images, geometric accuracies between the multitemporal images become critical for successful detection of impervious surface change. In this study area, due to the geometric errors between multitemporal Landsat images (less than one pixel) and small width of roads (usually smaller than the pixel size of the Landsat TM/ETM images), it is hard to spatially examine the impervious surface change with the pixel-by-pixel comparison of multitemporal impervious surface images. Therefore, a total impervious surface area for each date was calculated. The scatterplots showing relationships between total impervious surface areas and dates were developed to examine the impervious surface change trends.
4. Results and discussions
4.1 Calibration of the Landsat-derived fractional impervious surfaces with the QuickBird-derived impervious surface image
In theory, if the impervious surfaces are accurately estimated from both TM and QuickBird images, the scatterplot between both variables should show a very good linear relationship. As shown in Fig. 4, the impervious surface image developed in this research demonstrates a reasonably good result, although overestimation occurred when the impervious surfaces accounted for a relatively small proportion in a pixel and underestimation occurred when the impervious surfaces accounted for a large proportion in a pixel. This trend is similar to other previous research (Wu and Murray, 2003; Lu and Weng, 2006a; 2006b; Greenfield et al., 2009). Overall, a good linear relationship exists between the fractional impervious surface images developed independently from 2008 Landsat TM and QuickBird images. Based on the samples from QuickBird- and Landsat-derived impervious surface images, a linear regression model is established as follows:
Fig. 4. Relationship of impervious surface values from Landsat TM and QuickBird images.

| [1] |
where x is the fractional impervious surface values from 2008 Landsat TM image, and y is the calibrated fraction impervious surface values from the QuickBird image. The coefficient of determination (R2) is 0.45 for this regression model. This equation was used to calibrate the entire 2008 Landsat TM-derived fractional impervious surface image.
4.2 Normalization of the multitemporal Landsat-derived impervious surface images
Image-to-image normalization is valuable in reducing the impacts caused by different environmental conditions on the impervious surface estimation performance based on multitemporal remotely sensed data (Wu and Yuan, 2008; Hu and Weng, 2009). As an example, Fig. 5 demonstrates a very good linear relationship between the calibrated 2008 TM-derived impervious surface image and 2005 TM-derived impervious surface image. Similar relationships exist for other dates of impervious surface images, as summarized in Table 2. In this research, the 2008 calibrated impervious surface image was used as reference image, and other dates of Landsat-derived impervious surface images were used as subject images respectively. The R2 values for all Landsat-derived impervious surface images were greater than 0.6, except for the MSS image. The good linear relationships indicate that linear regression models can be used to calibrate fractional impervious surface images, thus, improving the performance of impervious surface estimation.
Fig. 5. Relationship of the impervious surface values from different dates of Landsat images.

Table 2. Regression equations for the normalization of the multitemporal Landsat-derived fractional impervious surface images.
| Year | Regression equation | R2 |
|---|---|---|
| 2007 | y = 0.8148x + 0.1552 | 0.70 |
| 2005 | y = 0.7789x + 0.0468 | 0.65 |
| 2002 | y = 0.5354x + 0.2473 | 0.62 |
| 1999 | y = 0.6305x + 0.2061 | 0.65 |
| 1996 | y = 0.7093x + 0.1862 | 0.61 |
| 1990 | y = 0.6688x + 0.1535 | 0.60 |
| 1984 | y = 0.6253x + 0.0952 | 0.76 |
| 1977 | y = 0.5353x + 0.0991 | 0.47 |
Note: y is the calibrated fractional impervious surface, and x is the fractional impervious surface before calibration.
The relatively small R2 value for the regression model based on the MSS in 1977 may be caused by the following problems: the coarse spatial and spectral resolutions in MSS (80 m, 4 bands) compared with TM/ETM (30 m, 6 bands) make it difficult to accurately map sub-pixel impervious surfaces based on spectral mixture analysis; the very limited impervious surface areas in 1977 make the difficulty in collecting sufficiently sample plots for image-to-image normalization, and the geometric correction errors between MSS and other TM images produce the location errors during the sample data collection. Another problem is that the assumption of the same invariant locations between 1977 and 2008 may be not true due to the rapid land use/cover change and the different spatial resolution between MSS and TM images.
4.3 Evaluation of the 2007 Landsat-derived impervious surface image with the 2007 QuickBird-derived impervious surface image
A good agreement between the TM-derived impervious surface result and corresponding 2007 QuickBird-derived result was obtained (Fig. 6). The correlation coefficient between them is 0.89 with a RMSE of 0.128. This error is acceptable for such a complex urban-rural frontier. The high correlation coefficient and relatively low RMSE indicate that the 2007 TM-derived impervious surface image is reliable, and also implies that the method developed in this research for estimating fractional impervious surface areas is feasible.
Fig. 6. Accuracy assessment based on QuickBird image in 2007.

4.4 Analysis of dynamic change in impervious surfaces
The impervious surface expansion from 1977 to 2008 is easily perceived. As part of the study area illustrated in Fig. 7, the spatial distribution of the impervious surface areas expanded rapidly, mainly taking place as urban extent and roads expanded. Overall, impervious surface areas increased at an exponential rate, as shown in Fig. 8, especially the expansion rate was increased after the year of 2000. Comparing the increasing rates between per-pixel based impervious surface areas and the fractional impervious surface areas, the impervious surface change trends are similar. However, per-pixel based impervious surface areas can be overestimated by 50-60% when compared with fractional impervious surface areas, indicating the importance of sub-pixel based estimation method in the urban-rural areas where impervious surface areas account for very small proportion in the study area. The results illustrated in Fig. 8 demonstrate importance of the two-step calibration method in improving impervious surface area estimation, especially in urban-rural frontiers, without implementing image classification for historical Landsat images, which are often difficult due to lack of training sample data.
Fig. 7. Impervious surface change from 1977 to 2008, illustrating part of the study area in the manicipio of Lucas, Mato Grosso, Brazil (for the sake of clear display of impervious surface change, per-pixel based impervious surface images were used in this figure).
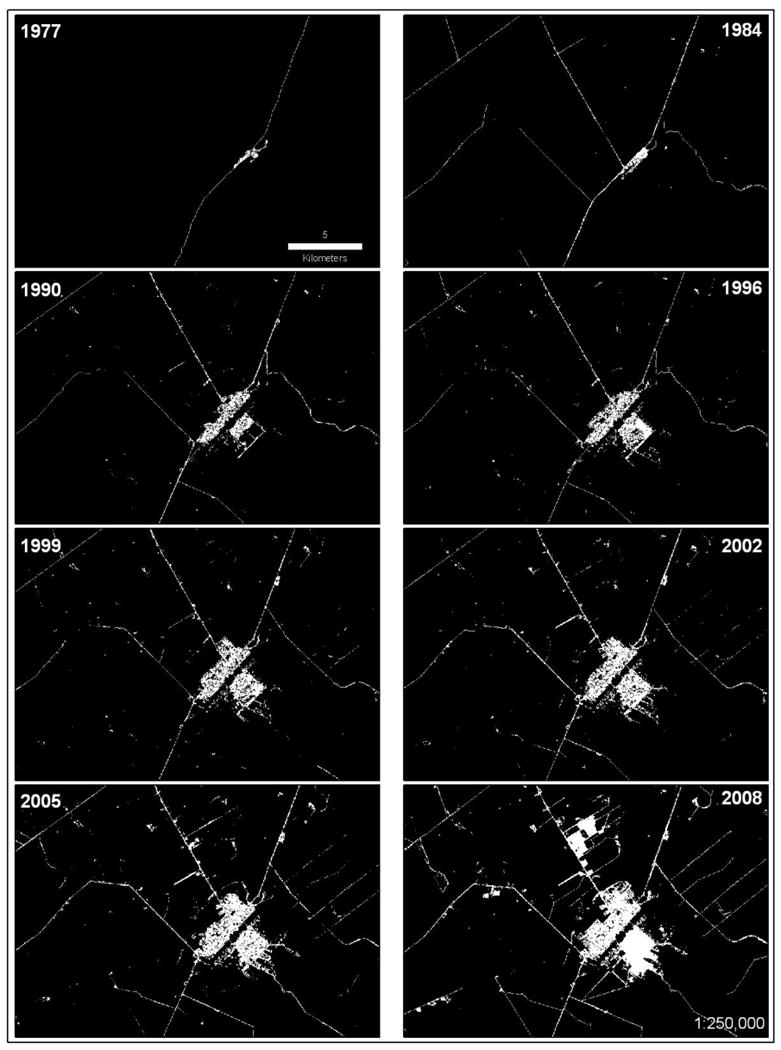
Fig. 8. The impervious surface dynamic change trends between 1977 and 2008.

5. Summary
Complex impervious surfaces in urban landscape and mixed pixels in medium and coarse spatial resolution images make mapping and monitoring of impervious surface change a challenge. Traditional per-pixel based image classification methods cannot effectively handle the mixed pixel problem and sub-pixel based methods cannot effectively separate the pixels of impervious surfaces from other land covers, thus, underestimation or overestimation of impervious surface areas are common, depending on the proportion of impervious surface in a pixel. The method developed in this paper, which is based on the combination of per-pixel based impervious surface mapping with filtering and unsupervised classification and sub-pixel based method with LSMA, can effectively map impervious surface distribution with Landsat images. The calibration with QuickBird-derived results can further reduce the bias caused by mixed pixel problems and improve impervious surface mapping performance. The normalization of multitemporal impervious surface images can reduce the bias caused by different environmental conditions in the multitemporal Landsat images, and thus improve the quality of time series impervious surface data sets. Therefore, the use of multitemporal fractional impervious surface images provides a new method for the examination of urban expansion, especially in a complex urban-rural frontier where impervious surfaces only account for a small proportion of the study area. One advantage of the method is that the impervious surface area estimation can be considerably improved when compared with per-pixel based results. Another advantage is that the change detection in a complex urban-rural frontier becomes feasible by the use of multitemporal impervious surface images without the use of training samples for historical remote sensing data, which is often difficult to acquire.
Acknowledgments
The authors wish to thank the National Institute of Child Health and Human Development at NIH (grant # R01 HD035811) for the support of this research, addressing population-and-environment reciprocal interactions in several regions of the Brazilian Amazon. Any errors are solely the responsibility of the authors and not of the funding agencies.
Footnotes
Publisher's Disclaimer: This is a PDF file of an unedited manuscript that has been accepted for publication. As a service to our customers we are providing this early version of the manuscript. The manuscript will undergo copyediting, typesetting, and review of the resulting proof before it is published in its final citable form. Please note that during the production process errors may be discovered which could affect the content, and all legal disclaimers that apply to the journal pertain.
References
- Adams JB, Sabol DE, Kapos V, Filho RA, Roberts DA, Smith MO, Gillespie AR. Classification of multispectral images based on fractions of endmembers: application to land cover change in the Brazilian Amazon. Remote Sensing of Environment. 1995;52(2):137–154. [Google Scholar]
- Bauer ME, Loffelholz BC, Wilson B. Estimating and mapping impervious surface area by regression analysis of Landsat imagery. In: Weng Q, editor. Remote Sensing of Impervious Surfaces. Boca Raton, FL: Taylor & Francis Group, LLC; 2008. pp. 3–19. [Google Scholar]
- Brabec E, Schulte S, Richards PL. Impervious surface and water quality: a review of current literature and its implications for watershed planning. Journal of Planning Literature. 2002;16(4):499–514. [Google Scholar]
- Chander G, Markham BL, Helder DL. Summary of current radiometric calibration coefficients for Landsat MSS, TM, ETM+, and EO-1 ALI sensors. Remote Sensing of Environment. 2009;113(5):893–903. [Google Scholar]
- Coppin PR, Bauer ME. Digital change detection in forest ecosystems with remote sensing imagery. Remote Sensing Reviews. 1996;13(3):207–234. [Google Scholar]
- Coppin P, Jonckheere I, Nackaerts K, Muys B, Lambin E. Digital change detection methods in ecosystem monitoring: a review. International Journal of Remote Sensing. 2004;25(9):1565–1596. [Google Scholar]
- Cracknell AP. Synergy in remote sensing – what's in a pixel? International Journal of Remote Sensing. 1998;19(11):2025–2047. [Google Scholar]
- Deguchi C, Sugio S. Estimations for the percentage of impervious area by the use of satellite remote sensing imagery. Journal of Soil and Water Conservation. 1994;29(1-2):135–144. [Google Scholar]
- Dougherty M, Dymond RL, Goetz SJ, Jantz CA, Goulet N. Evaluation of impervious surface estimates in a rapidly urbanizing watershed. Photogrammetric Engineering and Remote Sensing. 2004;70(11):1275–1284. [Google Scholar]
- Elvidge CD, Tuttle BT, Sutton PC, Baugh KE, Howard AT, Milesi C, Bhaduri B, Nemani R. Global distribution and density of constructed impervious surfaces. Sensors. 2007;7(9):1962–1979. doi: 10.3390/s7091962. [DOI] [PMC free article] [PubMed] [Google Scholar]
- Esch T, Himmler V, Schorcht G, Thiel M, Wehrmann T, Bachofer F, Conrad C, Schmidt M, Dech S. Large-area assessment of impervious surface based on integrated analysis of single-date Landsat-7 images and geospatial vector data. Remote Sensing of Environment. 2009;113(8):1678–1690. [Google Scholar]
- Fisher P. The pixel: a snare and a delusion. International Journal of Remote Sensing. 1997;18(3):679–685. [Google Scholar]
- Gillies RR, Box JB, Symanzik J, Rodemaker EJ. Effects of urbanization on the aquatic fauna of the Line Creek watershed, Atlanta – a satellite perspective. Remote Sensing of Environment. 2003;86(3):411–422. [Google Scholar]
- Greenfield EJ, Nowak DJ, Walton JT. Assessment of 2001 NLCD percent tree and impervious cover estimates. Photogrammetric Engineering & Remote Sensing. 2009;75(11):1279–1286. [Google Scholar]
- Hodgson ME, Jensen JR, Tullis JA, Riordan KD, Archer CM. Synergistic use of Lidar ad color aerial photography for mapping urban parcel imperviousness. Photogrammetric Engineering & Remote Sensing. 2003;69(9):973–980. [Google Scholar]
- Hu X, Weng Q. Estimating impervious surfaces from medium spatial resolution imagery using the self-organizing map and multi-layer perceptron neural networks. Remote Sensing of Environment. 2009;113(10):2089–2102. [Google Scholar]
- Jennings DB, Jarnagin ST, Ebert CW. A modeling approach for estimating watershed impervious surface area from national land cover data 92. Photogrammetric Engineering & Remote Sensing. 2004;70(11):1295–1307. [Google Scholar]
- Ji M, Jensen JR. Effectiveness of subpixel analysis in detecting and quantifying urban imperviousness from Landsat Thematic Mapper. Geocarto International. 1999;14(4):31–39. [Google Scholar]
- Kennedy RE, Townsend PA, Gross JE, Cohen WB, Bolstad P, Wang YQ, Adams P. Remote sensing change detection tools for natural resource managers: understanding concepts and tradeoffs in the design of landscape monitoring projects. Remote Sensing of Environment. 2009;113(7):1382–1396. [Google Scholar]
- Lu D, Mausel P, Brondízio E, Moran E. Assessment of atmospheric correction methods for Landsat TM data applicable to Amazon basin LBA research. International Journal of Remote Sensing. 2002;23(13):2651–2671. [Google Scholar]
- Lu D, Mausel P, Brondizio E, Moran E. Change detection techniques. International Journal of Remote Sensing. 2004;25(12):2365–2407. [Google Scholar]
- Lu D, Weng Q. Spectral mixture analysis of the urban landscapes in Indianapolis with Landsat ETM+ imagery. Photogrammetric Engineering & Remote Sensing. 2004;70(9):1053–1062. [Google Scholar]
- Lu D, Weng Q. Use of impervious surface in urban land use classification. Remote Sensing of Environment. 2006a;102(1-2):146–160. [Google Scholar]
- Lu D, Weng Q. Spectral mixture analysis of ASTER images for examining the relationship between urban thermal features and biophysical descriptors in Indianapolis, United States. Remote Sensing of Environment. 2006b;104(2):157–167. [Google Scholar]
- Lu D, Batistella M, Moran E, de Miranda EE. A comparative study of Landsat TM and SPOT HRG images for vegetation classification in the Brazilian Amazon. Photogrammetric Engineering & Remote Sensing. 2008;74(3):311–321. doi: 10.14358/pers.74.3.311. [DOI] [PMC free article] [PubMed] [Google Scholar]
- Lu D, Weng Q. Extraction of urban impervious surface from an IKONOS image. International Journal of Remote Sensing. 2009;30(5):1297–1311. [Google Scholar]
- Lu D, Hetrick S, Moran E. Impervious surface mapping with QuickBird imagery. International Journal of Remote Sensing. 2010 doi: 10.1080/01431161003698393. forthcoming. [DOI] [PMC free article] [PubMed] [Google Scholar]
- Madhavan BB, Kubo S, Kurisaki N, Sivakumar TVLN. Appraising the anatomy and spatial growth of the Bangkok Metropolitan area using a vegetation-impervious-soil model through remote sensing. International Journal of Remote Sensing. 2001;22(5):789–806. [Google Scholar]
- Mohapatra RP, Wu C. Subpixel imperviousness estimation with IKONOS imagery: an artificial neural network approach. In: Weng Q, editor. Remote Sensing of Impervious Surfaces. Boca Raton, FL: Taylor & Francis Group, LLC; 2008. pp. 21–37. [Google Scholar]
- Phinn S, Stanford M, Scarth P, Murray AT, Shyy PT. Monitoring the composition of urban environments based on the vegetation-impervious surface-soil (VIS) model by subpixel analysis techniques. International Journal of Remote Sensing. 2002;23(20):4131–4153. [Google Scholar]
- Powell SL, Cohen WB, Yang Z, Pierce JD, Alberti M. Quantification of impervious surface in the Snohomish Water Resources Inventory Area of Western Washington from 1972-2006. Remote Sensing of Environment. 2008;112(4):1895–1908. [Google Scholar]
- Rashed T, Weeks JR, Gadalla MS, Hill AG. Revealing the anatomy of cities through spectral mixture analysis of multisepctral satellite imagery: a case study of the Greater Cairo region, Egypt. Geocarto International. 2001;16(4):7–18. [Google Scholar]
- Rashed T, Weeks JR, Roberts D, Rogan J, Powell R. Measuring the physical composition of urban morphology using multiple endmember spectral mixture models. Photogrammetric Engineering & Remote Sensing. 2003;69(9):1011–1020. [Google Scholar]
- Ridd MK. Exploring a V-I-S (Vegetation-Impervious Surface-Soil) model for urban ecosystem analysis through remote sensing: comparative anatomy for cities. International Journal of Remote Sensing. 1995;16(12):2165–2185. [Google Scholar]
- Seto KC, Liu W. Comparing ARTMAP neural network with the maximum-likelihood classifier for detecting urban change. Photogrammetric Engineering and Remote Sensing. 2003;69(9):981–990. [Google Scholar]
- Shaban MA, Dikshit O. Improvement of classification in urban areas by the use of textural features: the case study of Lucknow city, Uttar Pradesh. International Journal of Remote Sensing. 2001;22(4):565–593. [Google Scholar]
- Singh A. Digital change detection techniques using remotely sensed data. International Journal of Remote Sensing. 1989;10(6):989–1003. [Google Scholar]
- Slonecker ET, Jennings D, Garofalo D. Remote sensing of impervious surface: a review. Remote Sensing Reviews. 2001;20(3):227–255. [Google Scholar]
- Smith MO, Ustin SL, Adams JB, Gillespie AR. Vegetation in Deserts: I. A regional measure of abundance from multispectral images. Remote Sensing of Environment. 1990;31(1):1–26. [Google Scholar]
- Sutton PC, Anderson SA, Elvidge CD, Tuttle BT, Ghosh T. Paving the planet: impervious surface as proxy measure of the human ecological footprint. Progress in Physical Geography. 2009;33(4):510–527. [Google Scholar]
- Wang Y, Zhou Y, Zhang X. The SPLIT and MASC models for extraction of impervious surface areas from multiple remote sensing data. In: Weng Q, editor. Remote Sensing of Impervious Surfaces. Boca Raton, FL: Taylor & Francis Group, LLC; 2008. pp. 77–92. [Google Scholar]
- Weng Q, editor. Remote Sensing of Impervious Surfaces. Boca Raton, FL: Taylor & Francis Group, LLC; 2007. p. 454. [Google Scholar]
- Weng Q, Hu X, Lu D. Extracting impervious surface from medium spatial resolution multispectral and hyperspectral imagery: a comparison. International Journal of Remote Sensing. 2008;29(11):3209–3232. [Google Scholar]
- Weng Q, Hu X, Liu H. Estimating impervious surfaces using linear spectral mixture analysis with multitemporal ASTER images. International Journal of Remote Sensing. 2009;30(18):4807–4830. [Google Scholar]
- Wu C, Murray AT. Estimating impervious surface distribution by spectral mixture analysis. Remote Sensing of Environment. 2003;84(4):493–505. [Google Scholar]
- Wu C. Normalized spectral mixture analysis for monitoring urban composition using ETM+ imagery. Remote Sensing of Environment. 2004;93(4):480–492. [Google Scholar]
- Wu C, Yuan F. Seasonal sensitivity analysis of impervious surface estimation with satellite imagery. Photogrammetric Engineering & Remote Sensing. 2008;73(12):1393–1402. [Google Scholar]
- Wu C. Quantifying high-resolution impervious surfaces using spectral mixture analysis. International Journal of Remote Sensing. 2009;30(11):2915–2932. [Google Scholar]
- Xian G, Crane M. Assessments of urban growth in the Tampa Bay watershed using remote sensing data. Remote Sensing of Environment. 2005;97(2):203–215. [Google Scholar]
- Xian G. Assessing urban growth with subpixel impervious surface coverage. In: Weng Q, Quattrochi DA, editors. Urban Remote Sensing. Boca Raton, FL: Taylor & Francis Group, LLC; 2007. pp. 179–200. [Google Scholar]
- Xian G. Mapping impervious surfaces using classification and regression tree algorithm. In: Weng Q, editor. Remote Sensing of Impervious Surfaces. Boca Raton, FL: Taylor & Francis Group, LLC; 2008. pp. 39–58. [Google Scholar]
- Xian G, Crane MP, McMahon C. Quantifying multitemporal urban development characteristics in Las Vegas from Landsat and Aster data. Photogrammetric Engineering & Remote Sensing. 2008;74(4):473–481. [Google Scholar]
- Yang L, Xian G, Klaver JM, Deal B. Urban land-cover change detection through sub-pixel imperviousness mapping using remotely sensed data. Photogrammetric Engineering & Remote Sensing. 2003a;69(9):1003–1010. [Google Scholar]
- Yang L, Huang C, Homer C, Wylie B, Coan M. An approach for mapping large-area impervious surface: synergistic use of Landsat 7 ETM+ and high spatial resolution imagery. Canadian Journal of Remote Sensing. 2003b;29(2):230–240. [Google Scholar]
- Yang L, Jiang L, Lin H, Liao M. Quantifying sub-pixel urban impervious surface through fusion of optical and InSAR imagery. GIScience and Remote Sensing. 2009;46(2):161–171. [Google Scholar]