

Abstract
Although tumor cells obtained from human patients by image-guided intervention are a valuable source for diagnosing cancer, conventional means of analysis are limited. Here, we report the development of a quantitative micro-NMR (nuclear magnetic resonance) system for rapid, multiplexed analysis of human tumors. We implemented the technology in a clinical setting to analyze cells obtained by fine-needle aspirates from suspected lesions in 50 patients and validated the results in an independent cohort of another 20 patients. Single fine-needle aspirates yielded sufficient numbers of cells to enable quantification of multiple protein markers in all patients within 60 min. Moreover, using a four-protein signature, we report a 96% accuracy for establishing a cancer diagnosis, surpassing conventional clinical analyses by immunohistochemistry. Our results also show that protein expression patterns decay with time, underscoring the need for rapid sampling and diagnosis close to the patient bedside. We also observed a surprising degree of heterogeneity in protein expression both across the different patient samples and even within the same tumor, which has important implications for molecular diagnostics and therapeutic drug targeting. Our quantitative point-of-care micro-NMR technique shows potential for cancer diagnosis in the clinic.
INTRODUCTION
Primary and metastatic solid tumors comprise cancer cells, host cells such as endothelial cells and fibroblasts, and inflammatory immune cells. Yet, although individual cancer cells may exhibit a stable signature of protein marker expression (1, 2), tumors in general are highly adaptive and heterogeneous (3, 4) and thus may respond differently to therapeutics based on stochastic differences in protein expression across the cancer cell population (5). It is therefore becoming clear that molecular diagnosis using cancer cells will yield critical information for classifying tumors, stratifying patients for molecular targeted therapies and for assessing treatment efficacy (6). Expanding knowledge of the proteome in clinically harvested cancer cells may also yield new information about tumor biology (7).
Within a clinical setting, cancer cells from primary tumors are typically obtained through image-guided intervention or open surgical procedures (8). Percutaneous biopsy is a well-established clinical procedure that yields cells for cytology using 22-gauge (22G) fine-needle aspirates, and small tissue fragments for histology by core biopsies using 16G to 19G needles. Samples are commonly processed using conventional histological stains before immunohistochemical evaluation if sufficient tissue remains (tissue sections contain billions of cells). However, immunohistochemical evaluation is only semiquantitative, time-consuming, and technically challenging.
To date, the routine study of cancer cells by multiplexed molecular diagnostic approaches has been hampered by four major challenges. First, the standard methods of immunohistochemical evaluation require tissue fragments (several cubic millimeters), and this limits the number of markers processed per specimen. Procuring more tissue through larger core biopsies (<16G needles), however, carries an increased risk of procedural complications, exacerbated by frequent use of clinically indicated anticoagulants and aspirin. Second, tissue samples may be hypocellular, fragmented, or necrotic as a result of inherent sampling variation. Third, not all proteins of interest are invariably expressed at sufficiently high levels to be detected by routine immunohistochemical evaluation (9). Finally, manual or automated imaging analyses and quantitation of protein marker expression can be technically challenging (10). Indeed, samples that cannot be used for diagnosis and false-negative results within larger clinical studies occur in 5 to 25% of tumor biopsies (11, 12). This often leaves clinicians with the dilemma of whether to rebiopsy the patient and further the risk of morbidity. Here, we have developed a point-of-care molecular diagnostic system for rapid, quantitative, and multiplexed analysis of protein expression in cancer cells obtained by fine-needle aspirates of patients' tumors for real-time analysis within a clinical setting.
In previous studies, we created nanoparticle-based magnetic affinity ligands for both in vivo imaging (13, 14) and cell-based diagnostics using early iterations of miniaturized nuclear magnetic resonance (NMR) devices (15, 16). These reports demonstrated the potential for protein analysis of scarce cancer cell populations using tumor cell lines and mouse models. However, the use of these tools has not yet extended from the regulated laboratory setting into the clinical setting because of the technical complexities associated with assay preparation, the need to measure multiple rather than single biomarkers, and data processing. Given the finite number of channels in earlier micro-NMR (μNHR) devices, previous molecular analyses were limited to one to three proteins of interest.
Here, we report the development of a next-generation, integrated, clinical μNHR device (DMR-3) capable of rapid and quantitative analyses of multiple protein markers. We report the first human-based application of this μNHR device, notably for molecular profiling of cancer cells obtained by fine-needle aspirates from suspected intraabdominal tumors. The system incorporates multiplexed measurement capacity, microfluidic specimen delivery, feedback control for temperature variations, and a user-friendly interface within a 10 cm by 10 cm footprint for clinical bedside operation (Fig. 1). Compared to earlier devices (15, 17), DMR-3 is more sensitive and temperaturestable, contains integrated analysis and measurement software, and can be operated through a simple-to-use smart phone application (Fig. 1). After optimization of magnetic affinity ligands, we clinically tested this device on 50 patients with suspected malignancies and then validated our findings in an independent cohort containing an additional 20 patients (n = 70 patients total). To determine whether this new technology could overcome current diagnostic challenges in oncology, we specifically designed the study to address the following questions: What is the diagnostic accuracy of the μNHR technology and how does it compare to the current standard of care? What is the heterogeneity of marker expression within and across patients? What are the ex vivo properties of recently harvested cancer cells with respect to marker distribution, cellular half-lives, and changes in biomarker profiles over time (18)? Overall, we show that processed samples from single fine-needle aspirates of intra-abdominal lesions from human patients with suspected malignancies contain sufficiently high numbers of cells to enable real-time quantitative analysis of many molecular markers. We thus anticipate that this real-time diagnostic technology will have a wide range of applications in oncology and that the approach may be transferable to testing of different markers in other cell types and specimens.
Fig. 1.

The μNMR clinical analysis system (DMR-3) and bioconjugation strategy (BOND-2). (Left, top) Complete μNMR system for use at the patient's bedside. The bottom component contains all of the circuitry for NMR measurements, whereas the top enclosure holds a permanent magnet and chip-sized microliter-volume sensors. (Left, bottom) State-of-the-art μNMR probe used for sensing within the mini magnet. (Right, top) Smart phone interface for operating the μNMR system. (Right, bottom) Fine-needle aspirates from each patient sample were processed with a bio-orthogonal amplification strategy adapted for clinical samples. The bio-orthogonal amplification allows ultrasensitive detection of cellular proteins.
RESULTS
Quantitation of cellular samples
A total of 50 patients, presenting with suspected intra-abdominal malignancies and referred for routine biopsy, were initially enrolled in the study. Of these, lesions from 44 patients were found to be malignant and 6 were benign, as determined by repeat core biopsies, serial follow-ups, imaging [including positron emission tomography–computed tomography (PET-CT)], and clinical information (Table 1). For each patient, a one- to two-pass fine-needle aspirate from a suspected abdominal malignancy was obtained with a 22G needle. This was followed by a series of routine core biopsies (17G) for conventional standard-of-care analysis. In selected patients, additional fine-needle aspirate samples were obtained to further quantify sample heterogeneity and to validate our measurements against accepted gold standards. Each fine-needle aspirate sample was washed with 1 to 2 ml of buffered saline and processed for μNHR for subsequent measurement of 11 markers. These markers included nine well-established cancer-related markers [EpCAM (epithelial cell adhesion molecule), MUC-1 (mucin 1, cell surface associated), HER2, EGFR (epidermal growth factor receptor), B7–H3, CK18, Ki-67, p53, and vimentin], a count of CD45-positive cells, and total cell density. A priori selection of these protein markers was based on current practice (for example, EpCAM and CK18) (19, 20) or on reports of clinically relevant overexpression of these proteins in certain tumors (21–23). To maximize detection sensitivity, we adapted a highly efficient bio-orthogonal approach for sensing that uses trans-cyclooctene (TCO)/tetrazine (Tz) chemistry (Fig. 1) (24). Curves calibrating μNHR signals with protein expression levels by cells for each of the markers were obtained before the study (see fig. S1). Our μNHR-derived measurements of markers in clinical samples were comparable with accepted gold standards (Fig. 2 and figs. S1 and S2). For example, the correlation coefficients between μNHR and enzyme-linked immunosorbent assay (ELISA), flow cytometry, or immunohistochemistry measurements for expression of EGFR, a clinically important marker, were 0.99, 0.98, or 0.93, respectively (Fig. 2).
Table 1.
Clinical information for 70 patients with suspected abdominal malignancies.
| Characteristic | Original diagnostic set |
Independent test set |
||
|---|---|---|---|---|
| Number | % | Number | % | |
| Number of patients | 50 | 20 | ||
| Age | ||||
| Median | 64 | 63 | ||
| Range | 29–86 | 24–90 | ||
| Gender | ||||
| Male | 24 | 48 | 7 | 35 |
| Female | 26 | 52 | 13 | 65 |
| Lesion type | ||||
| Malignant | 44 | 88 | 14 | 70 |
| Benign | 6 | 12 | 6 | 30 |
| Tumor subtypes | ||||
| Breast | 2 | 4.5 | 2 | 14 |
| Gastrointestinal | 13 | 30 | 4 | 28 |
| Genitourinary | 3 | 6.5 | 1 | 7 |
| Gynecologic | 4 | 9 | 3 | 22 |
| Lung | 8 | 18 | 1 | 7 |
| Pancreatic | 7 | 16 | 3 | 22 |
| Undifferentiated | 7 | 16 | 0 | 0 |
| History | ||||
| Previous history of cancer | 30 | 60 | 4 | 20 |
| No previous therapies | 20 | 42 | 7 | 35 |
| Active treatment | 11 | 22 | 9 | 45 |
| Biopsy site* | ||||
| Visceral | 36 | 72 | 9 | 45 |
| Nonvisceral | 14 | 28 | 11 | 55 |
| Lesion size (axial diameter) | ||||
| <1 cm | 3 | 6 | 10 | 50 |
| 1 to 3 cm | 25 | 50 | 6 | 30 |
| >3 cm | 22 | 44 | 4 | 20 |
| Biopsy modality | ||||
| Ultrasound | 14 | 28 | 16 | 80 |
| CT | 36 | 72 | 4 | 20 |
Visceral sites include liver, brain, adrenal glands, pancreas, and kidney. Nonvisceral sites include lymph nodes, abdominal wall, breast, bones, and skin.
Fig. 2.

Validation of NMR measurements. (Top) Plots showing the correlation of EGFR measurements obtained by μNMR versus ELISA, FACS, or immunohistochemistry (IHC) in clinical samples where sufficient cells were available for conventional proteomic techniques (typically 105 to 106 for ELISA and FACS versus 102 for μNMR). Note the excellent correlation coefficients for the different methods. (Bottom) Representative immunofluorescence stains of a representative human sample. The primary antibody (green) was labeled with Alexa Fluor 488 and TCO. The magnetic nanoparticle (MNP) (red) was labeled with VT680 and Tz. Note colocalization between nanoparticles (conferring NMR properties) and antibody (indicating protein content). For additional calibration data, see figs. S1 and S2. AU, arbitrary unit.
All fine-needle aspirate samples yielded sufficient cell numbers for subsequent μNMR analysis. On average, 3866 ± 456 cells were obtained per patient. Of these, about one-third were CD45-positive leukocytes (1354 ± 207 cells). The remaining cells were primarily tumor cells, as determined by extensive fluorescence-activated cell sorting (FACS) analysis in optimization studies. These cells were aliquoted into samples containing an average of ~200 cells for each of the nine biomarker measurements. To determine the global expression levels of each marker, we created waterfall plots to determine overall distribution (Fig. 3). As expected, there was a spectrum of marker expression, with about one-third of samples showing high, intermediate, or low/absent protein levels. Samples from patients with benign tumors typically fell into the latter two categories.
Fig. 3.

Distribution of protein expression markers. Waterfall plots showing the expression levels of each of the different biomarkers sorted from high (left) to low (right). Each column represents a different patient sample (green, malignant; blue, benign).
Heterogeneous expression of cancer-related proteins across epithelial tumors
To determine whether protein expression levels (shown in Fig. 3) correlated among samples, we plotted them for each patient and found that there was considerable heterogeneity in the magnitude of expression across patient samples (Fig. 4). To further examine the interrelationship between markers, we calculated Spearman correlations (Fig.5). MUC-1,EGFR, B7–H3, and HER2 demonstrated moderate correlations with one another (coefficients ranging from 0.4 to 0.6). No strong associations were found between EpCAM expression and the other four extracellular markers. Intracellular and extracellular marker expression did not correlate strongly with one another. Figure 6 displays the distribution of individual markers per cell. With the exception of MUC-1, all extracellular markers displayed lower variability, whereas intracellular markers generally showed higher variability. In the samples tested, no single marker was able to universally discriminate between samples from patients with malignant or benign tumors.
Fig. 4.

Expression of different protein biomarkers arranged by patient number. Patients 5, 12, 17, 18, 21, and 42 had benign lesions, and the remainder had various epithelial cancers (breast, gastrointestinal, genitourinary, gynecological, lung, pancreatic, or undifferentiated).
Fig. 5.
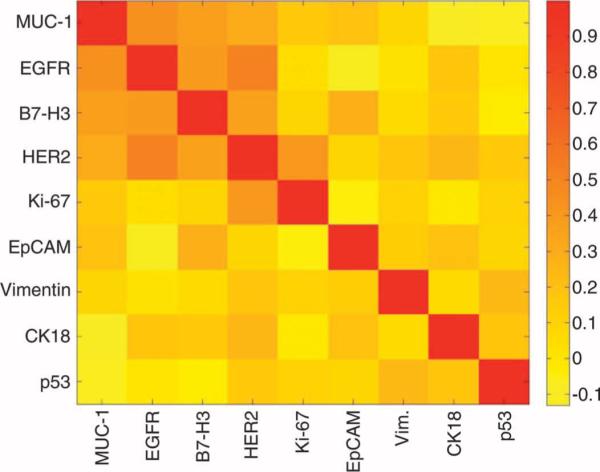
A graphical representation of the Spearman correlation coefficients (0, no correlation; 1, perfect correlation) between protein markers created to examine their interrelationship. For example, EGFR and HER2 have a good correlation (coefficient = 0.6), whereas EpCAM and HER2 have a poor correlation (coefficient = 0.1).
Fig. 6.

Variability of protein marker expression stratified by diagnosis and by global leukocyte versus nonleukocyte comparisons. (Left) Individual marker expression for both malignant and benign samples. (Right) Overall leukocyte and nonleukocyte cell counts.
Diagnostic sensitivity, specificity, and accuracy of cancer markers
To determine the clinical performance of the nine cancer-related markers, we performed receiver operating characteristic (ROC) analyses. Figure 7 compares the area under ROC curves (Az values) for individual markers, a dual marker pair (EpCAM and CK18), and the best triple and quadruple marker combinations. We next established a threshold for creating a classification rule based on a single marker or on the estimated risk score function of a marker combination. Optimized diagnostic marker combinations and their discriminatory values were then retrospectively analyzed for each patient sample (Table 2). Among individual markers, MUC-1 displayed the highest area under the curve (Az = 0.82), closely followed by EGFR and HER2. EpCAM, a marker routinely used for analyzing circulating tumor cells (25), showed a lower Az (0.65). Even the combination of EpCAM and CK18 (the accepted criterion used to identify circulating tumor cells in peripheral blood) showed a low Az value(0.66). Table2 summarizes the diagnostic sensitivity, specificity, and accuracy for each marker and combination of markers, along with their respective optimized μNMR threshold values for malignancy. The greatest accuracy for our cohort was observed for a statistically weighted (see Materials and Methods) quadruple marker subset (MUC-1 + EGFR + HER2 + EpCAM; 96% accuracy); this was followed closely by weighted triple markers (MUC-1 + EGFR + HER2; 92% accuracy). EpCAM and CK18 achieved an overall diagnostic accuracy of 80%, where a higher sensitivity (84%) was offset by low specificity (50%). The quadruple marker combination correctly diagnosed 48 of 50 patients as having either malignant or benign tumors. Both incorrect cases (patients 21 and 42) only contained evidence of inflammation in their core biopsies, marked by the presence of reactive fibrosis, histiocytes, and other inflammatory cells but without evidence of any cancer cells. It is well appreciated that when the same dataset is used to generate a classification rule and to derive diagnostic accuracies, the results may be overly optimistic. To reduce this potential bias, we used “leave-one-out” cross-validation techniques to estimate prediction accuracies and used the bootstrap method to estimate the SE for the accuracy estimate. Table S1 summarizes the 95% confidence levels (CLs) for marker combinations using this method and confirms their high accuracies. To eliminate any remaining bias, we also used an independent patient test cohort.
Fig. 7.

ROC curves. ROC curves were calculated for single protein markers, for a dual marker set, as well as for triple and quadruple marker combinations to determine optimum μNMR threshold values. Az, area under the curve; 95% CL, 95% confidence limits.
Table 2.
Sensitivity, specificity, and accuracy of different protein markers (single or in combination).
| Number | Marker | μNMR value | Sensitivity (%) | Specificity (%) | Accuracy (%) |
|---|---|---|---|---|---|
| Single | MUC-1 | 0.25 | 66 | 83 | 68 |
| EGFR | 0.20 | 64 | 83 | 66 | |
| B7-H3 | 0.11 | 68 | 67 | 68 | |
| HER2 | 0.24 | 64 | 100 | 68 | |
| Ki-67 | 0.10 | 68 | 67 | 68 | |
| EpCAM | 0.21 | 59 | 67 | 60 | |
| Vimentin | 0.08 | 59 | 67 | 60 | |
| CK18 | 0.06 | 73 | 50 | 70 | |
| p53 | 0.38 | 41 | 83 | 46 | |
| Dual | EpCAM + CK18 (unweighted) | 0.27 | 84 | 50 | 80 |
| EpCAM + CK18 (weighted) | 0.65 | 73 | 67 | 72 | |
| Triple | MUC-1 + HER2 + EGFR (weighted) | 1.23 | 95 | 67 | 92 |
| Quad | MUC-1 + HER2 + EGFR + EpCAM (weighted) | 1.6 | 100 | 67 | 96 |
Confirmation in an independent test cohort
To eliminate potential sources of error and data overfitting and to comply with recently published expert recommendations for proteomic biomarker studies (26), we tested the four-marker panel in 20 additional patients (Table 1). μNMR was able to establish correct diagnoses for all 20 patients at an accuracy of 100% and at a 95% CL of 83.2 to 100% (Table 3).
Table 3.
Verification of the diagnostic value for a panel of four protein markers (MUC-1 + HER2 + EGFR + EpCAM) in an independent test set of 20 patients.
| Patient | μNMR values |
μNMR diagnosis | True diagnosis | ||||
|---|---|---|---|---|---|---|---|
| MUC-1 | HER2 | EGFR | EpCAM | Quad | |||
| 51 | 0.17 | 0.00 | 0.19 | 0.02 | 0.37 | Benign | Benign |
| 52 | 0.00 | 0.00 | 0.00 | 0.00 | 0.00 | Benign | Benign |
| 53 | 0.00 | 0.09 | 0.01 | 0.06 | 0.16 | Benign | Benign |
| 54 | 1.35 | 0.89 | 4.38 | 1.83 | 8.44 | Malignant | Malignant |
| 55 | 8.03 | 0.49 | 0.89 | 2.86 | 12.27 | Malignant | Malignant |
| 56 | 0.55 | 0.33 | 0.24 | 0.31 | 1.43 | Benign | Benign |
| 57 | 8.28 | 0.00 | 0.60 | 1.83 | 10.71 | Malignant | Malignant |
| 58 | 0.21 | 0.73 | 0.00 | 1.11 | 2.05 | Malignant | Malignant |
| 59 | 2.57 | 0.67 | 1.10 | 2.37 | 6.70 | Malignant | Malignant |
| 60 | 1.10 | 0.23 | 0.59 | 0.51 | 2.43 | Malignant | Malignant |
| 61 | 7.62 | 1.34 | 1.19 | 5.28 | 15.43 | Malignant | Malignant |
| 62 | 1.47 | 0.00 | 0.98 | 1.05 | 3.50 | Malignant | Malignant |
| 63 | 5.08 | 0.27 | 5.15 | 5.91 | 16.42 | Malignant | Malignant |
| 64 | 1.35 | 0.89 | 3.38 | 0.00 | 5.61 | Malignant | Malignant |
| 65 | 2.52 | 0.99 | 0.69 | 1.13 | 5.32 | Malignant | Malignant |
| 66 | 0.85 | 0.97 | 0.27 | 0.02 | 2.11 | Malignant | Malignant |
| 67 | 0.00 | 0.29 | 0.86 | 0.60 | 1.74 | Malignant | Malignant |
| 68 | 2.96 | 1.97 | 0.00 | 1.01 | 5.94 | Malignant | Malignant |
| 69 | 0.46 | 0.21 | 0.06 | 0.06 | 0.80 | Benign | Benign |
| 70 | 0.00 | 0.65 | 0.00 | 0.65 | 1.30 | Benign | Benign |
Comparison to the standard of care
The mean clinical turnaround time for conventional pathology, from sample submission to final report, was 3 days for cytology (range, 1 to 8 days) and 4 days for surgical pathology (range, 1 to 11 days). The measurement time for μNMR was typically <60 min. Conventional cytology on fine-needle aspirate specimens was performed in 49 of 50 cases and provided an accurate diagnosis in 36 of 49 cases (accuracy, 74%; Table 4). Conventional histology was done on all core biopsies and correctly diagnosed 45 cases (accuracy, 84%; Table 4). The remaining results either were nondiagnostic (five cases) or provided a false-negative result (eight cases). Thus, μNMR performed consistently better (accuracy, 96%; Table 4) than the current standard of care. Figure 8 illustrates a case in which a CT-guided biopsy of an enlarging presacral abscess was eventually deemed to contain only inflammatory tissue by cytology and core biopsy. However, μNMR analysis unequivocally classified the lesion as malignant (aggregate μNMR value was 11.25 and well above the malignancy threshold of ≥1.6). Repeat chest and abdomen CT after 2 months revealed a significant interval enlargement of the patient's biopsied lesion as well as new metastases.
Table 4.
Diagnostic accuracy of different techniques compared to the standard of care.
| Technique | n | Diagnostic | Nondiagnostic | Misdiagnosis | Sensitivity (%) | Specificity (%) | Accuracy (%) |
|---|---|---|---|---|---|---|---|
| Fine-needle aspirate | 49 | 36 | 13 | 11 | 70 | 100 | 74 |
| Core biopsy | 50 | 45 | 5 | 8 | 82 | 100 | 84 |
| μNMR | 50 | 50 | 0 | 2 | 100 | 67 | 96 |
Fig. 8.

A representative clinical case illustrating the potential use of μNMR in cancer diagnostics. Patient 3 underwent CT-guided biopsy for an enlarging (2.5 cm by 6.8 cm) presacral lesion in the setting of active metastatic rectal adenocarcinoma. Both cytology and core biopsy assessed the lesion as benign (inflammatory tissue). The lesion was thus treated with a drainage catheter. μNMR analysis, using the quadruple marker combination (MUC-1 + HER2 + EGFR + EpCAM), unequivocally classified the lesion as malignant (aggregate μNMR value was 11.25 and well above the malignancy threshold of ≥1.6). Repeat chest and abdomen CT after 2 months revealed a significant interval enlargement of the biopsied lesion as well as new metastases.
Other markers
A key determinant of cancer prognosis is the rate of tumor proliferation. Here, the cell cycle marker Ki-67 was measured to gauge the proliferative index of malignant cells. The proliferative index was found to vary considerably (range, 0 to 100%) across all patients and across subgroups of patients with the same disease and at similar stages (for example, colorectal cancer: proliferative index, 1 to 100%; pancreatic ductal adenocarcinoma: proliferative index, 3 to 75%). However, when patients were classified into treatment responders and nonresponders, Ki-67 showed statistically significant differences between the groups (P = 0.0087). The responders had a mean value of 6% proliferation (range, 0 to 13; SE, 3.3), whereas the nonresponders had a mean value of 23% (95% CL, 10 to 36; SE, 6.3). We also determined cancerassociated leukocyte counts for each fine-needle aspirate sample. Although there was considerable variability across all samples (Fig. 6), nonresponders showed higher levels of leukocytes in fine-needle aspirate samples, but this was not statistically significant (37.5 ± 25.4% versus 28 ± 20.7%). This finding is consistent with earlier reports that an inflammatory signature is indicative of a worse prognosis (27–29). Protein expression levels of the tumor suppressor p53 also showed wide variation but did not differ significantly between responders and nonresponders. Finally, we investigated vimentin as a cancer marker because this intermediate filament protein has been associated with the epithelial-mesenchymal transition (30), cancer metastases (31), and resistance to chemotherapy (32). Here, vimentin was not found to add any further diagnostic information to that provided by the other markers. Instead, we observed that vimentin levels appear to correlate with patient treatment history. Compared to their chemotherapy-naïve counterparts, the malignant lesions of actively treated or pretreated patients expressed higher vimentin levels (mean, 0.78 ± 0.20 versus 0.30 ± 0.11; P = 0.04).
Variability
Clinicians regard data from a single pathological specimen as proxies for the intrinsic biology of the tumor at the time of biopsy. However, when such information is used to make significant medical decisions, such as whether to initiate chemotherapy in the neoadjuvant setting (that is, before surgery), data fidelity and reliability become paramount. We therefore sought in this study to identify the sources contributing to potential sample variability. We initially determined the reproducibility of the μNMR measurements (n = 30 samples) and confirmed that repeated measurements of each sample produced similar results (<0.6% variability overall and <0.3% for intracellular markers;Fig.9A). This finding is remarkable for nonpurified, blood-containing samples of cellular protein biomarkers. However, when different needle aspirates (n = 13) were obtained along the identical coaxial needle pass, considerable heterogeneity was observed (Fig. 9B). Although for most extracellular markers variation from the mean only reached a maximum of 30%, variation for intracellular markers such as p53 (Fig.9B) was more pronounced. However, when additional samples were obtained from different regions of the same tumor, even extracellular markers showed mean variabilities of~90% (Fig. 9C). Finally, itisimportant to note that clinical samples are often processed in central laboratories and spend variable amounts of time in transit and in refrigerators before batch processing. To determine how such treatment might affect protein measurements, we stored sample aliquots at 4°C for various amounts of time before processing (Fig. 9F). We observed a considerable decrease in marker expression over time, with a mean loss of ~100% within the first hour after sampling. After 3 hours, marker loss appeared to plateau, when marker expression was down by ~400%. These changes likely reflect differences in protein half-lives as well as degradation by proteases and pH drift in the samples.
Fig. 9.

Analysis of sample heterogeneity. (A) Repeat measurement of the same samples (note the different scale compared to other graphs). (B) Measurement of repeat fine-needle aspirate samples obtained with the same coaxial needle (see table S3 for variance component estimates for intrasubject variability). (C) Measurement of repeat fine-needle aspirates from different tumor sites. (D and E) Effect of prospective preservation treatments on extracellular and intracellular protein measurements. Live, living cells; FA, 2% formaldehyde; Meth, 100% methanol; TX, 0.05% Triton X-100 in PBS; FB1, Fix Buffer 1; Sap, saponin. Asterisk, optimized conditions chosen for subsequent experiments. (F) Effect of time at 4°C before fixation (for example, during transport to a central laboratory facility) on protein measurements. There was a rapid change in protein expression in unfixed samples.
DISCUSSION
Although results from several studies have indicated that molecular profiling of solid tumors improves treatment stratification (33) and efficacy monitoring (34), failure to detect molecular heterogeneity in cancer patients can lead to underpowered clinical trials (35). However, the availability of serial tumor tissue to make such decisions during treatment is often limited because core biopsies carry procedural risks and are time-consuming and costly. Moreover, biopsies often yield small amounts of tissue (several cubic millimeters), which allow for only limited analyses. Conventional methods for molecular profiling (immunohistochemistry, flow cytometry, or proteomics analyses) often require considerable quantities of cells or tissues, both of which are not easily obtained with fine-needle aspirates. These caveats have fueled an intense interest in developing more sensitive technologies for enabling broader profiling of tissue in limited clinical specimens. Recent advances in nanotechnology and device miniaturization have made sophisticated molecular and cellular analyses of scant tumor samples possible, albeit often under well-controlled experimental conditions (15, 36, 37). Yet, despite the development of various platforms through the National Cancer Institute's Cancer Nanotechnology Initiative (38–40), only a few of these have advanced into clinical feasibility trials (3, 19, 20, 25, 41, 42).
The current clinical study revealed several unexpected findings. First, we observed considerable expression heterogeneity for all bio-markers across the sample populations. For example, EpCAM, the current marker of choice to define circulating tumor cells, was only highly expressed in ~60% of cancers and completely absent in ~20%. Second, we observed significant expression heterogeneity along identical and distal biopsy sites within a given tumor lesion. These findings have important implications for both molecular diagnostics and therapeutic drug targeting. Third, we obtained time courses on protein viability that demonstrated rapid decay, informing the need for prompt proteomic and other molecular measurements of human samples. Finally, we show that molecular profiling based on multimarker diagnostics in a point-of-care setting can have higher diagnostic accuracies when compared to state-of-the-art conventional pathology.
Of the individual markers investigated, MUC-1, HER2, EGFR, and EpCAM provided the highest diagnostic accuracy. Combining these four markers established correct diagnoses in 48 of the 50 patients in the initial cohort and in all 20 patients in the independent test set. This accuracy was superior to conventional clinical analysis. In the two misclassified cases, core biopsy showed significant inflammation and an absence of cancer cells. Although not attempted in this particular study, incorporating additional markers (for example, CD163, CD14, CD16, CD33, and 5B5), which define monocyte, macrophage, and fibroblast populations more accurately, would make characterizing the inflammatory and stromal components of fine-needle aspirate samples possible and could increase specificity (43–46). The current study was specifically designed to include a range of intra-abdominal tumor types so as to simulate the typical clinical referral pattern seen at an interventional service. Although peripheral to the central study aims, it is noteworthy that the three- and four-marker combinations were found to offer similar predictive accuracies, both being superior to EpCAM alone and to conventional cytopathology. This study was not powered to be specific for particular cancer subsets, but it is likely that protein markers could be tailored to recognize specific epithelial cancers (for example, those of prostate and lung) or nonepithelial cancers (for example, melanoma, sarcoma, and lymphoma).
With respect to protein stability, we discovered early on that all cancer markers displayed relatively short half-lives once the tissue was harvested. To date, limited information has been available on the half-life of protein expression levels in aspirated cancer cells, and marker degradation may be one of the reasons for the lower detection sensitivities reported in some studies. Proteomic studies of freshly harvested nonmalignant cells have demonstrated that up to 40% of protein markers are differentially expressed when in vivo and in vitro conditions are compared (18). Within the first hour after harvesting, we observed a mean decrease of ~100% in marker expression across the different markers studied (Fig. 9). The magnitude of this effect was unexpected and indicates that samples either require rapid analysis (for example, within minutes) or careful preservation using optimal methods to maintain the integrity of protein expression. For all of our clinical samples, we fixed the cells immediately after procurement using methods optimized with cell lines. This included treatment with either formaldehyde or a combination of formaldehyde and the detergent saponin, depending on whether the target was expressed on the surface or inside of the cell, respectively.
The μNMR device in its current form (DMR-3) is an advanced prototype specifically designed for clinical operation and has been significantly improved over previous prototypes such as DMR-1 (15) and DMR-2 (17). The DMR-3 system incorporates several new features including an array of solenoidal coils for multiplexed detection; a disposable, thin-walled sample container, which tightly slides into the coils; custom-designed and easy-to-use NMR hardware, which automatically tunes measurement settings (NMR frequency, pulse width, and power), to compensate for environmental factors such as temperature fluctuations; and a user-friendly interface for use with a smart phone (Fig. 1). Compared to other analytical techniques, the main advantage of μNMR is its capacity for rapid measurements with little interference from blood (that is, it allows for analyses of nonpurified samples). The platform is also versatile and scalable to easily accommodate additional bio-markers of interest, offers robust portable operation, and is relatively inexpensive compared to conventional histopathology, all key attributes for emerging nanotechnology-based diagnostics. Despite these advances and advantages, we believe that DMR-3 could be further enhanced to maximize clinical utility. We anticipate furnishing the device with more advanced multichannel measurement and microfluidic (for example, separation) capabilities to facilitate on-chip processing of whole-blood samples. Likewise, we are currently exploring additional technologies for combining sensitive μNMR measurements with higher-throughput purification chips (19). We are also investigating technologies for the analysis of individual, magnetically tagged cells using miniature magnetometer sensors. Achieving single-cell resolution will enable the diagnostic study of rare cells, such as circulating tumor cells, for screening or monitoring cancer recurrence (47, 48). Finally, sensitive and detailed analyses of other cell types, including immune cells, stem cells, or non-epithelial neoplasms, could be performed with μNMR, which could thus facilitate the development of additional surrogate endpoints for clinical trials (7, 34, 49).
Here, we show that the μNMR technology can yield highly sensitive and reproducible data, with implications for enhancing clinical decision-making. The method relies on a sophisticated technology rooted in the basic principles of NMR (15) as well as on exploiting advanced nanoparticle-targeting strategies (24). Extracting concurrent molecular information from fine-needle aspirates could minimize the incidence of nondiagnosis associated with existing standards of care and even improve diagnostic accuracies. Moreover, this minimally invasive procedure paves the way for repeated tumor samplings at various time points. Neoadjuvant treatment, for example, is a clinically accepted approach where chemotherapy precedes surgical resection. Serially interrogating tumor lesions during treatment would offer multiple windows into the biology of the tumor and its response to drug treatment. Moreover, the clinical utility of repeated biopsies for such purposes has longstanding precedence in clinical research (50–52). More recently, it has been shown that patients with various treatment refractory malignancies benefit clinically from the use of conventional laboratory methods to measure therapy-specific proteins or genetic markers in core or surgical tumor biopsies (6). Harnessing the rapid, multiplexed, and sensitive detection attributes of μNMR could enable future molecular profile–directed studies in sample-restricted trials.
We envision a number of specific clinical applications not tested here in which μNMR could be particularly useful, namely, forrapid detection and serial profiling of commonly attained specimens (fine-needle aspirates of thyroid tissue, paracentesis, thoracentesis, peripheral blood, and image-guided or surgical biopsies), for repeat treatment assessment (“pharmacodynamics”), and for robust and tumor-specific profiling of circulating microvesicles (exosomes) in blood that are shed by tumor cells. We anticipate that this versatile technology will find a wide range of applications in oncology because it enables molecular diagnostics at the bedside and has the potential for redefining the standard of care during diagnostic workup.
MATERIALS AND METHODS
Patient population and trial design
Fifty subjects were enrolled from a series of patients who had been referred for clinical biopsy of an intra-abdominal lesion. The study was approved by the Massachusetts General Hospital (MGH) Institutional Review Board, and informed consent was obtained from all participants. CT or ultrasound-guided fine-needle aspirate and core biopsies occurring within the MGH Abdominal Imaging and Intervention suites were conducted per routine. Subjects had either an established diagnosis of a solid epithelial cancer or an a priori suspicion of cancer, based on imaging results and the presence of tumor markers. One to two fine-needle aspirate passes were obtained and processed for μNMR analyses as described below. Two clinicians (C.M.C. and R.W.), blinded to the μNMR results, reviewed each subject's documented clinical, imaging, and pathology data. In rare instances where pathology was equivocal, data from repeat biopsies and follow-up radiographic imaging were used to reach a consensus on clinical outcome.
In a subset of patients with lesion diameters of at least 2 cm, additional fine-needle aspirate passes were performed to quantitate measurement reproducibility, to measure repeat regional and temporal heterogeneity, or to compare μmNMR measurements to FACS. To determine reproducibility, we performed μmNMR measurements successively for each processed sample without further manipulation. Procedures for measuring repeat sampling heterogeneity involved performing repeated aspirations along the same coaxial needle pass (that is, single lesion site) or by repositioning the needle in a different region of the same lesion (that is, multiple lesion sites). Temporal heterogeneity of samples was determined by obtaining and pooling multiple single lesion site fine-needle aspirates, which were then aliquoted and preserved at 4°C until processing at different time points.
To determine whether initial findings were generalizable, we enrolled an independent test set containing an additional 20 subjects. Samples from these patients were processed identically, but only the four-marker panel (MUC-1 + HER2 + EGFR + EpCAM) was assayed.
Sample processing
For each patient, fine-needle aspirate specimens were expelled into EDTA-coated Vacutainer tubes (BD Biosciences) with 2 ml of saline for transport. After centrifugation (400g for 5 min), resuspension in 0.05% trypsin-0.53 mM EDTA and incubation for 15 min at 37°C, samples were divided into two separate groups for detection of extra-cellular or intracellular markers. We initially tested a variety of fixation and permeabilization protocols to optimize marker detection and to limit magnetic nanoparticle (MNP) background (Fig. 9, D and E). Based on results from these tests, the extracellular group was lightly fixed with 2% formaldehyde, and the intracellular group was fixed with Fix Buffer 1 (FB1, BD Biosciences) and semipermeabilized with saponin (Perm/Wash buffer, BD Biosciences) as per the manufacturer's instructions.
Preparation of TCO-modified antibodies
Monoclonal antibodies against proteins of interest (see table S2) were reacted with (E)-cyclooct-4-enyl 2,5-dioxopyrrolidin-1-yl carbonate (TCO-NHS), which was synthesized as previously reported (53). The reaction was performed with 0.25 to 0.5 mg of antibody and 1000 equivalents of TCO-NHS in phosphate-buffered saline (PBS) containing 10% dimethylformamide (DMF) for 3 hours at room temperature. Unreacted TCO-NHS was then removed with 2-ml Zeba de-salting columns (Thermo Fisher), and antibody concentration was determined by absorbance measurement. TCO valencies were determined based on changes in molecular weight with MALDI-TOF (matrix-assisted laser desorption/ionization-time-of-flight) mass spectrometry (24). Briefly, the antibody was diluted to 150 μg/ml with water and combined at a ratio of 2:1 with sinapinic acid (1 mg dissolved in 0.1 ml of 70:30 acetonitrile/water with 0.1% trifluoroacetic acid; Thermo Fisher). One microliter was then dried onto a sample plate. Data were collected with a Voyager-DE BioSpectrometry Workstation MALDI-TOF mass spectrometer (Applied Biosystems) and analyzed with a custom MATLAB (MathWorks) program. The number of TCO modifications per antibody was then calculated based on the difference in molecular weight compared to the unmodified antibody, and by assuming that a 152.2-dalton net mass was added per TCO (table S2) (24). Variations in TCO loading were likely the result of differences in the availability of amine sites between different species and immunoglobulin G (IgG) subclasses.
Preparation of Tz-modified MNPs
Cross-linked iron oxide (CLIO) nanoparticles were prepared as described previously (16). Briefly, 3-nm monocrystalline cores composed of (Fe2O3)n(Fe3O4)m were synthesized within a matrix of 10-kD dextran. These were cross-linked with epichlorohydrin and reacted with ammonia to produce MNPs with primary amine groups (NH2-MNPs). The number of amines per MNP was ~89, as determined by reaction with N-succinimidyl 3-(2-pyridyldithio) propionate (Thermo Fisher) and dithiothreitol. The hydrodynamic diameter was 28.8 nm, as measured by dynamic light scattering (Zetasizer 1000HS; Malvern Instruments). At 40°C and 0.47 T (Minispec MQ20; Bruker), the R1 and R2 relaxivities were 25.2 and 64.5 mM−1 s−1, respectively. Tz-MNPs were created by reacting NH2-MNPs with 500 equivalents of 2,5-dioxopyrrolidin-1-yl 5-(4-(1,2,4,5-tetrazin-3-yl)benzylamino)-5-oxopentanoate (Tz-NHS), synthesized as previously reported (24). This reaction proceeded in PBS containing 5% DMF for 3 hours at room temperature. Excess Tz-NHS was removed by gel filtration with Sephadex G-50 (GE Healthcare). Tz-MNP concentration was determined by absorbance measurement at 410 nm with a known standard for calibration. MNP molar concentration was then determined based on an estimated molecular mass of 447,000 daltons [8000 Fe atoms per core crystal, 55.85 daltons per Fe atom (54)]. Tz-MNPs were stable at pH 6.5 for several months as determined by analytical methods.
MNP targeting and detection by NMR
Each specimen was divided into aliquots in microcentrifuge tubes and incubated with TCO-modified monoclonal antibodies (10 μg/ml) in 0.15 ml of the appropriate buffer [extracellular samples: PBS containing 1% bovine serum albumin (BSA) or PBS+; intracellular samples: saponin-based Perm/Wash containing 1% BSA or PW+] for 10 min at room temperature. Samples were then pelleted by centrifugation, aspirated, and resuspended directly with Tz-MNP (100 nM). After incubation for 30 min at room temperature on a rotator, samples were washed twice by centrifugation with PBS+ or PW+, washed once with PBS, and then resuspended in 20 μl of PBS.
The μmNMR device and its operation
Here, we designed a new μmNMR system (DMR-3) specifically intended for clinical applications. The μmNMR system conceptually consists of solenoidal microcoils, a portable magnet, and custom-built NMR hardware (Fig. 1). To maximize the sample filling factor (≈1) and hence the NMR signal level, we embedded the solenoidal coils in polydimethylsiloxane along with the fluidic channels. Samples either were directly injected into the fluidic channels or were contained in thin-walled (thickness, 25 μm) tubes, which were then inserted into the coil bores. The coils were mounted on a printed circuit board containing impedance matching networks and multiplexers. A polarizing magnetic field (0.5 T) was generated by a portable, permanent magnet (PM1055-050N, Metrolab). The NMR hardware houses a digital signal processor (DSP) unit (C2000 series, Texas Instruments), a radio frequency (RF) generator (AD9954, Analog Devices), and an analog-to-digital converter (AD7690, Analog Devices). The DSP unit controls the entire operation of the system and communicates with an external smart phone for user inputs. For robust NMR measurements, the DSP unit was programmed to maintain a constant offset between two frequencies: the NMR frequency (determined by the external magnetic field) and the RF carrier (for excitation). The transverse relaxation rate (R2) was measured within the 1-μl sample volume of the microcoil with Carr-Purcell-Meiboom-Gill pulse sequences with the following parameters: echo time, 4 ms; repetition time, 6 s; number of 180° pulses per scan, 500; number of scans, 8. R2 values were subtracted from the R2 value for PBS alone to obtain ΔR2. Marker levels were calculated as described in the Supplementary Materials and Methods.
Statistics
The Spearman correlation coefficient was used to assess the correlations between different variables, and the nonparametric Mann-Whitney test was used to determine the magnitudes of between-group differences. Random-effects models were used to separate within-subject variability (reproducibility of the NMR measurements) from between-subject variability. We constructed ROC curves for individual markers and selected marker combinations by plotting sensitivity versus 1 – specificity and calculated the areas under the ROC curves (Az). An Az of 0.5 was used to indicate that the test shows no difference between the two groups, whereas an Az of 1.0 was used to indicate that the test gives a perfect separation between the groups. When assessing discrimination accuracy of marker combinations, we first used logistic regression to estimate a risk score function and then constructed the ROC curves based on this risk score function. We defined the optimal cutoff value for identifying malignant status as the point on the ROC curve with the minimal distance between the 0% false-negative and the 100% true-positive rate. Using standard formulas, we calculated sensitivity, specificity, and accuracy. We also used a leave-one-out cross-validation method to calculate prediction accuracy for a future patient. Specifically, we omitted one sample before selecting the optimal cutoff point using the remaining samples. We repeated this until every sample had been left out once and then calculated the prediction accuracy based on the accuracy rates for the left-out samples. We used the bootstrap method to estimate the SEs for the prediction accuracy rates estimated from the leave-oneout cross-validation. All tests were two-sided and a P value of <0.05 was considered statistically significant. All μmNMR and MALDI-TOF measurements were performed in triplicate, and the data are presented as means ± SE.
Supplementary Material
Acknowledgments
We thank A. Guimaraes for assistance with the initial IRB protocol, A. Thabet and B. Pomerantz for sample collection, D. Issadore for helping perform μNMR measurements, C. Min for developing the smart phone interface, N. Devaraj and S. Hilderbrand for synthesizing chemical reagents, and Y. Fisher-Jeffes for manuscript review. We also thank M. Pittet and F. Swirski for their many helpful discussions and for data review. Finally, we are grateful to M. Toner and D. Haber for their invaluable insight and suggestions. Funding: Supported in part by NIH grants (RO1 EB004626, RO1 EB010011, U54 CA119349, UO1 HL080731, P50 CA127003, T32 CA079443, and F32 CA144139).
Footnotes
Competing interests: The authors declare that they have no competing interests.
SUPPLEMENTARY MATERIAL www.sciencetranslationalmedicine.org/cgi/content/full/3/71/71ra16/DC1
REFERENCES AND NOTES
- 1.Ramaswamy S, Ross KN, Lander ES, Golub TR. A molecular signature of metastasis in primary solid tumors. Nat. Genet. 2003;33:49–54. doi: 10.1038/ng1060. [DOI] [PubMed] [Google Scholar]
- 2.Taylor BS, Varambally S, Chinnaiyan AM. A systems approach to model metastatic progression. Cancer Res. 2006;66:5537–5539. doi: 10.1158/0008-5472.CAN-06-0415. [DOI] [PubMed] [Google Scholar]
- 3.Maheswaran S, Sequist LV, Nagrath S, Ulkus L, Brannigan B, Collura CV, Inserra E, Diederichs S, Iafrate AJ, Bell DW, Digumarthy S, Muzikansky A, Irimia D, Settleman J, Tompkins RG, Lynch TJ, Toner M, Haber DA. Detection of mutations in EGFR in circulating lung-cancer cells. N. Engl.J.Med. 2008;359:366–377. doi: 10.1056/NEJMoa0800668. [DOI] [PMC free article] [PubMed] [Google Scholar]
- 4.Hanahan D, Weinberg RA. The hallmarks of cancer. Cell. 2000;100:57–70. doi: 10.1016/s0092-8674(00)81683-9. [DOI] [PubMed] [Google Scholar]
- 5.Spencer SL, Gaudet S, Albeck JG, Burke JM, Sorger PK. Non-genetic origins of cell-to-cell variability in TRAIL-induced apoptosis. Nature. 2009;459:428–432. doi: 10.1038/nature08012. [DOI] [PMC free article] [PubMed] [Google Scholar]
- 6.Von Hoff DD, Stephenson JJ, Jr., Rosen P, Loesch DM, Borad MJ, Anthony S, Jameson G, Brown S, Cantafio N, Richards DA, Fitch TR, Wasserman E, Fernandez C, Green S, Sutherland W, Bittner M, Alarcon A, Mallery D, Penny R. Pilot study using molecular profiling of patients' tumors to find potential targets and select treatments for their refractory cancers. J. Clin. Oncol. 2010;28:4877–4883. doi: 10.1200/JCO.2009.26.5983. [DOI] [PubMed] [Google Scholar]
- 7.Brennan DJ, O'Connor DP, Rexhepaj E, Ponten F, Gallagher WM. Antibody-based proteomics: Fast-tracking molecular diagnostics in oncology. Nat. Rev. Cancer. 2010;10:605–617. doi: 10.1038/nrc2902. [DOI] [PubMed] [Google Scholar]
- 8.Bruening W, Fontanarosa J, Tipton K, Treadwell JR, Launders J, Schoelles K. Systematic review: Comparative effectiveness of core-needle and open surgical biopsy to diagnose breast lesions. Ann. Intern. Med. 2010;152:238–246. doi: 10.7326/0003-4819-152-1-201001050-00190. [DOI] [PubMed] [Google Scholar]
- 9.Bast RC, Jr., Lilja H, Urban N, Rimm DL, Fritsche H, Gray J, Veltri R, Klee G, Allen A, Kim N, Gutman S, Rubin MA, Hruszkewycz A. Translational crossroads for biomarkers. Clin. Cancer Res. 2005;11:6103–6108. doi: 10.1158/1078-0432.CCR-04-2213. [DOI] [PubMed] [Google Scholar]
- 10.Bolton KL, Garcia-Closas M, Pfeiffer RM, Duggan MA, Howat WJ, Hewitt SM, Yang XR, Cornelison R, Anzick SL, Meltzer P, Davis S, Lenz P, Figueroa JD, Pharoah PD, Sherman ME. Assessment of automated image analysis of breast cancer tissue microarrays for epidemiologic studies. Cancer Epidemiol. Biomarkers Prev. 2010;19:992–999. doi: 10.1158/1055-9965.EPI-09-1023. [DOI] [PMC free article] [PubMed] [Google Scholar]
- 11.Sheiman RG, Fey C, McNicholas M, Raptopoulos V. Possible causes of inconclusive results on CT-guided thoracic and abdominal core biopsies. AJR Am. J. Roentgenol. 1998;170:1603–1607. doi: 10.2214/ajr.170.6.9609181. [DOI] [PubMed] [Google Scholar]
- 12.Mueller PR, vanSonnenberg E. Interventional radiology in the chest and abdomen. N. Engl. J. Med. 1990;322:1364–1374. doi: 10.1056/NEJM199005103221906. [DOI] [PubMed] [Google Scholar]
- 13.Weissleder R, Moore A, Mahmood U, Bhorade R, Benveniste H, Chiocca EA, Basilion JP. In vivo magnetic resonance imaging of transgene expression. Nat. Med. 2000;6:351–355. doi: 10.1038/73219. [DOI] [PubMed] [Google Scholar]
- 14.Weissleder R, Pittet MJ. Imaging in the era of molecular oncology. Nature. 2008;452:580–589. doi: 10.1038/nature06917. [DOI] [PMC free article] [PubMed] [Google Scholar]
- 15.Lee H, Sun E, Ham D, Weissleder R. Chip-NMR biosensor for detection and molecular analysis of cells. Nat. Med. 2008;14:869–874. doi: 10.1038/nm.1711. [DOI] [PMC free article] [PubMed] [Google Scholar]
- 16.Perez JM, Josephson L, O'Loughlin T, Högemann D, Weissleder R. Magnetic relaxation switches capable of sensing molecular interactions. Nat. Biotechnol. 2002;20:816–820. doi: 10.1038/nbt720. [DOI] [PubMed] [Google Scholar]
- 17.Lee H, Yoon TJ, Figueiredo JL, Swirski FK, Weissleder R. Rapid detection and profiling of cancer cells in fine-needle aspirates. Proc. Natl. Acad. Sci. U.S.A. 2009;106:12459–12464. doi: 10.1073/pnas.0902365106. [DOI] [PMC free article] [PubMed] [Google Scholar]
- 18.Durr E, Yu J, Krasinska KM, Carver LA, Yates JR, Testa JE, Oh P, Schnitzer JE. Direct proteomic mapping of the lung microvascular endothelial cell surface in vivo and in cell culture. Nat. Biotechnol. 2004;22:985–992. doi: 10.1038/nbt993. [DOI] [PubMed] [Google Scholar]
- 19.Nagrath S, Sequist LV, Maheswaran S, Bell DW, Irimia D, Ulkus L, Smith MR, Kwak EL, Digumarthy S, Muzikansky A, Ryan P, Balis UJ, Tompkins RG, Haber DA, Toner M. Isolation of rare circulating tumour cells in cancer patients by microchip technology. Nature. 2007;450:1235–1239. doi: 10.1038/nature06385. [DOI] [PMC free article] [PubMed] [Google Scholar]
- 20.Sequist LV, Nagrath S, Toner M, Haber DA, Lynch TJ. The CTC-chip: An exciting new tool to detect circulating tumor cells in lung cancer patients. J. Thorac. Oncol. 2009;4:281–283. doi: 10.1097/JTO.0b013e3181989565. [DOI] [PMC free article] [PubMed] [Google Scholar]
- 21.Ho SB, Niehans GA, Lyftogt C, Yan PS, Cherwitz DL, Gum ET, Dahiya R, Kim YS. Heterogeneity of mucin gene expression in normal and neoplastic tissues. Cancer Res. 1993;53:641–651. [PubMed] [Google Scholar]
- 22.Vogel CL, Cobleigh MA, Tripathy D, Gutheil JC, Harris LN, Fehrenbacher L, Slamon DJ, Murphy M, Novotny WF, Burchmore M, Shak S, Stewart SJ, Press M. Efficacy and safety of trastuzumab as a single agent in first-line treatment of HER2-overexpressing metastatic breast cancer. J. Clin. Oncol. 2002;20:719–726. doi: 10.1200/JCO.2002.20.3.719. [DOI] [PubMed] [Google Scholar]
- 23.Roth TJ, Sheinin Y, Lohse CM, Kuntz SM, Frigola X, Inman BA, Krambeck AE, McKenney ME, Karnes RJ, Blute ML, Cheville JC, Sebo TJ, Kwon ED. B7-H3 ligand expression by prostate cancer: A novel marker of prognosis and potential target for therapy. Cancer Res. 2007;67:7893–7900. doi: 10.1158/0008-5472.CAN-07-1068. [DOI] [PubMed] [Google Scholar]
- 24.Haun JB, Devaraj NK, Hilderbrand SA, Lee H, Weissleder R. Bioorthogonal chemistry amplifies nanoparticle binding and enhances the sensitivity of cell detection. Nat. Nanotechnol. 2010;5:660–665. doi: 10.1038/nnano.2010.148. [DOI] [PMC free article] [PubMed] [Google Scholar]
- 25.Stott SL, Lee RJ, Nagrath S, Yu M, Miyamoto DT, Ulkus L, Inserra EJ, Ulman M, Springer S, Nakamura Z, Moore AL, Tsukrov DI, Kempner ME, Dahl DM, Wu CL, Iafrate AJ, Smith MR, Tompkins RG, Sequist LV, Toner M, Haber DA, Maheswaran S. Isolation and characterization of circulating tumor cells from patients with localized and metastatic prostate cancer. Sci. Transl. Med. 2010;2:25–23. doi: 10.1126/scitranslmed.3000403. [DOI] [PMC free article] [PubMed] [Google Scholar]
- 26.Mischak H, Allmaier G, Apweiler R, Attwood T, Baumann M, Benigni A, Bennett SE, Bischoff R, Bongcam-Rudloff E, Capasso G, Coon JJ, D'Haese P, Dominiczak AF, Dakna M, Dihazi H, Ehrich JH, Fernandez-Llama P, Fliser D, Frokiaer J, Garin J, Girolami M, Hancock WS, Haubitz M, Hochstrasser D, Holman RR, Ioannidis JP, Jankowski J, Julian BA, Klein JB, Kolch W, Luider T, Massy Z, Mattes WB, Molina F, Monsarrat B, Novak J, Peter K, Rossing P, Sánchez-Carbayo M, Schanstra JP, Semmes OJ, Spasovski G, Theodorescu D, Thongboonkerd V, Vanholder R, Veenstra TD, Weissinger E, Yamamoto T, Vlahou A. Recommendations for biomarker identification and qualification in clinical proteomics. Sci. Transl. Med. 2010;2:46–42. doi: 10.1126/scitranslmed.3001249. [DOI] [PubMed] [Google Scholar]
- 27.Saadi A, Shannon NB, Lao-Sirieix P, O'Donovan M, Walker E, Clemons NJ, Hardwick JS, Zhang C, Das M, Save V, Novelli M, Balkwill F, Fitzgerald RC. Stromal genes discriminate preinvasive from invasive disease, predict outcome, and highlight inflammatory pathways in digestive cancers. Proc. Natl. Acad. Sci. U.S.A. 2010;107:2177–2182. doi: 10.1073/pnas.0909797107. [DOI] [PMC free article] [PubMed] [Google Scholar]
- 28.Cristofanilli M, Valero V, Buzdar AU, Kau SW, Broglio KR, Gonzalez-Angulo AM, Sneige N, Islam R, Ueno NT, Buchholz TA, Singletary SE, Hortobagyi GN. Inflammatory breast cancer (IBC) and patterns of recurrence: Understanding the biology of a unique disease. Cancer. 2007;110:1436–1444. doi: 10.1002/cncr.22927. [DOI] [PubMed] [Google Scholar]
- 29.Erez N, Truitt M, Olson P, Arron ST, Hanahan D. Cancer-associated fibroblasts are activated in incipient neoplasia to orchestrate tumor-promoting inflammation in an NF-κB-dependent manner. Cancer Cell. 2010;17:135–147. doi: 10.1016/j.ccr.2009.12.041. [DOI] [PubMed] [Google Scholar]
- 30.Kalluri R, Weinberg RA. The basics of epithelial-mesenchymal transition. J. Clin. Invest. 2009;119:1420–1428. doi: 10.1172/JCI39104. [DOI] [PMC free article] [PubMed] [Google Scholar]
- 31.Lahat G, Zhu QS, Huang KL, Wang S, Bolshakov S, Liu J, Torres K, Langley RR, Lazar AJ, Hung MC, Lev D. Vimentin is a novel anti-cancer therapeutic target; insights from in vitro and in vivo mice xenograft studies. PLoS One. 2010;5:e10105. doi: 10.1371/journal.pone.0010105. [DOI] [PMC free article] [PubMed] [Google Scholar] [Retracted]
- 32.Creighton CJ, Li X, Landis M, Dixon JM, Neumeister VM, Sjolund A, Rimm DL, Wong H, Rodriguez A, Herschkowitz JI, Fan C, Zhang X, He X, Pavlick A, Gutierrez MC, Renshaw L, Larionov AA, Faratian D, Hilsenbeck SG, Perou CM, Lewis MT, Rosen JM, Chang JC. Residual breast cancers after conventional therapy display mesenchymal as well as tumor-initiating features. Proc. Natl. Acad. Sci. U.S.A. 2009;106:13820–13825. doi: 10.1073/pnas.0905718106. [DOI] [PMC free article] [PubMed] [Google Scholar]
- 33.Tsao MS, Sakurada A, Cutz JC, Zhu CQ, Kamel-Reid S, Squire J, Lorimer I, Zhang T, Liu N, Daneshmand M, Marrano P, da Cunha Santos G, Lagarde A, Richardson F, Seymour L, Whitehead M, Ding K, Pater J, Shepherd FA. Erlotinib in lung cancer—molecular and clinical predictors of outcome. N. Engl. J. Med. 2005;353:133–144. doi: 10.1056/NEJMoa050736. [DOI] [PubMed] [Google Scholar]
- 34.Tan DS, Thomas GV, Garrett MD, Banerji U, de Bono JS, Kaye SB, Workman P. Biomarker-driven early clinical trials in oncology: A paradigm shift in drug development. Cancer J. 2009;15:406–420. doi: 10.1097/PPO.0b013e3181bd0445. [DOI] [PubMed] [Google Scholar]
- 35.Betensky RA, Louis DN, Cairncross JG. Influence of unrecognized molecular heterogeneity on randomized clinical trials. J. Clin. Oncol. 2002;20:2495–2499. doi: 10.1200/JCO.2002.06.140. [DOI] [PubMed] [Google Scholar]
- 36.Liu Y, Wang H. Nanomedicine: Nanotechnology tackles tumours. Nat. Nanotechnol. 2007;2:20–21. doi: 10.1038/nnano.2006.188. [DOI] [PubMed] [Google Scholar]
- 37.Giljohann DA, Mirkin CA. Drivers of biodiagnostic development. Nature. 2009;462:461–464. doi: 10.1038/nature08605. [DOI] [PMC free article] [PubMed] [Google Scholar]
- 38.Alper J. US NCI launches nanotechnology plan. Nat. Biotechnol. 2004;22:1335–1336. doi: 10.1038/nbt1104-1335. [DOI] [PubMed] [Google Scholar]
- 39.Ferrari M. Cancer nanotechnology: Opportunities and challenges. Nat. Rev. Cancer. 2005;5:161–171. doi: 10.1038/nrc1566. [DOI] [PubMed] [Google Scholar]
- 40.Farokhzad OC, Langer R. Impact of nanotechnology on drug delivery. ACS Nano. 2009;3:16–20. doi: 10.1021/nn900002m. [DOI] [PubMed] [Google Scholar]
- 41.Thaxton CS, Elghanian R, Thomas AD, Stoeva SI, Lee JS, Smith ND, Schaeffer AJ, Klocker H, Horninger W, Bartsch G, Mirkin CA. Nanoparticle-based bio-barcode assay redefines “undetectable” PSA and biochemical recurrence after radical prostatectomy. Proc. Natl. Acad. Sci. U.S.A. 2009;106:18437–18442. doi: 10.1073/pnas.0904719106. [DOI] [PMC free article] [PubMed] [Google Scholar]
- 42.Sun J, Masterman-Smith MD, Graham NA, Jiao J, Mottahedeh J, Laks DR, Ohashi M, DeJesus J, Kamei K, Lee KB, Wang H, Yu ZT, Lu YT, Hou S, Li K, Liu M, Zhang N, Wang S, Angenieux B, Panosyan E, Samuels ER, Park J, Williams D, Konkankit V, Nathanson D, van Dam RM, Phelps ME, Wu H, Liau LM, Mischel PS, Lazareff JA, Kornblum HI, Yong WH, Graeber TG, Tseng HR. A microfluidic platform for systems pathology: Multiparameter single-cell signaling measurements of clinical brain tumor specimens. Cancer Res. 2010;70:6128–6138. doi: 10.1158/0008-5472.CAN-10-0076. [DOI] [PMC free article] [PubMed] [Google Scholar]
- 43.Komohara Y, Hirahara J, Horikawa T, Kawamura K, Kiyota E, Sakashita N, Araki N, Takeya M. AM-3K, an anti-macrophage antibody, recognizes CD163, a molecule associated with an anti-inflammatory macrophage phenotype. J. Histochem. Cytochem. 2006;54:763–771. doi: 10.1369/jhc.5A6871.2006. [DOI] [PubMed] [Google Scholar]
- 44.Leimgruber A, Berger C, Cortez-Retamozo V, Etzrodt M, Newton AP, Waterman P, Figueiredo JL, Kohler RH, Elpek N, Mempel TR, Swirski FK, Nahrendorf M, Weissleder R, Pittet MJ. Behavior of endogenous tumor-associated macrophages assessed in vivo using a functionalized nanoparticle. Neoplasia. 2009;11:459–468. doi: 10.1593/neo.09356. [DOI] [PMC free article] [PubMed] [Google Scholar]
- 45.Swirski FK, Nahrendorf M, Etzrodt M, Wildgruber M, Cortez-Retamozo V, Panizzi P, Figueiredo JL, Kohler RH, Chudnovskiy A, Waterman P, Aikawa E, Mempel TR, Libby P, Weissleder R, Pittet MJ. Identification of splenic reservoir monocytes and their deployment to inflammatory sites. Science. 2009;325:612–616. doi: 10.1126/science.1175202. [DOI] [PMC free article] [PubMed] [Google Scholar]
- 46.Wildgruber M, Lee H, Chudnovskiy A, Yoon TJ, Etzrodt M, Pittet MJ, Nahrendorf M, Croce K, Libby P, Weissleder R, Swirski FK. Monocyte subset dynamics in human atherosclerosis can be profiled with magnetic nano-sensors. PLoS One. 2009;4:e5663. doi: 10.1371/journal.pone.0005663. [DOI] [PMC free article] [PubMed] [Google Scholar]
- 47.Pierga JY, Bidard FC, Mathiot C, Brain E, Delaloge S, Giachetti S, de Cremoux P, Salmon R, Vincent-Salomon A, Marty M. Circulating tumor cell detection predicts early metastatic relapse after neoadjuvant chemotherapy in large operable and locally advanced breast cancer in a phase II randomized trial. Clin. Cancer Res. 2008;14:7004–7010. doi: 10.1158/1078-0432.CCR-08-0030. [DOI] [PubMed] [Google Scholar]
- 48.Kaiser J. Medicine. Cancer's circulation problem. Science. 2010;327:1072–1074. doi: 10.1126/science.327.5969.1072. [DOI] [PubMed] [Google Scholar]
- 49.Hanash S, Taguchi A. The grand challenge to decipher the cancer proteome. Nat. Rev. Cancer. 2010;10:652–660. doi: 10.1038/nrc2918. [DOI] [PubMed] [Google Scholar]
- 50.D'Alfonso T, Liu YF, Monni S, Rosen PP, Shin SJ. Accurately assessing HER-2/neu status in needle core biopsies of breast cancer patients in the era of neoadjuvant therapy: Emerging questions and considerations addressed. Am. J. Surg. Pathol. 2010;34:575–581. doi: 10.1097/PAS.0b013e3181d65639. [DOI] [PubMed] [Google Scholar]
- 51.Khan A, Sabel MS, Nees A, Diehl KM, Cimmino VM, Kleer CG, Schott AF, Hayes DF, Chang AE, Newman LA. Comprehensive axillary evaluation in neoadjuvant chemotherapy patients with ultrasonography and sentinel lymph node biopsy. Ann. Surg. Oncol. 2005;12:697–704. doi: 10.1245/ASO.2005.09.007. [DOI] [PubMed] [Google Scholar]
- 52.Makris A, Powles TJ, Allred DC, Ashley SE, Trott PA, Ormerod MG, Titley JC, Dowsett M. Quantitative changes in cytological molecular markers during primary medical treatment of breast cancer: A pilot study. Breast Cancer Res. Treat. 1999;53:51–59. doi: 10.1023/a:1006179511178. [DOI] [PubMed] [Google Scholar]
- 53.Devaraj NK, Upadhyay R, Haun JB, Hilderbrand SA, Weissleder R. Fast and sensitive pretargeted labeling of cancer cells through a tetrazine/trans-cyclooctene cycloaddition. Angew. Chem. Int. Ed. Engl. 2009;48:7013–7016. doi: 10.1002/anie.200903233. [DOI] [PMC free article] [PubMed] [Google Scholar]
- 54.Reynolds F, O'loughlin T, Weissleder R, Josephson L. Method of determining nanoparticle core weight. Anal. Chem. 2005;77:814–817. doi: 10.1021/ac049307x. [DOI] [PubMed] [Google Scholar]
Associated Data
This section collects any data citations, data availability statements, or supplementary materials included in this article.