
FIGURE 4.
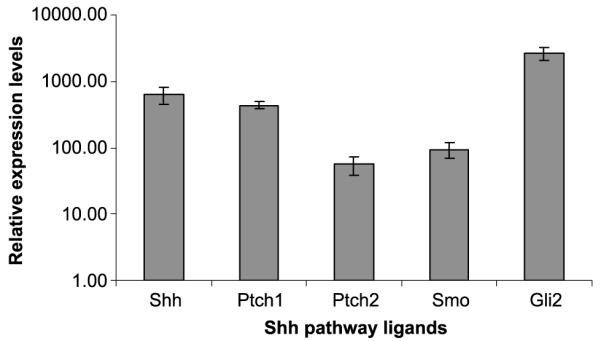
Sonic hedgehog pathway misexpression. Real-time quantitative PCR results for relative expression of Shh pathway members compared with normal pancreas. The graph shows fold overexpression of sonic hedgehog (Shh), Patched1 (Pch1), Patched2 (Ptch2), Gli2, and Smoothened (Smo).