

Abstract
The lymphoid tyrosine phosphatase LYP, encoded by the PTPN22 gene, is a critical regulator of signaling in T cells and recently emerged as a candidate target for therapy of autoimmune diseases. Here, by library screening, we identified a series of noncompetitive inhibitors of LYP that showed activity in primary T cells. Kinetic analysis confirmed that binding of the compounds to the phosphatase is nonmutually exclusive with respect to a known bidentate competitive inhibitor. The mechanism of action of the lead inhibitor compound 4e was studied by a combination of hydrogen/deuterium-exchange mass spectrometry and molecular modeling. The results suggest that the inhibitor interacts critically with a hydrophobic patch located outside the active site of the phosphatase. Targeting of secondary allosteric sites is viewed as a promising yet unexplored approach to develop pharmacological inhibitors of protein tyrosine phosphatases. Our novel scaffold could be a starting point to attempt development of “nonactive site” anti-LYP pharmacological agents.
INTRODUCTION
Protein tyrosine phosphatases (PTPs) are candidate drug targets for common human diseases, including cancer, inflammation, and metabolic diseases.1,2 However, therapeutically targeting this family of enzymes has some particular pitfalls.3 Traditional searches for competitive inhibitors of PTPs have been plagued by problems of low selectivity and lack of cell-permeability of the compounds. This is in part due to the features of the active site of PTPs, which is small, well conserved among different members of the family, and highly charged.3 An increasingly popular approach to ensure selectivity of PTP inhibitors is to design bidentate/multidentate compounds that interact with the active site and with additional PTP-specific structural determinants of the catalytic domain.4–8 Some recently developed bidentate/multidentate compounds also showed activity in cell-based assays.9–11 While targeting secondary allosteric sites has been proposed as more likely to yield cell-permeable inhibitors, only a few allosteric inhibitors of PTPs have been published. The first allosteric inhibitor of PTP-1B was published in 2004 by Sunesis, Inc.12 This compound does not bind to the active site of the enzyme, shows good selectivity properties (>5 times selectivity for PTP-1B vs TC-PTP), and is active in cell-based assays.12 Recently, Lantz et al. reported that trodusquemin is also an allosteric inhibitor of PTP-1B; however, its mechanism of action and binding site remain to be clarified.13
Here we sought to identify novel cell-permeable inhibitors of the lymphoid tyrosine phosphatase (LYP), a putative drug target for human autoimmunity.14–16 LYP (encoded by the PTPN22 gene) is a class I PTP and belongs to the subfamily of PEST-enriched PTPs, which includes two additional enzymes, PTP-PEST (encoded by the PTPN12 gene) and BDP1 (encoded by the PTPN18 gene),17–19 and is expressed exclusively in hematopoietic cells. In T cells LYP is an important negative regulator of signal transduction through the T cell receptor (TCR).20,21 Major substrates of LYP in T cells are pY residues in the activation motif of tyrosine kinases involved in mediating early TCR signaling, such as leukocyte-specific protein tyrosine kinase (Lck), FYN oncogene related to SRC, FGR, YES (Fyn), and ζ chain-associated protein tyrosine kinase 70 (ZAP70).20–22 A genetic variant of LYP (LYP-W620) recently emerged as a major risk factor for type 1 diabetes (T1D), rheumatoid arthritis (RA), Graves’ disease, and other autoimmune diseases.23–26 The mechanism of action of LYP-W620 in autoimmunity is unclear; however, functional studies have shown that this variant of LYP is a gain-of-function form of the enzyme, and carriers of LYP-W620 show reduced TCR signaling.27,28 Thus, it has been proposed that specific small molecule inhibitors of LYP would be able to prevent or treat autoimmunity at least in LYP-W620-carrying subjects.10,27 Treating autoimmunity by enhancing TCR signaling might sound a little counterintuitive. However, there is increasing awareness that decreased TCR signaling could play a role at least in a subset of autoimmune diseases/subjects.29 For example, in the nonobese diabetic (NOD) mouse model of T1D, peripheral T cells are hyporesponsive to TCR engagement.30 TCR hyporesponsiveness due to a mutation in ZAP70 (one of the substrates of LYP) causes RA in mice.31,32 A hyporesponsiveness of peripheral T cells to engagement of the TCR has been reported in human T1D.33 It is currently not clear how reduced TCR signaling would contribute to the pathogenesis of human autoimmunity. Thymocyte hyporesponsiveness to TCR stimulation can affect positive and negative selection of autoreactive cells. Reduced TCR signaling might also negatively affect the function/expansion of a subpopulation of antiautoimmune T cells called regulatory T cells (Treg).34 T1D-predisposing genetic variants of the mouse Il2 gene are associated with decreased interleukin-2 (IL-2) production and cause decreased levels/function of Treg.35 Indeed, while high-dose IL-2 treatment exacerbates T1D in mice, administration of low-dose IL-2 has been found to effectively treat T1D in mice by restoring normal levels of Treg.36,37 The known therapeutic action of anti-CD3 (an agonist of the TCR) in T1D in mice also seems to be partially mediated by expansion of a Treg subpopulation. 38 Overall it seems possible that moderate enhancement of TCR signaling could be beneficial in at least a subset of patients with T1D and perhaps other autoimmune diseases. In support of the idea that the inhibition of LYP would be beneficial in autoimmunity, we recently identified a rare loss-of-function mutant of LYP (LYP-Q263) and showed that it confers protection against systemic lupus erythematosus and rheumatoid arthritis.39,40 Active site inhibitors of LYP have been identified by chemical library screening41,42 and virtual docking.43 A potent and selective bidentate inhibitor, compound 13 (I-C11, shown in Figure 2C), has been developed by Yu et al.10
Figure 2.

Compound 4 and analogues are nonactive site LYP inhibitors. (A) Plots of the IC50 of compound 4 (black circles), compound 4e (black diamonds), compound 4g (black triangles), and compound 13 (black squares) on 25 nM LYP-catalyzed hydrolysis of the pY peptide versus substrate concentration/KM. Plots show the IC50±95% confidence intervals. Lines are fitting of the data to a linear regression. (B) Activity of 25 nM LYP on the pY peptide in the presence of increasing concentrations of compound 4 (DMSO, white squares; 5 μM, light gray squares; 7.5 μM, dark gray squares; 12.5 μM, black squares). Points are the average±SD of the activity of LYP plotted vs substrate concentration. Lines are fitting of data to the Michaelis–Menten equation. Vmax and KM values for each concentration of inhibitor are shown below the graph. (C) Activity of 25 nM LYP on the pY peptide in the presence of increasing concentrations of compound 13 (DMSO, white squares; 22 μM, light gray squares; 27 μM, dark gray squares; 32 μM, black squares; structure of compound 13 is also shown). Points are the average±SD of the activity of LYP plotted vs substrate concentration. Lines are fitting of data to the Michaelis–Menten equation. Vmax and KM values for each concentration of inhibitor are shown below the graph. (D–F) Inhibition of LYP by compounds 4e and 4g is nonmutually exclusive with compound 13. (D) Dual inhibition plot of compound 4e versus compound 13. The reciprocal rate of 25 nM LYP-catalyzed hydrolysis of the pY peptide was plotted at a series of compound 13 concentrations (DMSO, white circles; 65 μM, gray circles; 75 μM, black circles) in the presence of increasing concentration of compound 4e. Lines are fitting of the data to a linear regression. (E) Dual inhibition plot of compound 4g vs compound 13. The reciprocal rate of 25 nM LYP-catalyzed hydrolysis of the pY peptide was plotted at a series of compound 13 concentrations (DMSO, white circles; 65 μM, gray circles; 75 μM, black circles) in the presence of increasing concentration of compound 4g. Lines are fitting of the data to a linear regression. (F) Dual inhibition plot of compound 4e versus 4g. The reciprocal rate of 25 nM LYP-catalyzed hydrolysis of the pY peptide was plotted at a series of compound 4g concentrations (DMSO, white circles; 10 μM, gray circles; 20 μM, black circles) in the presence of increasing concentration of compound 4e. Lines are fitting of the data to a linear regression. All data in this figure are representative of at least two independent experiments.
RESULTS
Enzyme–Based Screening and Counterscreening
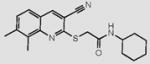
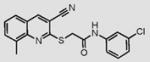
We initially screened a library of 4000 druglike small-molecule compounds against LYP. We used high concentrations of p-nitrophenyl phosphate (pNPP) as a substrate in an attempt to select against competitive inhibitors. A total of 137 compounds exhibited >50% inhibition at 40 μg/mL and were further tested at different concentrations to calculate IC50 values, which ranged between 11 and 100 μM. We excluded compounds whose structures, upon visual inspection, suggested evidence of oxidative-mediated inhibition. Twelve of the remaining compounds showed IC50 values less than or equal to 30 μM, and their structures are shown in Table 1. These compounds were tested for selectivity against three additional PTPs, including PTP-PEST (the PTP most closely related to LYP), hematopoietic tyrosine phosphatase (HePTP), and low molecular weight protein tyrosine phosphatase isoform A (LMPTP-A).18 As shown in Table 2, half of the compounds (compounds 1, 2, 4, 5, 6, and 7) showed some selectivity for LYP over PTP-PEST. Of these compounds, four (compounds 1, 2, 4, and 5) showed no selectivity between LYP and HePTP, while compound 6 showed around 2-fold selectivity for LYP. Compound 7 showed higher selectivity for HePTP over LYP and was excluded from further consideration. The remaining top five compounds (compounds 1, 2, 4, 5, and 6) showed little inhibitory activity on LMPTP-A, which is the least structurally related to LYP. We carried out a secondary screen to test the inhibitory activity of the top five compounds on LYP using a 14-amino acid peptide, ARLIED-NEpYTAREG, derived from the Y394 phosphorylation site of Lck, which more closely resembles the physiological substrate of the phosphatase. Four of the compounds showed IC50 values of around 10 μM(IC50 was 6.2 ± 1.3 μM(95% CI) for compound 1, 5.4 ± 2.0 μM (95% CI) for compound 2, 13.7 ± 1.8 μM (95% CI) for compound 4, and 9.9 ± 6.4 μM (95% CI) for compound 6), while compound 5 had an IC50 value of >80 μM and was not pursued further.
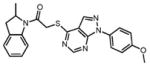
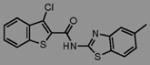
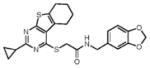
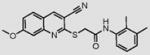
Table 1.
Structures of Inhibitors of LYPa
| Comp. # | Structure | Comp. # | Structure |
|---|---|---|---|
| 1 |
|
7 |
|
| 2 |
|
8 |
|
| 3 |
|
9 |
|
| 4 |
|
10 |
|
| 5 |
|
11 |
|
| 6 |
|
12 |
|
Compounds are ranked by decreasing potency (IC50 in LYP inhibition assays). Compounds belonging to the same series are indicated by shading. Unshaded compounds are singletons.
Table 2.
Potency and Selectivity of Inhibitors of LYPa
| compd | IC50 (μM)
|
|||
|---|---|---|---|---|
| LYP | PTP–PEST | HePTP | LMPTP–A | |
| 1 | 11.2 ± 0.5 | 20 ±3 | 9± 0 | >90 |
| 2 | 11.3 | 35 ±5 | 10 ± 2 | 71.9 |
| 3 | 19.8 ±1 | 21 ±1 | 8± 2 | 45.3 |
| 4 | 20.6 ± 2 | >40 | 20 ± 2 | >90 |
| 5 | 22 | >40 | 18 ± 3 | >90 |
| 6 | 22.0 ±2 | 39± 1 | >40 | >90 |
| 7 | 23.3 ± 2.8 | 36 ±2 | 12 ± 0.5 | >90 |
| 8 | 26.6 ± 3 | 27.5 ± 0.5 | 20 ± 2 | 53.3 |
| 9 | 27.2 ±3 | 28 ± 4 | 22 | >90 |
| 10 | 28.1 ±2 | 16 ±4 | 16 ± 3 | >90 |
| 11 | 29.5 ± 3 | 3 14 ±1 | 8± 2.5 | >90 |
| 12 | 30.5 ± 0.5 | 18 ±5 | 15 ± 2 | 60.9 |
Shaded compounds showed selectivity versus PTP-PEST. Assays were performed in 50 mM Bis-Tris, pH 6.0, with 1 mM DTT at 37 °C, using 2 mM pNPP as a substrate.
Effect of Inhibitors on TCR Signaling
Next, we tested the top four inhibitors for their ability to inhibit LYP in T cells. First, we tested the effects of the four compounds on the early stages of TCR signaling in the Jurkat T antigen (JTAg) human T cell line.44 As a readout of PTP activity, we analyzed the phosphorylation of Lck at its positive regulatory Y394 residue. Lck is a well-known physiological substrate of the PTPs CD45 and LYP, through its two major phosphorylation sites at Y505 (a negative regulator of Lck activation) and Y394 (a positive regulator of Lck activation), respectively.22,45 Following incubation with LYP inhibitors (50 μM 1, 2, 4, and 6), we stimulated the TCR with C305 antibody.46 Western blotting of lysates of these cells with an antibody to Src-pY416, which cross-reacts with the pY394 site of Lck, showed that among the four inhibitors tested, only compound 4 increased TCR-induced phosphorylation of Lck at Y394 (Figure 1A). To extend our observation of compound 4 to primary T cells and to directly test if the increase in Y394 phosphorylation was due to inhibition of LYP, we analyzed the effect of compound 4 on T cells of Ptpn22−/− knockout mice compared to Ptpn22+/+ T cells. T cells were incubated with 50 μM compound 4 and stimulated with anti-CD3 and anti-CD4/anti-CD28 antibodies. As seen in Figure 1B, compound 4 caused increased Lck phosphorylation at Y394 in wild type (Ptpn22+/+) T cells but had no effect on phosphorylation of Lck in Ptpn22−/− T cells, suggesting that compound 4 preferentially inhibits PEST-enriched phosphatase (Pep, the mouse homologue of LYP) over other phosphatases. A possible explanation for the lack of activity of compounds 1, 2, and 6 in cell-based assays could be their concurrent inhibition of CD45, a positive regulator of Lck activation. Thus, we assessed whether the top four compounds would inhibit CD45 in vitro. We found that compound 2 was able to inhibitCD45 with an IC50 of 11 μM; however, we were unable to detect increased phosphorylation of Lck at Y505 in JTAg cells treated with compound 2 (data not shown). The other compounds were poor CD45 inhibitors (IC50 values were 87 and 90 μM for compounds 4 and 1, respectively, and >90 μM for compound 6). We proceeded to evaluate the effect of compound 4 on downstream signaling events such as the activation of ZAP70 and on the Ras-Raf-MAPK pathway (extracellular signal-regulated kinase, ERK1/2). In agreement with the results observed with Lck (replicated in Figure 1C, top panel), compound 4 increased TCR-stimulated phosphorylation of ZAP70 (Figure 1C, middle panel). In addition, compound 4 also increased ERK1/2 phosphorylation (Figure 1C, lower panel). To provide further evidence for our notion, we assessed the effect of the inhibitor on TCR-induced phosphorylation of SH2 domain containing leukocyte protein of 76 kDa (SLP76) at the single cell level by phospho-specific flow cytometry (Figure 1D). SLP76 is an early mediator of TCR signaling downstream of Lck and LYP. Compared to the control (gray graph), as seen in Figure 1D, cells treated with compound 4 showed higher levels of TCR-induced SLP76 phosphorylation (black graph). Taken together, all these experiments demonstrate that compound 4 is efficient in boosting early TCR signaling by suppressing the function of LYP. Incubation with 50 μM compound 4 was equally able to boost TCR-induced phosphorylation of Lck, ZAP70, and linker for activation of T cells (LAT) also in primary human T cells (data not shown and Figure 1E). In line with its inhibitory effect on the activity of Pep, treatment of primary mouse cells with compound 4 led to increased TCR-induced CD69 expression, showing that the compound is able to boost late and early TCR signaling events (see Table 3). Increased CD69 expression has been reported in T cells from Ptpn22−/− mice.21,47
Figure 1.

Intracellular inhibition of LYP by compound 4. (A, B) Compound 4 increases phosphorylation of Lck Y394 in T cells. (A) JTAg cells were treated with 50 μM of the top four compounds in Table 1 (lanes 3 and 4 of each panel) or DMSO (lanes 1 and 2 of each panel) and either left unstimulated (lanes 1 and 3 of each panel) or stimulated (lanes 2 and 4 of each panel) with C305 for 2 min. Top panels show anti-pSrc(Y416) immunoblots. Bottom panels show anti-Lck blots of same samples. (B) Thymocytes from Ptpn22−/− (left panels) or Ptpn22+/+ (right panels) mice were treated with 50 μM compound 4 (lanes 3 and 4 in each panel) or DMSO (lanes 1 and 2 in each panel) and either left unstimulated (lanes 1 and 3 in each panel) or stimulated (lanes 2 and 4 in each panel) with biotinylated anti-CD3 and anti-CD4, followed by cross-linking with streptavidin for 1.5min. Top panels show anti-pSrc(Y416) immunoblots. Bottom panels show anti-Lck blots of same samples. Arrows indicate the position of Lck in each panel. The ratio of pSrc(Y416)/Lck band intensity as determined by densitometric scanning of the blots is indicated above each lane. (C–E) Compound 4 affects TCR signaling downstream Lck. (C) Jurkat TAg cells were treated with 50 μM compound 4 (lanes 3 and 4 in each panel) or left untreated (lanes 1 and 2 in each panel) and were either left unstimulated (lanes 1 and 3 in each panel) or stimulated (lanes 2 and 4 in each panel) with C305 for 2 min. Panels show blots of total lysates with the following antibodies: top panel, anti-pSrc(Y416); second from top, control anti-Lck; third from top, antipZAP70(Y319); third from bottom, control anti-ZAP70; second from bottom, anti-pERK; bottom panel, control anti-ERK. (D) Single-cell analysis of TCR-induced phosphorylation of SLP-76 by phospho-flow cytometry. Jurkat TAg cells were treated with 50 μM compound 4 (continuous line and black graphs) or DMSO (dashed-line and gray graphs) and either left unstimulated (white graphs) or stimulated with C305 for 2 min (shaded graphs). Cells were fixed and stained with a PE-conjugated anti-pSLP76(Y128) antibody. Graphs show relative pSLP76 levels as detected by flow cytometry after gating on high forward and high side scatter (=cells with high SLP76 phosphorylation) cells. (E). Primary human T cells were treated with 50 μM compound 4 (black histograms) or DMSO (gray histograms) and were either left unstimulated or stimulated with anti-CD3 and anti-CD28 Abs and cross-linked for 1 min. Graph shows relative levels of pLAT(Y191) as assessed by ELISA. All data in this figure are representative of at least two independent experiments.
Table 3.
Compound 4 Boosts T Cell Activation in Primary Mouse Cellsa
| sample % | CD69hi cells |
|---|---|
| CD4+ DMSO | 29.2 |
| CD4+ 50 μM 4 | 36.8 |
| CD4+ 100 μM 4 | 38.9 |
| CD8+ DMSO | 5.3 |
| CD8+ 50 μM 4 | 12.1 |
| CD8+ 100 μM 4 | 13.7 |
Splenocytes from C57BL/6 cells were stimulated with 1 μg/mL anti-CD3 and anti-CD28 Abs for 24 h at 37 °C in the presence of compound 4 or DMSO alone. Cells were stained with anti-CD69-PerCP-Cy5.5 and either anti-CD4-FITC or anti-CD8-FITC conjugated antibodies. Similar data were obtained using primary cells from NOD mice.
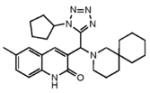
Structure–Activity Relationship (SAR) Analysis
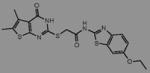
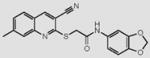
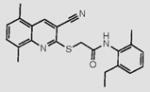
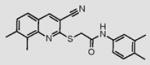
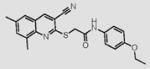
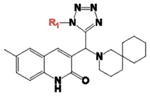
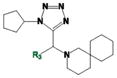
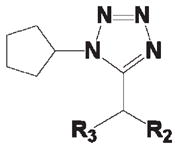
As shown in Table 1, compound 4 includes a 1-cyclopentyl-1H-tetrazole substructure (whose cyclopentyl side chain is defined as R1 in Table 4), a 2-azaspiro[5,5]undecane substructure (which is defined as R2 in Table 4), and a 6-methylquinolin-2(1H)-one substructure (which is defined as R3 in Table 4). We carried out a preliminary SAR analysis on compound 4 by searching for commercially available analogues that would be substituted only in one of the three above-mentioned substructures. We identified 4 compounds with different substitutions in the R1 position, 19 compounds with different substitutions in the R2 position, and 6 compounds with different substitutions in the R3 position. Each one of these compounds was tested for potency, selectivity against the closely related PTP-PEST and against HePTP, and cell-permeability using the same assay shown in Figure 1A. The results are summarized in Table 4. Substitution of the cyclopentane on the tetrazole ring (R1; see red shaded cells in Table 4) and variations in the position and number of methyl side chains on the quinolinone substructure (R3, green shaded cells in Table 4) affected potency. Variations in R1 and R3 minimally affected selectivity, and none of them were associated with significant cell-permeability. From the analysis of R2-substituents (blue shaded cells in Table 4), a pattern emerged where substructures with two aromatic groups generally led to increased potency (see 4e, 4f, 4g, 4h, 4i), while monocyclic polar structures such as piperidines (for example, see 4j, 4k, 4p) and especially piperazines (for example, see 4r–w) decreased potency. Substitution of the spiroundecane with two aromatic structures also generally led to increased cell-permeability and selectivity against HePTP (which was increased 10 and 7 times, respectively, for our top compounds 4e and 4g) but not against PTP-PEST. We then searched for additional compounds where one of the active aromatic substructures at the R2 position was combined with previously analyzed substitutions in R1 or R3 and found five additional compounds. As shown in Table 5, these compounds also showed generally improved potency compared to compound 4 and structures with only substitutions in R1 or R3. Substructures with two aromatic rings in R2 might improve potency by maximizing hydrophobic interactions of the compound with exposed residues on the surface of LYP.
Table 4.
Potency, Selectivity, and Cell-Permeability of Compound 4 Analoguesa
| Comp |
|
LYP IC50 (μM) | Selectivity vs PTP-PEST | Selectivity vs HePTP | Cell-Permeable | 4o |
|
30.71 ±0.23 | 1.06 | IC50> 50 μM | N |
| 4a |
|
5.58 ±0.35 | 1.75 | 5.17 | N | 4p |
|
30.85 ±0.23 | 1.65 | IC50> 75 μM | N |
| 4b |
|
10.27 ±0.19 | 1.55 | 3.63 | N | 4q |
|
31.50 ±9.78 | 1.28 | IC50> 75 μM | N |
| 4c |
|
11.18 ±1.08 | 1.35 | 3.27 | N | 4r |
|
>40 | NT | NT | NT |
| 4d |
|
21.24 ±2.00 | 1.33 | IC50> 75 μM | N | 4s |
|
>40 | NT | NT | NT |
| Comp |

|
LYP IC50 (μM) | Selectivity vs PTP-PEST | Selectivity vs HePTP | Cell-Permeable | 4t |
|
>40 | NT | NT | NT |
| 4e |
|
5.28 ±0.57 | 1.05 | 10.41 | Y | 4u |
|
>40 | NT | NT | NT |
| 4f |

|
6.31 ±0.35 | 1.38 | 4.67 | N | 4v |

|
>40 | NT | NT | NT |
| 4g |
|
9.19 ±0.69 | 1.51 | 7.16 | Y | 4w |
|
>40 | NT | NT | NT |
| 4h |
|
13.03 ±0.51 | 1.16 | 2.27 | N | Comp |
|
LYP IC50 (μM) | Selectivity vs PTP-PEST | Selectivity vs HePTP | Cell-Permeable |
| 4i |
|
13.30 ±0.48 | 1.48 | 5.23 | Y | 4x |

|
11.11 ±0.43 | 1.44 | 3.17 | N |
| 4j |
|
17.12 ±0.78 | 1.55 | 2.07 | N | 4y |
|
12.12 ±0.59 | 1.33 | 2.72 | N |
| 4k |
|
20.58 ±0.90 | 1.52 | 2.55 | N | 4z |
|
15.17 ±0.43 | 1.43 | 3.62 | N |
| 4l |

|
25.09 ±1.24 | 0.92 | 2.19 | N | 4aa |
|
15.75 ±0.56 | 1.34 | 3.35 | N |
| 4m |
|
29.98 ±1.44 | 1.29 | IC50> 75 μM | N | 4ab |
|
18.21 ±0.48 | 1.74 | 3.96 | N |
| 4n |
|
30.55 ±0.66 | 1.22 | 2.21 | Y | 4ac |
|
20.40 ±1.15 | 1.52 | 2.92 | N |
Assays to determine the IC50 were performed in 50mMBis-Tris, pH 6.0, with 1mMDTT. For LYP and PTP-PEST, 13.72 μMpY peptide was used as a substrate. For HePTP, 579.9 μMpNPP was used as a substrate. Selectivity was defined as the ratio of the IC50 on either PTP-PEST or HePTP to the IC50 on LYP. Assays to determine the cell permeability of the compounds were performed by preincubation of JTAg cells with compound (50 μM) or DMSO for 30 min at 37 °C, followed by stimulation with C305 hybridoma for 2 min at 37 °C. Lysates were blotted for pSrc(Y416) and Lck levels. Induction of pSrc(Y416) levels was calculated from the ratio of the intensity of pSrc versus Lck, as assessed by densitometric scanning of the blots. Intracellular inhibition of LYP was scored as the fold induction of pSrc(Y416) levels measured in TCR-stimulated cells treated with the compound versus the levels measured for TCR-stimulated cells treated with DMSO alone. Y = compounds that increased the fold induction of pSrc(Y416) levels by >1.0 in human and mouse TCR-stimulated cells in at least three independent experiments; N = compounds that did not increase the fold induction by >1.0 of pSrc(Y416) levels in human and mouse TCR-stimulated cells in at least three independent experiments. NT = not tested.
Table 5.
Potency and Selectivity of Compound 4 R2 Substitution Analoguesa
 | |||||
|---|---|---|---|---|---|
| Comp | R2 | R3 | LYP IC50 (μM) |
Selectivity vs PTP-PEST |
Selectivity vs HePTP |
| 4ad |
|
|
7.62 ±0.97 | 1.31 | 4.07 |
| 4ae |

|
|
7.86 ±1.48 | 1.23 | 3.58 |
| 4af |

|
|
9.13 ±0.84 | 1.07 | 2.65 |
| 4ag |

|
|
9.72 ±0.32 | 0.98 | 1.78 |
| 4ah |

|
|
13.33 ±0.36 | 0.76 | 2.90 |
Assays to determine the IC50 were performed in 50mMBis-Tris, pH 6.0, with 1mMDTT. For LYP and PTP-PEST, 13.72 μMpY peptide was used as a substrate. For HePTP, 579.9 μMpNPP was used as a substrate. Selectivity was defined as the ratio of the IC50 on either PTP-PEST or HePTP to the IC50 on LYP.
Kinetic Analysis and Comparison with a Known Competitive Inhibitor
Next, we sought to define the mechanism of inhibition of our compounds using the above-mentioned pY peptide as a substrate. We compared our hits to compound 13, a known competitive inhibitor of LYP. First, we studied the relationship between IC50 and substrate concentration of our most potent and selective five compounds (compounds 4a, 4b, 4e, 4f, and 4g; see Table 4). We found that the IC50 of all these compounds was independent from substrate concentration, which suggested a noncompetitive inhibition mechanism. Figure 2A shows the IC50 vs substrate plot for compound 4 and our two top analogues, compounds 4e and 4g. As a control, Figure 2A also shows that the IC50 of compound 13 significantly increased at high substrate concentrations. Activity vs substrate plots carried out at increasing concentration of compounds showed that all three compounds caused decreases in Vmax, which was not observed for compound 13 (data not shown and see Figure 2B and Figure 2C). The above-mentioned kinetics were fit to a Michaelis–Menten with a mixed inhibition model. On the basis of the calculated Ki and α values (reported in Table 6), we suggest that the top inhibitors of our series display a mixed inhibition behavior with a significant noncompetitive component (as a comparison, see α values close to infinite for compound 13 in Table 6). To explore whether our scaffold binds to the active site of LYP, studies were then carried out to determine whether our top compounds and compound 13 bind to LYP in a mutually exclusive fashion. Dual inhibition plots of compounds 4e and 4g vs compound 13 showed converging lines (see Figure 2D and Figure 2E), suggesting that these two compounds interact with surface determinants outside the active site of the enzyme. As an important control, when the dual inhibition analysis was carried out between compounds 4e and 4g, the corresponding plot showed parallel lines, supporting the idea that they bind to the surface of the enzyme in a mutually exclusive fashion. Overall the data suggest that these compounds do not interact with the active site of the enzyme, which fits well with their noncompetitive behavior in the above-mentioned enzymatic assays.
Table 6.
Kinetic Parameters of LYP Inhibitorsa
| compd | Ki (μM) | α | Ki′(μM) |
| 4 | 12.48 ± 4.42 | 3.05 ± 1.48 | 38.06 ± 4.66 |
| 13 | 33.87 ± 59. | 22 ~2.08 × 10¹⁴ | |
| 4a | 3.07 ± 1.52 | 5.74 ± 4.61 | 17.62 ± 4.85 |
| 4b | 23.50 ± 17.65 | 1.14 ± 1.00 | 26.79 ± 17.68 |
| 4e | 2.16 ± 1.26 | 4.93 ± 3.35 | 10.65 ± 3.58 |
| 4f | 11.04 ± 5.64 | 1.93 ± 1.27 | 21.31 ± 5.78 |
| 4g | 8.07 ± 5.56 | 2.96 ± 2.48 | 23.89 ± 6.09 |
LYP-catalyzed hydrolysis of the pY peptide was measured in the presence of various concentrations of inhibitor at a series of substrate concentrations, in 50 mM Bis-Tris, pH 6.0, with 1 mM DTT at 37 °C.
Peptide Amide Hydrogen/Deuterium Exchange Mass Spectrometry (DXMS) Analysis of Lead Compound
Next, we set out to study the mechanism of action of our lead compound 4e on LYP by DXMS. DXMS is emerging as a useful tool to map local and global effects of compound binding on protein stability and exposure48,49 and has already been applied to the study of PTP folding and substrate/inhibitor interaction. 50–52 As shown in Figure 3A, in our DXMS study we achieved 77% sequence coverage of the primary structure of LYP with peptide probes (the maximum coverage map of our protein is shown in Supporting Information Figure 1). We did not observe significant increase in deuteration of any of the peptide probes followed in the analysis, and thus, we can reasonably exclude that inhibition of the enzyme is due to nonspecific unfolding of the protein. In the presence of compound 4e, seven peptides (yellow bars in Figure 3A) showed significantly (>10%53) decreased deuteration, suggesting that interaction with the compound led to decreased exposure and/or increased stability of selected segments of LYP. Three of the seven peptides were contiguous on the primary structure of LYP, and together they cover the whole aa 2–47 region (deuteration rates for the two longer peptides are shown in Figure 3B). This segment includes the α 1′ and α 2′ helices and a small portion of the α 1 helix (see Figure 3C and Figure 3D).10,54 Interestingly, another peptide showing decreased deuteration covers a short stretch (aa 257–261) of α 5 helix, which as seen in the crystal structure of LYP, directly interacts with the α 2′ helix.10,54 These data suggest a working model where compound 4e is likely to directly interact with the α 1′ and α 2′ helices of LYP. Stabilization of the α 2′ helix following the interaction with the compound causes secondary conformational/stability changes of closely interacting segments of LYP.
Figure 3.

Effect of compound 4e on deuteration exchange of LYP. (A) The percent in deuterium exchange between LYP with DMSO or compound 4e is shown. Each histogram represents a peptide in which deuterium exchange was quantified. Deuterium exchange for four different time points was collected (ranging from 30 to 1000 s), and the time point for each peptide showing the greatest change is shown. For different ionic forms of peptides the average variation was calculated. Any change greater than 10% was considered significant,53 and such peptides are shown in yellow. Peptides that showed a difference less than 10% are shown in turquoise. For different peptides that covered the same segment, only the longest peptide is shown. Data are representative of two independent experiments, and the variation between the same peptide between the two experiments was less than 5%. (B) Deuteration change of LYP upon binding of compound 4e. Plot shows percent deuteration of two peptides shown in (A) versus time for LYP incubated with compound 4e (yellow squares) or DMSO (blue squares). (C) Primary structure of the catalytic domain of LYP, with secondary structure superimposed. Yellow and turquoise coding is the same as in (A). The WPD loop is shown in purple, and the P loop is shown in blue. (D) Three-dimensional representation of the backbone of LYP according to PDB code 3H2X. Coding is the same as in (C). Selected helices are shown.
Modeling and Mutagenesis of a Key Residue Leu29
Next, we attempted to model the interaction of our compounds with LYP by virtual docking. On the basis of the DXMS data shown in Figure 3 and of the SAR data shown in Tables 4 and 5, we reasoned that the highest candidate pockets for interaction should satisfy the criteria of (1) being proximal to the α 1′ and α 2′ helices in the three-dimensional space and (2) including several exposed hydrophobic residues. We found three such pockets, which are indicated as site 1, site 2, and site 3 in Figure 4A, left, middle, and right panels, respectively; exposed hydrophobic residues in the sites are pictured in red, while the remainder of each site is pictured in pink (the same color code used in Figure 3D has been applied to the rest of the molecule). When the top active compounds along with some inactive compounds were docked onto the three potential drug binding sites, a significant correlation between genetic optimization for ligand docking (GOLD) score and activity could only be obtained for site 1 but not for site 2 or 3. As shown in Figure 4B, site 1 is defined by (a) Phe28 and Leu29, forming an exposed hydrophobic patch on the proximal part of the α 2′ helix which showed a high DXMS signal, (b) a small N-terminal segment of the α 1 helix, which also showed a high DXMS signal, (c) a second hydrophobic patch formed by Ile63 and Leu64 on the loop between the α 1 helix and the β1 sheet, (d) the exposed part of the Q-loop on the N-terminus of the α 4 helix, and (e) the side chains of Pro270 and Ser271 that line the bottom of the pocket. Figure 4C shows that there was a very significant correlation between the docking score for site 1 and compound activity. Figure 4D shows docking of our top compound 4e to site 1. In this model the tetrazole forms hydrogen bonds with the exposed Arg266 in the Q-loop and Ser271 while the aromatic rings in R2 make hydrophobic interactions with one or the other of the two above-mentioned exposed hydrophobic patches. The methyl group of the quinolinone substructure could also be involved in hydrophobic interactions with Leu64. Interestingly compound 4 could be easily docked in the same orientation (Figure 4E). The cyclohexane ring of the spiroundecane substructure can still form interactions with the side chain of Ile63; however, compound 4 lacks stabilizing interactions with Phe28 and Leu29. We reasoned that one method to test our docking model would be to compare the effect of compound 4e vs compound 4 on a Leu29Alamutant of LYP, which was previously shown to retain significant enzymatic activity.10 We found that the Leu29Ala mutation reduced inhibition by compound 4e >2 times (Figure 4F).However, we could not detect any effect of the same mutation on inhibition by compound 4 (Figure 4G). These data validate our model and suggest that hydrophobic interactions between bidentate aromatic substructures in R2 and Leu29 on the α 2′ helix are responsible for the increased potency of the top analogues and presumably for the high DXMS signal recorded on the Leu29-bearing helix.
Figure 4.

Three-dimensional surface representation of the potential site of interaction between LYP and compound 4. (A) Three-dimensional surface representation of the catalytic domain of LYP according to PDB code 3H2X. Candidate hydrophobic pockets are indicated as site 1, site 2, and site 3. Exposed hydrophobic residues within each site are shown in red. Other residues that contribute to form the pocket are shown in pink. Deuteration of the protein is coded as in Figure 3. (B) Magnification and 180° rotation of the backbone from (A) (green inset) which showed a significant docking score. Key residues forming the pocket are shown. Residues that coordinate with the compound are named. (C) Compounds that inhibited LYP show significantly higher GOLD docking score compared to inactive compounds. Correlation between inhibitory activity and GOLD score and statistical significance is shown. Compounds that inhibited LYP are shown as red symbols; inactive compounds are shown as black symbols. (D–E) Docking of compound 4e (D) and compound 4 (E) into site 1 of LYP as shown in (A). Key residues shown in (C) are named. See text for further explanation. (F, G) Effect of LYP L29A mutation on the inhibitory activity of compound 4e and compound 4. Graph shows dose-response inhibition of LYP WT (black squares and continuous line) or LYP L29A (red squares and dashed line) by compound 4e (F) and compound 4 (G). Plot shows the average ± SD percent activity of 25 nM LYP-catalyzed hydrolysis of the pY peptide versus inhibitor concentration. Lines are fitting of the data to a one-phase exponential decay equation in order to calculate the IC50. Data from (F) and (G) are each representative of two independent experiments.
DISCUSSION AND CONCLUSIONS
It has been proposed that a small molecule inhibitor of LYP would have preventative and/or therapeutic efficacy in patients with a wide range of autoimmune diseases, especially in carriers of the W620 variant.10,27 Cell-permeable small molecule inhibitors of LYP are also sought as probes to understand the biology of this important autoimmunity gene in cells and in animal models. A few small molecule inhibitors of LYP have been described.10,41–43 Here we report the discovery of a novel series of inhibitors of LYP, which were able to boost signaling through the TCR in mouse and human T cells. Our inhibitors display two novel features: (a) they lack phosphomimetic groups and (b) they show a noncompetitive mechanism of inhibition. We used a combination of dual inhibition studies, DXMS-guided docking, and mutagenesis experiments to map the interaction of our inhibitors with the enzyme with a high degree of confidence. We propose a model where the compounds bind to a pocket outside the active site of the enzyme. Hydrophobic interactions between at least one of the substructures of the compounds and hydrophobic exposed patches of LYP stabilize the compound in the pocket. On the basis of our model, a likely interpretation of our SAR data for substitutions of the spiroundecane substructure is that the most potent compounds carrying substructures with two aromatic groups can interact with two exposed hydrophobic patches. Substitution of the spiroundecane with a polar monocyclic group abolishes such interactions, thus leading to decreased potency. Hydrophobic interactions stabilizing the methyl-substituted quinolinone substructure in the pocket could explain why variations in the number and position of methyl substituents affected compound potency. Potency enhancement by hydrophobic substructures correlated well with increased effects on intracellular signaling.
For inhibitors not displaying a clearly competitive mechanism of action, DXMS is a reliable first line approach, which allows the targeting of docking to one or a few highly candidate sites. DXMS also helps to increase confidence in the allosteric mechanism of novel compounds by (1) excluding that inhibition is due to nonspecific unfolding of the protein and/or selected segments of the proteins48 and (2) providing evidence of secondary changes in exposure/stability/dynamics of protein segments not directly involved in inhibitor binding. In our case, DXMS showed decreased exposure of a relatively large N-terminal segment of the protein and of additional smaller fragments following interaction with the compound. These data support the idea that our compound acts through an allosteric mechanism. However, they are insufficient to formulate a clear model of action for our compounds. Additional critical phenomena following binding of our inhibitors might have gone undetected by DXMS because of (1) lack of sensitivity to changes in segments that are normally minimally exposed to the solvent and (2) the presence of few uncovered segments of the protein.
Cell-permeability is a feature that is often impaired by the phosphomimetic groups that characterize competitive PTP inhibitors. Targeting of secondary allosteric sites is viewed as a promising yet unexplored approach to develop cell-permeable inhibitors of PTPs. Indeed cell-permeability was a remarkable property of several of our compounds. Development of allosteric PTP inhibitors has been hampered in part by the small number of PTP physiological allosteric sites found so far. Also it is unclear whether very potent allosteric inhibitors of PTPs (comparable to the competitive inhibitors that are available for several classical PTPs) can be developed.
Selectivity of allosteric inhibitors might also not be easy to achieve, especially because allosteric pockets might show degrees of conservation even higher than the active site. Our hits showed significant interclass selectivity for classical PTPs (for example, vs LMPTP). However, among classical PTPs, we only observed selectivity vs CD45, while both HePTP and PTP-PEST were significantly inhibited by our compounds. Further improvement of potency and selectivity could be attempted by structure-based drug design through substituents that increase the interaction of the compounds with the allosteric pocket and especially with segments that are less conserved in other homologous PTPs. For example, the allosteric pocket modeled by the docking simulation includes the so-called “LYP-specific” loop, a flexible loop that is not conserved in other classical PTPs.10
In conclusion, we described here the first series of noncompetitive inhibitors of LYP that show activity on the intracellular enzyme in T cells. Our kinetics and structural data point to an allosteric mechanism of action. We suggest that our scaffold could be the starting point to attempt development of novel allosteric anti-LYP pharmacological agents.
EXPERIMENTAL SECTION
Materials, Chemicals, and Enzymes
The small-molecule compound library was purchased from Asinex (Winston-Salem, NC). All compounds were purchased with a minimum purity of 90%. Purity of each compound is reported in the Supporting Information Table 1. Chromatographic resolution of compound 4 using chiral high performance liquid chromatography mass spectrometry (HPLC–MS; see below) resulted in the identification of one major stereoisomer present at over 98%. Compounds were dissolved in dimethylsulfoxide (DMSO), and stock solutions were stored at –20 °C. The catalytic domain of CD45 was purchased from Biomol International (Plymouth Meeting, PA). p-nitrophenyl phosphate (pNPP) was purchased from Sigma (St. Louis, MO), The phosphotyrosine (pY) peptide ARLIEDNEpYTAREG was purchased from Celtek Peptides (Nashville, TN).
Antibodies and Reagents
Biotinylated anti-mouse CD3 and anti-mouse CD4 and fluorophore-conjugated anti-pSLP76(Y128), anti-CD69, anti-CD4, anti-CD8, anti-CD28, and anti-Armenian and Syrian hamster IgG antibodies were purchased from BD (San Jose, CA). Antihuman CD3 was purchased from eBioscience (San Diego, CA). The anti-human CD4 antibody was from Lab Vision (Fremont, CA). Streptavidin was obtained from Sigma and the F(ab′)2 cross-linker was from Jackson Immunolabs (West Grove, PA). The polyclonal antipZAP(Y319), anti-ZAP70, anti-pLck(Y505), anti-pSrc(Y416) antibodies and the anti-pLAT(Y191) and anti-pZAP70(Y319) enzyme-linked immunosorbent assays (ELISAs) were obtained from Cell Signaling Technology (Danvers, MA). The MILLIPLEX MAP Phospho Lck MAPmate was purchased from Millipore (Billerca, MA). The anti-Lck and anti-ERK2 antibodies were from Santa Cruz Biotechnology (Santa Cruz, CA). The Anti-ACTIVE MAPK polyclonal antibody was obtained from Promega (Madison, WI). The nitrocellulose membrane, horseradish peroxidase (HRP) conjugated secondary antibodies, and enhanced chemiluminescence (ECL) Plus chemiluminescence kit were obtained from GE-Healthcare Bio-Sciences (Piscataway, NJ). Lymphoprep was purchased from VWR International (West Chester, PA). Dynabeads were purchased from Invitrogen (Carlsbad, CA).
Purification of Recombinant Proteins
The modified pBAD plasmid encoding the catalytic domain of HePTP (aa 44–339) in frame with a noncleavable 6xHis tag was a kind gift from Lutz Tautz.55 cDNA fragments encoding the catalytic domains of LYP (aa 2–309) and PTP-PEST (aa 2–323, PEST) were cloned between the BamH1 and the Xho1 sites of the pET28a plasmid (EMD, Gibbstown, NJ) in frame with a cleavable N-terminal 6xHis tag. LYP 1–294 and the L29A mutant were cloned as described.10 Recombinant proteins were purified from lysates of isopropyl β-D-1-thiogalactopyranoside (IPTG) induced E. Coli BL21 cells by affinity chromatography on Ni2+ nitrilotriacetic acid columns (Qiagen, Germantown, MD). 6xHis-LYP, -PTP-PEST, and -HePTP were eluted using 250 mM imidazole. LMPTP-A was cloned between the BamHI and the XbaI sites of the pEGST vector,56 which allows expression of recombinant proteins in fusion with an N-terminal glutathione-S-transferase (GST) under control of the T7 promoter. The enzyme was expressed in BL21 E. Coli cells and isolated from lysates of IPTG-induced bacteria by single-step affinity chromatography on glutathione Sepharose (GE-Healthcare Bio-Sciences) by elution with a glutathione solution.
Chemical Library Screening for LYP Inhibitors
A library consisting of a highly diverse set of 4000 compounds was screened in a 96-well format. Each reaction contained 300 nM LYP, 2 mM pNPP, and 40 μg/mL compound in a final volume of 60 μL of 50 mMBis-Tris, pH 6.0, with 1 mM dithiothreitol (DTT). The reaction mixture was incubated for 25 min at 37 °C and was stopped by addition of 50 μL of 1 M NaOH. Compounds with an inhibition of 50% or more were further tested at multiple concentrations. All assays were performed in triplicate. The IC50 values were then determined for each compound from a plot of log(inhibitor concentration) versus percentage of enzyme inhibition using 2mM pNPP as a substrate. Absorbance was measured at 405 nm using a Molecular Devices Emax Precision Microplate reader.
Phosphatase Assays
All reactions were carried out at 37 °C in a buffer containing 50 mM Bis-Tris, pH 6.0, and 1 mM DTT in a final volume of 50 μL in the presence or absence of 0.005% Tween-20. The amount of DMSO did not exceed 6% of the total reaction volume. LYP was found to be insensitive to DMSO up to a concentration of 10% (data not shown). The phosphatase activity measured in triplicate was corrected for the nonspecific signal of identical reactions performed also in triplicate without addition of enzyme. The time of reaction and amount of enzyme for all assays were optimized in order to ensure that the readings were taken in initial rate conditions. Absorbance was measured on a Perkin-Elmer 1420 Multilabel Counter Victor3 V plate reader (Perkin-Elmer, Turku, Finland) or a Tecan Infinite M1000 (Tecan, San Jose, CA). The data were plotted using GraphPad Prism (GraphPad Software, La Jolla, CA). When pNPP was used as a substrate, the reactions were stopped by addition of 100 μL of 1 M NaOH and absorbance was measured at 405 nm. The activity of LYP and PTP-PEST was also detected using a pY peptide with sequence ARLIEDNEpYTAREG, derived from the Lck Y394 phosphorylation site. When the pY peptide was used as a substrate, the reaction was stopped by addition of 100 μL of BIOMOL GREEN (Biomol International) and the phosphate released was detected by measuring the absorbance at 620 nm. IC50 values were determined from a plot of inhibitor concentration versus percentage of enzyme activity. For SAR analysis, the activity of LYP and PTP-PEST was detected using 13.72 μM pY peptide. The activity of HePTP was detected using 579.9 μM pNPP.
For the determination of kinetic parameters, the LYP-catalyzed hydrolysis of the pY peptide was measured in the presence of various concentrations of inhibitor at a series of substrate concentrations. Vmax and KM were determined by fitting of the data to the Michaelis–Menten equation. The kinetic parameters Ki and α were calculated by nonlinear fitting of the data to the mixed model inhibition equation. Ki′ was calculated from the equation Ki′ = αKi.57 Inhibitor mutual exclusivity studies were performed by measuring the LYP-catalyzed hydrolysis of 13.72 μM pY peptide (KM concentration) at fixed concentrations of inhibitor in the presence of increasing concentrations of a second inhibitor.57 Data were plotted and fitted with a linear regression. All data was plotted using GraphPad Prism software.
Analysis of Compound Stereoisomers
Chiral HPLC–MS analyses were performed on a Shimadzu 2010-EV liquid chromatography–mass spectrometry (LCMS) system consisting of a LC-20AD prominence liquid chromatograph, a SPD-M20A photo diode array detector (PDA), a SIL-20AC autosampler, and an LCMS-2010EV LC mass spectrometer. A reversed-phase CHIRALCELOD-RH column (25 cm × 0.46 cm) was used for the compound separations. Solvents and samples were used as purchased (JT Baker, Phillipsburg, NJ). Separation was achieved by using a gradient mobile phase as follows: 10–95% B, 24.5 min. Solvent A was 5% (v/v) formic acid in water, and B was 100% acetonitrile. An injection volume of 5 μL with a 1.0 mL/min flow rate was used. Spectral information over the wavelength range of 200–300 nm was collected.
Cell Culture, Cell Treatments, and TCR Stimulation
Jurkat T cells expressing SV-40 large T antigen (JTAg)44 were kept at logarithmic growth in RPMI 1640 medium supplemented with 10% fetal bovine serum, 2 mM glutamine, 1 mM sodium pyruvate, 10 mM 4-(2-hydroxyethyl)-1-piperazineethanesulfonic acid (HEPES), pH 7.3, 2.5 mg/mL D-glucose, 100 units/mL of penicillin, and 100 μg/mL streptomycin. Compounds (50 μM) or DMSO was added to cells suspended in RPMI 1640 and incubated for 30–60 min at 37 °C. Cells were then divided and stimulated at 37 °C or left unstimulated. JTAg cells were stimulated with supernatants of C305 hybridoma46 for 2 min. Primary human T cells were stimulated for 1 min with 1 μg/mL anti-CD3, 1 μg/mL anti-CD28, and 10 μg/mL rabbit antimouse F(ab′)2 cross-linker. Thymocytes were stimulated by incubation with biotinylated anti-CD3 and anti-CD4 antibodies for 30 min at 4 °C and stimulated with a streptavidin cross-linker for 1.5 min at 37 °C. Splenocytes were stimulated by incubation with anti-CD3 and anti-CD28 antibodies for 30 s at 37 °C and stimulated with an anti-Armenian and Syrian hamster IgG for 1.5 min 37 °C.
For Western blotting analysis, cells were lysed in 20 mM Tris-HCl, pH 7.5, 150 mM NaCl, 5 mM ethylenediaminetetraacetic acid (EDTA), pH 8.0, and 1% NP-40 containing 10 μg/mL aprotinin, 10 μg/mL leupeptin, 10 μg/mL soybean trypsin inhibitor, 1 mM Na3VO4, and 1 mM phenylmethylsulfonyl fluoride. For analysis by ELISA, cells were lysed in 20 mM Tris-HCl (pH 7.5), 150 mM NaCl, 1 mM Na2EDTA, 1 mM ethylene glycol tetraacetic acid (EGTA), 1% Triton, 2.5 mM sodium pyrophosphate, 1 mM β-glycerophosphate, 1 mM Na3VO4, 1 mM phenylmethylsulfonyl fluoride, and 1 μg/mL leupeptin. Lysates were clarified by centrifugation at 13 200 rpm for 20 min.
Primary Cell Isolation
Primary mouse cells were isolated from the homogenized thymi or spleens of 4–8 week old C57BL/6 (Ptpn22+/+) mice (Taconic Farms, Inc., Hudson, NY) or Ptpn22−/− mice (Genentech, Inc., South San Francisco, CA) after depletion of red blood cells following standard procedures. Primary human T cells were isolated by Lymphoprep gradient centrifugation followed by depletion of B cells and monocytes by anti-CD19 and anti-CD14 Dynabeads.
Phospho–Flow Cytometry
Phospho-flow cytometry was performed on JTAg cells following the manufacturer’s protocols (BD Biosciences). Cells were treated with 50 μM compound 4 or DMSO, stimulated with C305 for 2 min or left unstimulated, and fixed immediately with BD Cytofix buffer. Cells were permeabilized using BD Phosflow Perm buffer III and stained with PE-conjugated antipSLP76(Y128) antibody. Cell fluorescence was assessed on a Cytomics FC500 cytometer (Beckman Coulter). Data analysis and graph preparation were performed using FlowJo software (Tree Star, Inc., Ashland, OR).
T Cell Activation Assay
To induce CD69 expression, splenocytes from C57BL/6 cells were stimulated with 1 μg/mL anti-CD3 and anti-CD28 Abs for 24 h at 37 °C in the presence of compound 4 or DMSO alone. Cells were then stained with anti-CD69-PerCP-Cy5.5 and either anti-CD4-FITC or anti-CD8-FITC conjugated antibodies. Gates were set on CD4+ and CD8+ cells, and the percentages of activated CD69hi cells were calculated. Samples were acquired on a FACSCanto II (BD Biosciences). Data were analyzed using FlowJo software (TreeStar, Ashland, OR).
Intracellular Inhibition of LYP
Lysates of TCR-stimulated JTAg cells were blotted for pSrc(Y416), pLck(Y505), and Lck levels. Induction of pSrc(Y416) levels was calculated from the ratio of the intensity of pSrc versus Lck, as assessed by densitometric scanning of the blots. Intracellular inhibition of LYP was scored as the fold induction of pSrc(Y416) levels measured in TCR-stimulated cells treated with the compound vs the ones measured for TCR-stimulated cells treated with DMSO alone.
Deuterium Exchange Mass Spectrometry. Optimization of Fragmentation Conditions
To optimize the concentration of guanidine hydrochloride (GuHCl) for fragmentation, 2 μL of a 2 mg/mL stock solution of protein was diluted with 6 μL of buffer (50 mM NaCl and 8.3 mM Tris, pH 7.2) and then quenched with 12 μL of 0.8% (v/v) formic acid containing various concentrations of GuHCl (0.08, 0.8 1.6, 3.2 M) with 16.6% glycerol, or 6.4 M GuHCl alone, at 0 °C and frozen at–80 °C. At 0 °C, the frozen quenched samples were melted on ice and then immediately passed over a protease column with a 16 μL bed volume filled with porcine pepsin (Sigma, immobilized on Poros AL 20 μm medium at 30 mg/mL following the manufacturer’s instructions), with 0.05% trifluoroacetic acid (TFA) in water at a flow rate of 20 μL/min for 4 min. The duration of digestion was 40 s. The proteolytic products were directly collected by a Magic C18AQ column (Michrom BioResources Inc., Auburn, CA) and then eluted with a linear gradient of 8–48% of solvent (80% (v/v) acetonitrile, 20% (v/v) water, 0.01% TFA) over 30 min. The eluate was then transferred to a Finnigan LCQ Classic mass spectrometer (with an ion trap) for mass spectrometric analysis, with the ESI sprayer voltage at 3.5 kV, capillary temperature at 200 °C, and data acquisition in either MS1 profile mode or data-dependent MS/MS mode. The SEQUEST software program (Thermo Finnigan, San Jose, CA) was used to identify the sequence of the pepsin-generated peptide ions. This set of peptides was then further examined by DXMS Explorer software (Sierra Analytics, Modesto, CA) to determine if the measured isotopic envelope of peptides was qualified for accurate measurement of the geometric centroid of isotopic envelopes on deuterated samples. The peptide coverage maps for various concentration of GuHCl were compared, and the condition with highest coverage map was used for deuterium exchange experiments.
Deuterium Exchange Experiments
Deuterated samples were prepared at 0 °C by diluting 2 μL of a 2 mg/mL protein stock solution with 7.5 μL of deuterated buffer and 0.5 μL of compound dissolved in DMSO (final concentration 250 μM) or DMSO alone, followed by on-exchange incubation for varying times (30, 100, 300, and 1000 s) prior to quenching in 15 μL of 0.8% formic acid, 0.08 M GuHCl at 0 °C. The solutions were then stored frozen at −80 °C. These deuterated samples were subjected to DXMS apparatus as described above, along with control samples of nondeuterated and fully deuterated protein (incubated in 0.5% formic acid in 100% D2O for 12 h at room temperature).
The centroids of isotopic envelopes of nondeuterated, partially deuterated, and fully deuterated peptides were measured using DXMS Explorer and then converted to deuteration level with corrections for back-exchange. The deuteron recovery of fully deuterated sample was, on average, 70%.
Docking Studies
Molecular docking studies were performed using GOLD (genetic optimization for ligand docking) software package, version 4.0 (Cambridge Crystallographic Data Centre, Cambridge, U.K.). GOLD uses a genetic algorithm to explore the conformational space of a compound inside the binding site of a protein.58,59 The 2P6X crystal structure of LYP was used for the docking of inhibitors. The active site was defined as the collection of protein residues identified from DXMS analysis with a sphere of 15 Å radius. Docking studies were performed using the standard default settings with 500 runs on each molecule. For each of the 500 independent GA runs, a maximum of 100 000 operations were performed on a set of 5 groups with a population of 100 individuals. Ligand flexibility was included by using options such as flipping of ring corners, amides, pyramidal nitrogens, secondary and tertiary amines, and rotation of carboxylate groups, as well as torsion angle distribution and postprocess rotatable bonds as default. The annealing parameters were used as default cutoff values of 3.0 Å for hydrogen bonds and 4.0 Å for van der Waals interactions. Hydrophobic fitting points were calculated to facilitate the correct starting orientation of the compound for docking by placing the hydrophobic atoms appropriately in the corresponding areas of the active site. When the top three solutions attained root-mean-square deviation (rmsd) values within 1.5 Å, docking was terminated. Gold-Score, a scoring function within the software, is a dimensionless fitness value that takes into account the intra- and intermolecular hydrogen bonding interaction energy, van der Waals energy, and ligand torsion energy.58,59
Supplementary Material
Acknowledgments
We thank Dr. Lutz Tautz for the plasmid encoding HePTP. We are also grateful to Dr. Massimo Bottini for help with the TOC image. This work was supported by NIH Grants R21NS056945 (N.B.), CA099835, CA118595, AI076961, AI081982, AI2008031, GM020501, GM066170, RR029388 (V.L.W.), CA69202 (Z.-Y.Z.), and a JDRF short-term Bridge Award 27-2010-425 (N.B.). S.M.S. was supported by the NIH Training Grant in Cellular, Biochemical, and Molecular biology at University of Southern California. The authors declare no conflict of interest in relation to the data reported in this manuscript (number 1320) from the La Jolla Institute for Allergy and Immunology.
ABBREVIATIONS USED
- Csk
C-src tyrosine kinase
- Cy
cyanine
- DMSO
dimethylsulfoxide
- DTT
dithiothreitol
- DXMS
peptide amide hydrogen/deuterium exchange mass spectrometry
- ECL
enhanced chemiluminescence
- EDTA
ethylenediaminetetraacetic acid
- EGTA
ethylene glycol tetraacetic acid
- ELISA
enzyme-linked immunosorbent assay
- Erk
extracellular signal-regulated kinase
- FITC
fluorescein isothiocyanate
- Fyn
FYN oncogene related to SRC, FGR, YES
- HRP
horseradish peroxidase
- GOLD
genetic optimization for ligand docking
- GST
glutathione-S-transferase
- GuHCl
guanidine hydrochloride
- HEPES
4-(2-hydroxyethyl)-1-piperazineethanesulfonic acid
- HePTP
hematopoietic tyrosine phosphatase
- HPLC–MS
high performance liquid chromatography mass spectrometry
- IL-2
interleukin-2
- IPTG
isopropyl β-D-1-thiogalactopyranoside
- JTAg
Jurkat T cells expressing SV-40 large T antigen
- LAT
linker for activation of T cells
- Lck
leukocyte-specific protein tyrosine kinase
- LCMS
liquid chromatography–mass spectrometry
- LMPTP-A
low molecular weight protein tyrosine phosphatase isoform A
- LYP
lymphoid phosphatase
- NOD
nonobese diabetic
- PE
phycoerythrin
- Pep
PEST-enriched phosphatase
- PerCP
peridinin chlorophyll protein
- pNPP
p-nitrophenyl phosphate
- pSLP76
phospho-SLP76
- PTK
protein tyrosine kinase
- PTP
protein tyrosine phosphatase
- pY
phosphotyrosine
- RA
rheumatoid arthritis
- rmsd
root-mean-square deviation
- SAR
structure–activity relationship
- SLE
systemic lupus erythematosus
- SLP76
SH2 domain containing leukocyte protein of 76 kDa
- SNP
single nucleotide polymorphism
- Src
Rous sarcoma oncogene cellular homologue
- TFA
trifluoroacetic acid
- Treg
regulatory T cell
- T1D
type 1 diabetes
- TCR
T cell receptor
- ZAP70
ζ chain-associated protein tyrosine kinase 70
Footnotes
Accession Codes
PDB codes: 3H2X, 2P6X.
Supporting Information. Coverage map of pepsin-digested peptides of LYP identified in the MS/MS experiment and a table detailing purity of the compounds as purchased from a commercial provider. This material is available free of charge via the Internet at http://pubs.acs.org.
References
- 1.Zhang ZY. Protein tyrosine phosphatases: prospects for therapeutics. Curr Opin Chem Biol. 2001;5:416–423. doi: 10.1016/s1367-5931(00)00223-4. [DOI] [PubMed] [Google Scholar]
- 2.Jiang ZX, Zhang ZY. Targeting PTPs with small molecule inhibitors in cancer treatment. Cancer Metastasis Rev. 2008;27:263–272. doi: 10.1007/s10555-008-9113-3. [DOI] [PMC free article] [PubMed] [Google Scholar]
- 3.Blaskovich MA. Drug discovery and protein tyrosine phosphatases. Curr Med Chem. 2009;16:2095–2176. doi: 10.2174/092986709788612693. [DOI] [PubMed] [Google Scholar]
- 4.Zhang ZY. Protein tyrosine phosphatases: structure and function, substrate specificity, and inhibitor development. Annu Rev Pharmacol Toxicol. 2002;42:209–234. doi: 10.1146/annurev.pharmtox.42.083001.144616. [DOI] [PubMed] [Google Scholar]
- 5.Sun JP, Fedorov AA, Lee SY, Guo XL, Shen K, Lawrence DS, Almo SC, Zhang ZY. Crystal structure of PTP1B complexed with a potent and selective bidentate inhibitor. J Biol Chem. 2003;278:12406–12414. doi: 10.1074/jbc.M212491200. [DOI] [PubMed] [Google Scholar]
- 6.Kumar S, Liang F, Lawrence DS, Zhang ZY. Small molecule approach to studying protein tyrosine phosphatase. Methods (San Diego, CA, U S) 2005;35:9–21. doi: 10.1016/j.ymeth.2004.07.003. [DOI] [PubMed] [Google Scholar]
- 7.Srinivasan R, Li J, Ng SL, Kalesh KA, Yao SQ. Methods of using click chemistry in the discovery of enzyme inhibitors. Nat Protoc. 2007;2:2655–2664. doi: 10.1038/nprot.2007.323. [DOI] [PubMed] [Google Scholar]
- 8.Liu F, Hakami RM, Dyas B, Bahta M, Lountos GT, Waugh DS, Ulrich RG, Burke TR. A rapid oxime linker-based library approach to identification of bivalent inhibitors of the Yersinia pestis protein-tyrosine phosphatase, YopH. Bioorg Med Chem Lett. 2010;20:2813–2816. doi: 10.1016/j.bmcl.2010.03.058. [DOI] [PMC free article] [PubMed] [Google Scholar]
- 9.Liu G, Xin Z, Pei Z, Hajduk PJ, Abad-Zapatero C, Hutchins CW, Zhao H, Lubben TH, Ballaron SJ, Haasch DL, Kaszubska W, Rondinone CM, Trevillyan JM, Jirousek MR. Fragment screening and assembly: a highly efficient approach to a selective and cell active protein tyrosine phosphatase 1B inhibitor. J Med Chem. 2003;46:4232–4235. doi: 10.1021/jm034122o. [DOI] [PubMed] [Google Scholar]
- 10.Yu X, Sun JP, He Y, Guo X, Liu S, Zhou B, Hudmon A, Zhang ZY. Structure, inhibitor, and regulatory mechanism of Lyp, a lymphoid-specific tyrosine phosphatase implicated in autoimmune diseases. Proc Natl Acad Sci US A. 2007;104:19767–19772. doi: 10.1073/pnas.0706233104. [DOI] [PMC free article] [PubMed] [Google Scholar]
- 11.Wu S, Vossius S, Rahmouni S, Miletic AV, Vang T, Vazquez-Rodriguez J, Cerignoli F, Arimura Y, Williams S, Hayes T, Moutschen M, Vasile S, Pellecchia M, Mustelin T, Tautz L. Multidentate small-molecule inhibitors of vaccinia H1-related (VHR) phosphatase decrease proliferation of cervix cancer cells. J Med Chem. 2009;52:6716–6723. doi: 10.1021/jm901016k. [DOI] [PMC free article] [PubMed] [Google Scholar]
- 12.Wiesmann C, Barr KJ, Kung J, Zhu J, Erlanson DA, Shen W, Fahr BJ, Zhong M, Taylor L, Randal M, McDowell RS, Hansen SK. Allosteric inhibition of protein tyrosine phosphatase 1B. Nat Struct Mol Biol. 2004;11:730–737. doi: 10.1038/nsmb803. [DOI] [PubMed] [Google Scholar]
- 13.Lantz KA, Hart SG, Planey SL, Roitman MF, Ruiz-White IA, Wolfe HR, McLane MP. Inhibition of PTP1B by trodusquemine (MSI-1436) causes fat-specific weight loss in diet-induced obese mice. Obesity (Silver Spring) 2010;18:1516–1523. doi: 10.1038/oby.2009.444. [DOI] [PubMed] [Google Scholar]
- 14.Beers SA, Malloy EA, Wu W, Wachter MP, Gunnia U, Cavender D, Harris C, Davis J, Brosius R, Pellegrino-Gensey JL, Siekierka J. Nitroarylhydroxymethylphosphonic acids as inhibitors of CD45. Bioorg Med Chem. 1997;5:2203–2211. doi: 10.1016/s0968-0896(97)00174-0. [DOI] [PubMed] [Google Scholar]
- 15.Urbanek RA, Suchard SJ, Steelman GB, Knappenberger KS, Sygowski LA, Veale CA, Chapdelaine MJ. Potent reversible inhibitors of the protein tyrosine phosphatase CD45. J Med Chem. 2001;44:1777–1793. doi: 10.1021/jm000447i. [DOI] [PubMed] [Google Scholar]
- 16.Hermiston ML, Xu Z, Weiss A. CD45: a critical regulator of signaling thresholds in immune cells. Annu Rev Immunol. 2003;21:107–137. doi: 10.1146/annurev.immunol.21.120601.140946. [DOI] [PubMed] [Google Scholar]
- 17.Andersen JN, Mortensen OH, Peters GH, Drake PG, Iversen LF, Olsen OH, Jansen PG, Andersen HS, Tonks NK, Moller NP. Structural and evolutionary relationships among protein tyrosine phosphatase domains. Mol Cell Biol. 2001;21:7117–7136. doi: 10.1128/MCB.21.21.7117-7136.2001. [DOI] [PMC free article] [PubMed] [Google Scholar]
- 18.Alonso A, Sasin J, Bottini N, Friedberg I, Friedberg I, Osterman A, Godzik A, Hunter T, Dixon J, Mustelin T. Protein tyrosine phosphatases in the human genome. Cell. 2004;117:699–711. doi: 10.1016/j.cell.2004.05.018. [DOI] [PubMed] [Google Scholar]
- 19.Veillette A, Rhee I, Souza CM, Davidson D. PEST family phosphatases in immunity, autoimmunity, and autoinflammatory disorders. Immunol Rev. 2009;228:312–324. doi: 10.1111/j.1600-065X.2008.00747.x. [DOI] [PubMed] [Google Scholar]
- 20.Cloutier JF, Veillette A. Cooperative inhibition of T-cell antigen receptor signaling by a complex between a kinase and a phosphatase. J Exp Med. 1999;189:111–121. doi: 10.1084/jem.189.1.111. [DOI] [PMC free article] [PubMed] [Google Scholar]
- 21.Hasegawa K, Martin F, Huang G, Tumas D, Diehl L, Chan AC. PEST domain-enriched tyrosine phosphatase (PEP) regulation of effector/memory T cells. Science. 2004;303:685–689. doi: 10.1126/science.1092138. [DOI] [PubMed] [Google Scholar]
- 22.Wu J, Katrekar A, Honigberg LA, Smith AM, Conn MT, Tang J, Jeffery D, Mortara K, Sampang J, Williams SR, Buggy J, Clark JM. Identification of substrates of human protein-tyrosine phosphatase PTPN22. J Biol Chem. 2006;281:11002–11010. doi: 10.1074/jbc.M600498200. [DOI] [PubMed] [Google Scholar]
- 23.Bottini N, Musumeci L, Alonso A, Rahmouni S, Nika K, Rostamkhani M, MacMurray J, Meloni GF, Lucarelli P, Pellecchia M, Eisenbarth GS, Comings D, Mustelin T. A functional variant of lymphoid tyrosine phosphatase is associated with type I diabetes. Nat Genet. 2004;36:337–338. doi: 10.1038/ng1323. [DOI] [PubMed] [Google Scholar]
- 24.Begovich AB, Carlton VE, Honigberg LA, Schrodi SJ, Chokkalingam AP, Alexander HC, Ardlie KG, Huang Q, Smith AM, Spoerke JM, Conn MT, Chang M, Chang SY, Saiki RK, Catanese JJ, Leong DU, Garcia VE, McAllister LB, Jeffery DA, Lee AT, Batliwalla F, Remmers E, Criswell LA, Seldin MF, Kastner DL, Amos CI, Sninsky JJ, Gregersen PK. A missense single-nucleotide polymorphism in a gene encoding a protein tyrosine phosphatase (PTPN22) is associated with rheumatoid arthritis. Am J Hum Genet. 2004;75:330–337. doi: 10.1086/422827. [DOI] [PMC free article] [PubMed] [Google Scholar]
- 25.Bottini N, Vang T, Cucca F, Mustelin T. Role of PTPN22 in type 1 diabetes and other autoimmune diseases. Semin Immunol. 2006;18:207–213. doi: 10.1016/j.smim.2006.03.008. [DOI] [PubMed] [Google Scholar]
- 26.Lee YH, Rho YH, Choi SJ, Ji JD, Song GG, Nath SK, Harley JB. The PTPN22 C1858T functional polymorphism and autoimmune diseases: a meta-analysis. Rheumatology (Oxford, U K) 2007;46:49–56. doi: 10.1093/rheumatology/kel170. [DOI] [PubMed] [Google Scholar]
- 27.Vang T, Congia M, Macis MD, Musumeci L, Orru V, Zavattari P, Nika K, Tautz L, Tasken K, Cucca F, Mustelin T, Bottini N. Autoimmune-associated lymphoid tyrosine phosphatase is a gain-of-function variant. Nat Genet. 2005;37:1317–1319. doi: 10.1038/ng1673. [DOI] [PubMed] [Google Scholar]
- 28.Rieck M, Arechiga A, Onengut-Gumuscu S, Greenbaum C, Concannon P, Buckner JH. Genetic variation in PTPN22 corresponds to altered function of T and B lymphocytes. J Immunol. 2007;179:4704–4710. doi: 10.4049/jimmunol.179.7.4704. [DOI] [PubMed] [Google Scholar]
- 29.Wilkinson B, Downey JS, Rudd CE. T-cell signalling and immune system disorders. Expert Rev Mol Med. 2005;7:1–29. doi: 10.1017/S1462399405010264. [DOI] [PubMed] [Google Scholar]
- 30.Salojin KV, Zhang J, Madrenas J, Delovitch TL. T-cell anergy and altered T-cell receptor signaling: effects on autoimmune disease. Immunol Today. 1998;19:468–473. doi: 10.1016/s0167-5699(98)01326-7. [DOI] [PubMed] [Google Scholar]
- 31.Sakaguchi N, Takahashi T, Hata H, Nomura T, Tagami T, Yamazaki S, Sakihama T, Matsutani T, Negishi I, Nakatsuru S, Sakaguchi S. Altered thymic T-cell selection due to a mutation of the ZAP-70 gene causes autoimmune arthritis in mice. Nature. 2003;426:454–460. doi: 10.1038/nature02119. [DOI] [PubMed] [Google Scholar]
- 32.Siggs OM, Miosge LA, Yates AL, Kucharska EM, Sheahan D, Brdicka T, Weiss A, Liston A, Goodnow CC. Opposing functions of the T cell receptor kinase ZAP-70 in immunity and tolerance differentially titrate in response to nucleotide substitutions. Immunity. 2007;27:912–926. doi: 10.1016/j.immuni.2007.11.013. [DOI] [PMC free article] [PubMed] [Google Scholar]
- 33.Buchs AE, Rapoport MJ. T cell signaling and autoimmune diabetes. J Pediatr Endocrinol Metab. 2000;13:1549–1554. doi: 10.1515/jpem.2000.13.9.1549. [DOI] [PubMed] [Google Scholar]
- 34.Wing K, Sakaguchi S. Regulatory T cells exert checks and balances on self tolerance and autoimmunity. Nat Immunol. 2010;11:7–13. doi: 10.1038/ni.1818. [DOI] [PubMed] [Google Scholar]
- 35.Yamanouchi J, Rainbow D, Serra P, Howlett S, Hunter K, Garner VE, Gonzalez-Munoz A, Clark J, Veijola R, Cubbon R, Chen SL, Rosa R, Cumiskey AM, Serreze DV, Gregory S, Rogers J, Lyons PA, Healy B, Smink LJ, Todd JA, Peterson LB, Wicker LS, Santamaria P. Interleukin-2 gene variation impairs regulatory T cell function and causes autoimmunity. Nat Genet. 2007;39:329–337. doi: 10.1038/ng1958. [DOI] [PMC free article] [PubMed] [Google Scholar]
- 36.Tang Q, Adams JY, Penaranda C, Melli K, Piaggio E, Sgouroudis E, Piccirillo CA, Salomon BL, Bluestone JA. Central role of defective interleukin-2 production in the triggering of islet autoimmune destruction. Immunity. 2008;28:687–697. doi: 10.1016/j.immuni.2008.03.016. [DOI] [PMC free article] [PubMed] [Google Scholar]
- 37.Grinberg-Bleyer Y, Baeyens A, You S, Elhage R, Fourcade G, Gregoire S, Cagnard N, Carpentier W, Tang Q, Bluestone J, Chatenoud L, Klatzmann D, Salomon BL, Piaggio E. IL-2 reverses established type 1 diabetes in NOD mice by a local effect on pancreatic regulatory T cells. J Exp Med. 2010;207:1871–1878. doi: 10.1084/jem.20100209. [DOI] [PMC free article] [PubMed] [Google Scholar]
- 38.Chatenoud L. CD3 antibody treatment stimulates the functional capability of regulatory T cells. Novartis Found Symp. 2003;252:279–286. discussion 286–290. [PubMed] [Google Scholar]
- 39.Orru V, Tsai SJ, Rueda B, Fiorillo E, Stanford SM, Dasgupta J, Hartiala J, Zhao L, Ortego-Centeno N, D’Alfonso S, Arnett FC, Wu H, Gonzalez-Gay MA, Tsao BP, Pons-Estel B, Alarcon-Riquelme ME, He Y, Zhang ZY, Allayee H, Chen XS, Martin J, Bottini N. A loss-of-function variant of PTPN22 is associated with reduced risk of systemic lupus erythematosus. Hum Mol Genet. 2009;18:569–579. doi: 10.1093/hmg/ddn363. [DOI] [PMC free article] [PubMed] [Google Scholar]
- 40.Rodriguez-Rodriguez L, Wan Taib WR, Topless R, Steer S, Gonzalez-Escribano MF, Balsa A, Pascual-Salcedo D, Gonzalez-Gay MA, Raya E, Fernandez-Gutierrez B, Gonzalez-Alvaro I, Bottini N, Witte T, Viken MK, Coenen MJ, van Riel PL, Franke B, den Heijer M, Radstake TR, Wordsworth P, Lie BA, Merriman TR, Martin J. The PTPN22 R263Q polymorphism is a risk factor for rheumatoid arthritis in caucasian case-control samples. Arthritis Rheum. 2011;63:365–372. doi: 10.1002/art.30145. [DOI] [PubMed] [Google Scholar]
- 41.Xie Y, Liu Y, Gong G, Rinderspacher A, Deng SX, Smith DH, Toebben U, Tzilianos E, Branden L, Vidovic D, Chung C, Schurer S, Tautz L, Landry DW. Discovery of a novel submicromolar inhibitor of the lymphoid specific tyrosine phosphatase. Bioorg Med Chem Lett. 2008;18:2840–2844. doi: 10.1016/j.bmcl.2008.03.079. [DOI] [PMC free article] [PubMed] [Google Scholar]
- 42.Krishnamurthy D, Karver MR, Fiorillo E, Orru V, Stanford SM, Bottini N, Barrios AM. Gold(I)-mediated inhibition of protein tyrosine phosphatases: a detailed in vitro and cellular study. J Med Chem. 2008;51:4790–4795. doi: 10.1021/jm800101w. [DOI] [PubMed] [Google Scholar]
- 43.Wu S, Bottini M, Rickert RC, Mustelin T, Tautz L. In silico screening for PTPN22 inhibitors: active hits from an inactive phosphatase conformation. ChemMedChem. 2009;4:440–444. doi: 10.1002/cmdc.200800375. [DOI] [PMC free article] [PubMed] [Google Scholar]
- 44.Clipstone NA, Crabtree GR. Identification of calcineurin as a key signalling enzyme in T-lymphocyte activation. Nature. 1992;357:695–697. doi: 10.1038/357695a0. [DOI] [PubMed] [Google Scholar]
- 45.Mustelin T, Alonso A, Bottini N, Huynh H, Rahmouni S, Nika K, Louis-dit-Sully C, Tautz L, Togo SH, Bruckner S, Mena-Duran AV, al-Khouri AM. Protein tyrosine phosphatases in T cell physiology. Mol Immunol. 2004;41:687–700. doi: 10.1016/j.molimm.2004.04.015. [DOI] [PubMed] [Google Scholar]
- 46.Weiss A, Stobo JD. Requirement for the coexpression of T3 and the T cell antigen receptor on a malignant human T cell line. J Exp Med. 1984;160:1284–1299. doi: 10.1084/jem.160.5.1284. [DOI] [PMC free article] [PubMed] [Google Scholar]
- 47.Zikherman J, Hermiston M, Steiner D, Hasegawa K, Chan A, Weiss A. PTPN22 deficiency cooperates with the CD45 E613R allele to break tolerance on a non-autoimmune background. J Immunol. 2009;182:4093–4106. doi: 10.4049/jimmunol.0803317. [DOI] [PMC free article] [PubMed] [Google Scholar]
- 48.Coan KE, Maltby DA, Burlingame AL, Shoichet BK. Promiscuous aggregate-based inhibitors promote enzyme unfolding. J Med Chem. 2009;52:2067–2075. doi: 10.1021/jm801605r. [DOI] [PMC free article] [PubMed] [Google Scholar]
- 49.Burke JE, Babakhani A, Gorfe AA, Kokotos G, Li S, Woods VL, Jr, McCammon JA, Dennis EA. Location of inhibitors bound to group IVA phospholipase A2 determined by molecular dynamics and deuterium exchange mass spectrometry. J Am Chem Soc. 2009;131:8083–8091. doi: 10.1021/ja900098y. [DOI] [PMC free article] [PubMed] [Google Scholar]
- 50.Guo XL, Shen K, Wang F, Lawrence DS, Zhang ZY. Probing the molecular basis for potent and selective protein-tyrosine phosphatase 1B inhibition. J Biol Chem. 2002;277:41014–41022. doi: 10.1074/jbc.M207347200. [DOI] [PubMed] [Google Scholar]
- 51.Begley MJ, Taylor GS, Brock MA, Ghosh P, Woods VL, Dixon JE. Molecular basis for substrate recognition by MTMR2, a myotubularin family phosphoinositide phosphatase. Proc Natl Acad Sci US A. 2006;103:927–932. doi: 10.1073/pnas.0510006103. [DOI] [PMC free article] [PubMed] [Google Scholar]
- 52.Hsu S, Kim Y, Li S, Durrant ES, Pace RM, Woods VL, Jr, Gentry MS. Structural insights into glucan phosphatase dynamics using amide hydrogen–deuterium exchange mass spectrometry. Biochemistry. 2009;48:9891–9902. doi: 10.1021/bi9008853. [DOI] [PMC free article] [PubMed] [Google Scholar]
- 53.Hamuro Y, Anand GS, Kim JS, Juliano C, Stranz DD, Taylor SS, Woods VL., Jr Mapping intersubunit interactions of the regulatory subunit (RIalpha) in the type I holoenzyme of protein kinase A by amide hydrogen/deuterium exchange mass spectrometry (DXMS) J Mol Biol. 2004;340:1185–1196. doi: 10.1016/j.jmb.2004.05.042. [DOI] [PubMed] [Google Scholar]
- 54.Tsai SJ, Sen U, Zhao L, Greenleaf WB, Dasgupta J, Fiorillo E, Orru V, Bottini N, Chen XS. Crystal structure of the human lymphoid tyrosine phosphatase catalytic domain: insights into redox regulation. Biochemistry. 2009;48:4838–4845. doi: 10.1021/bi900166y. [DOI] [PMC free article] [PubMed] [Google Scholar]
- 55.Mustelin T, Tautz L, Page R. Structure of the hematopoietic tyrosine phosphatase (HePTP) catalytic domain: structure of a KIM phosphatase with phosphate bound at the active site. J Mol Biol. 2005;354:150–163. doi: 10.1016/j.jmb.2005.09.049. [DOI] [PubMed] [Google Scholar]
- 56.Kholod N, Mustelin T. Novel vectors for co-expression of two proteins in E. Coli. BioTechniques. 2001;31:322–323. doi: 10.2144/01312st03. [DOI] [PubMed] [Google Scholar]
- 57.Copeland RA. Evaluation of Enzyme Inhibitors in Drug Discovery. Wiley-Interscience; Hoboken, NJ: 2005. [Google Scholar]
- 58.Jones G, Willett P. Docking small-molecule ligands into active sites. Curr Opin Biotechnol. 1995;6:652–656. doi: 10.1016/0958-1669(95)80107-3. [DOI] [PubMed] [Google Scholar]
- 59.Jones G, Willett P, Glen RC, Leach AR, Taylor R. Development and validation of a genetic algorithm for flexible docking. J Mol Biol. 1997;267:727–748. doi: 10.1006/jmbi.1996.0897. [DOI] [PubMed] [Google Scholar]
Associated Data
This section collects any data citations, data availability statements, or supplementary materials included in this article.