

Abstract
Objective
To examine the effects of communicating uncertainty regarding individualized colorectal cancer risk estimates, and to identify factors that influence these effects.
Methods
Two web-based experiments were conducted, in which adults aged 40 years and older were provided with hypothetical individualized colorectal cancer risk estimates differing in the extent and representation of expressed uncertainty. The uncertainty consisted of imprecision (otherwise known as “ambiguity”) of the risk estimates, and was communicated using different representations of confidence intervals. Experiment 1 (n=240) tested the effects of ambiguity (confidence interval vs. point estimate) and representational format (textual vs. visual) on cancer risk perceptions and worry. Potential effect modifiers including personality type (optimism), numeracy, and the information’s perceived credibility were examined, along with the influence of communicating uncertainty on responses to comparative risk information. Experiment 2 (n=135) tested enhanced representations of ambiguity that incorporated supplemental textual and visual depictions.
Results
Communicating uncertainty led to heightened cancer-related worry in participants, exemplifying the phenomenon of “ambiguity aversion.” This effect was moderated by representational format and dispositional optimism; textual (vs. visual) format and low (vs. high) optimism were associated with greater ambiguity aversion. However, when enhanced representations were used to communicate uncertainty, textual and visual formats showed similar effects. Both the communication of uncertainty and use of the visual format diminished the influence of comparative risk information on risk perceptions.
Conclusions
The communication of uncertainty regarding cancer risk estimates has complex effects, which include heightening cancer-related worry—consistent with ambiguity aversion—and diminishing the influence of comparative risk information on risk perceptions. These responses are influenced by representational format and personality type, and the influence of format appears to be modifiable and content-dependent.
Introduction
Disease risk prediction models have grown in visibility and importance in recent years, as their number has increased and their use has expanded beyond the domain of research.1, 2 Risk prediction models for several diseases are now being made available not only to health professionals but to patients in clinical settings and laypersons on the Internet, in efforts to facilitate individualized and informed medical decision making and to educate the public.3, 4 This expanding use is promising, but also raises important concerns, since the optimal methods and outcomes of communicating individualized disease risk information have yet to be defined. A critical issue in this regard is the communication of the uncertainty associated with all risk estimates and arising from several sources, including methodological limitations5, 6 and theoretical difficulties in applying aggregate-level risk information to the individual case.7 These uncertainties can be expressed in different ways—e.g., quantitatively, using confidence intervals—and are important to communicate, given the need for patients to understand the limitations of available information in order to make informed choices. Yet these uncertainties are often not communicated and are poorly understood by laypersons and patients.8–10
The communication of uncertainty is also problematic because it may have undesirable effects. Past research has shown that the communication of uncertainty about the reliability, credibility or adequacy of risk information—a type of uncertainty that decision theorists have termed “ambiguity”11—leads to various outcomes, including heightened risk perceptions and negative affective responses (e.g., worry, distress) related to choice outcomes, and avoidance of decision making in situations involving choice.10, 12–14 This phenomenon, known as “ambiguity aversion,” has been demonstrated in various risk communication domains; for example, the communication of ambiguity regarding disease risk estimates has been shown to increase risk perceptions.15–18
Yet ambiguity aversion is not a universal phenomenon. For a significant minority of people, the communication of ambiguity may either have no effect, or lead to diminished rather than heightened risk perceptions and greater rather than less engagement in decision making.13, 19 The reasons for these differences, however, have only begun to be elucidated. In an initial qualitative study of laypersons’ responses to imprecision in colorectal cancer risk estimates from a recently developed statistical model,9, 20, 21 we identified dispositional optimism, an individual personality factor, as a potential moderating variable having the effect of diminishing ambiguity aversion (Figure 1). We also identified the perceived credibility of risk estimates as a potential mediator of the effect of ambiguity on risk perceptions and worry.9
Figure 1.

Theoretical model of ambiguity aversion from initial qualitative study.
Yet ambiguity aversion may also be influenced by various other factors, including numeracy—people’s ability to understand and use numbers22—and the way in which ambiguity is communicated. For example, representing risk visually vs. textually may heighten risk perceptions and affective responses to risk information,23–28 possibly by drawing attention to specific aspects of risk information25, 28 or directly evoking affective responses.27 Visual representations may similarly alter responses to ambiguity, although the few studies exploring the visual communication of uncertainty have not examined its effects on ambiguity aversion.26, 29–31 Furthermore, communicating uncertainty and ambiguity may influence responses to other important types of risk information. For example, estimates of comparative risk—relative to the population average—are often communicated to help people contextualize risks.20, 32, 33 However, such information can bias people’s responses—e.g., causing people with low absolute risks to be unduly alarmed if their risks are higher than average.34 An important unexplored question is whether such responses might be influenced by communicating uncertainty.
In this paper we report the findings of two web-based experiments aimed at exploring the potential effects of communicating uncertainty and the factors that influence these effects. Focusing on ambiguity manifest by imprecision in estimates of individualized colorectal cancer risk, we sought to test the following hypotheses suggested by past work:
Communicating uncertainty leads to ambiguity aversion, manifest by heightened risk perceptions and worry.
The effect of communicating uncertainty on risk perceptions and worry is moderated by dispositional optimism, numeracy, and representational format; lower dispositional optimism and numeracy and the use of visual representations are associated with greater ambiguity aversion.
The effect of communicating uncertainty is mediated by the perceived credibility of the risk estimate.
Our study also aimed to explore 1) the effect of communicating uncertainty on people’s responses to comparative risk information, and 2) the effect of novel visual and textual representations of uncertainty.
Methods
The study consisted of two experiments conducted using an interactive web-based survey. Experiment 1 tested our three hypotheses regarding the presence of ambiguity aversion and its moderating and mediating factors, and also explored the influence of comparative risk information. Experiment 2 was designed to compare the effects of different textual and visual representations of ambiguity.
Study population and participants
Experiment 1 was conducted in November 2008, and Experiment 2 was conducted in March 2009. Participants in both experiments were drawn from a professionally-managed web survey panel maintained by Keynote Systems, Inc., and had experience and interest in completing online surveys both related and unrelated to health. Participants receive compensation in the form of “points” from the panel administrator, which can be accumulated and used for online purchases with select vendors. Eligibility criteria for the current study included age ≥40 years and no prior history of colon cancer. Participants were recruited by email invitation, and those who agreed and met eligibility criteria were randomly assigned to a single study condition, and emailed a link to a web-based survey corresponding to the experimental condition. We pre-specified a target sociodemographic mix of equal men and women and varying race/ethnicity (≥15% non-white/Caucasian) and education level (≥30% high school diploma or less) in each experimental condition; no other randomization procedures were utilized. Recruitment continued until target sample sizes and sociodemographic parameters were reached. The samples for each experiment were drawn separately and were independent of one another; panelists who participated in the first experiment were not eligible and not invited to participate in the second.
Study design
After accessing the survey website, all participants were briefed on the NCI Colorectal Cancer Risk Assessment Tool,21 describing how the tool is simple to use and calculates a person’s lifetime risk of colorectal cancer based on questions about lifestyle and medical and family history. Participants in each experiment were then asked to imagine they used the tool and received results that were then displayed, corresponding to their assigned experimental group, and then completed the measures described below. We utilized hypothetical rather than subjects’ actual colorectal risk cancer estimates, given the lack of knowledge of the potentially adverse effects of doing so, which motivated the current study.
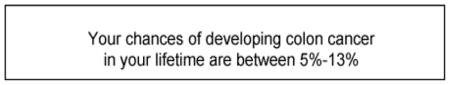
Experiment 1 utilized a 2 × 2 × 2 experimental design (Figure 2A) in which ambiguity and representational format were varied between subjects, and the provision of comparative risk information was varied within subjects. The between-subject ambiguity conditions were “absent” and “present,” and were operationalized by communicating a hypothetical colorectal cancer risk estimate as either a point estimate (“Your chances of developing colon cancer in your lifetime are 9%”) or a range (“Your chances of developing colon cancer in your lifetime are between 5%–13%”), respectively. The between-subject representational format conditions were textual and visual; the visual representations of the risk estimates consisted of horizontal bar graphs, shown in Appendix 1. These particular estimates and representational formats resembled those used in our previous qualitative study9, 20; the visual displays utilized bar graphs with solid borders to depict point estimates and confidence intervals. Following presentation of the individualized risk estimate, participants completed measures (described below) of perceived colon cancer risk and worry, and the perceived credibility of the risk information.
Figure 2.

Participant assignment in experiments.
A. Experiment 1: 2 × 2 × 2 design testing effects of ambiguity (absent vs. present), representational format (textual vs. visual), and provision of comparative risk information (pre- and post-).
B. Experiment 2: 3-condition design testing effects of alternative representations of uncertainty.
Next, we provided all participants with comparative risk information consisting of the population average estimate: “The average person’s lifetime chances of developing colon cancer are 6%.” For the high ambiguity condition, the average risk was represented in terms of a range, “2%–10%.” Notably, the individual’s hypothetical estimates were higher than these population average estimates. This information was represented either textually or graphically and disclosed only after provision of the individual risk estimate, thus yielding 2 within-subjects conditions (to which all participants were exposed): pre-and post-comparative risk information. Participants then completed the perceived risk worry, and credibility measures, along with additional measures of dispositional optimism and numeracy. These latter two measures were administered at the end of survey after all other items, in order to minimize any priming influence on participants’ responses to the risk information; the inverse influence of risk information on responses to the dispositional optimism and numeracy measures is less likely given that the latter measures reliably ascertain a theoretically stable individual personality trait and ability, respectively.
Experiment 2 utilized a 3-group experimental design (Figure 2B) in which newly-developed, enhanced textual and visual representational formats to communicate ambiguity were varied between subjects, with 3 conditions testing these representations alone and in combination: 1) text-only; 2) integrated text + solid bar graph range; and 3) integrated text + blurred bar graph range (Appendix 2). We did not test a visual-only condition given our interest in evaluating formats that would likely be used in real-world applications.
The enhanced textual representation aimed at more explicitly emphasizing and describing the meaning of imprecision and uncertainty in risk predictions, while the enhanced visual representation depicted a confidence interval using a bar graph, but adding blurred edges to reinforce the presence of ambiguity and the concept that probability distributions lack firm, categorical boundaries. We chose these new representations after conducting extensive cognitive testing of alternative designs, including animated dynamic displays of imprecision using bar graphs and icon arrays, with 9 volunteer laypersons residing in the greater Washington, D.C. metropolitan area. These participants were recruited through a local professional recruitment firm using a database of potential research participants in the area. Participants were aged 40 and older; had no personal history of colon cancer; used the Internet for more than 2 hours a week for purposes other than to check email; used a personal computer to respond to an online survey in the past 6 months; had never been employed in the medical advertising, computer, Internet, statistical, or mathematical fields; and had a high school or greater education level. We used participants’ feedback to select the textual and visual formats that best conveyed the concept of ambiguity. As in the first experiment, participants were shown the textual +/− visual representation to which they were randomized, and then completed measures of perceived colon cancer risk and worry, perceived credibility of the risk information, and dispositional optimism and numeracy; the latter two measures again represented the final items of the survey.
Measures
Perceived cancer risk was measured using 2 items (α=.723). The first item was adapted from the Health Information National Trends Survey (HINTS) administered by the National Cancer Institute, and read, “Based on these results from the computer program, how would you describe your chances of developing colon cancer in your lifetime? Would you say your chances of getting colon cancer are:” A 5-point Likert response scale was used, with the end-points labeled “Very Low” and “Very High.” The second item was adapted from Cameron et al35 and read, “If I received these results, I would feel that I’m going to get colon cancer.” A 5-point Likert response scale was used, with the end-points labeled “Strongly Disagree” and “Strongly Agree.” Responses to these 2 items were averaged.
Cancer-related worry was measured using a single item adapted from the HINTS, “If you received these results, to what extent would you feel worried about developing colon cancer?” A 5-point Likert response scale was used, with the end-points labeled “Not at all” and “Extremely.”
Perceived credibility of risk information was measured by 2 items (α=.862) developed by our team: 1) “How accurate do these results seem to you?” and 2) “How much would you trust the results of a computer program like this?” 5-point Likert response scales were used for both items, with their respective end-points labeled “Not at all accurate” and “Very accurate,” and “Not at all” and “Completely.” Responses to these 2 items were averaged.
Dispositional optimism was measured using the 3-item Optimism subscale (α=.887) of the Life Orientation Test,36 which consists of items such as, “In uncertain times, I usually expect the best.” A 5-point Likert response scale was used, with responses ranging from “Strongly disagree” to “Strongly agree.” Responses to these 3 items were averaged.
Numeracy was measured using the 3-item scale developed by Schwartz and Woloshin.37 Scale items assessed computational skills, e.g., “In the BIG BUCKS LOTTERY, the chance of winning a $10 prize is 1%. What is your best guess about how many people would win a $10 prize if 1000 people each buy a single ticket to BIG BUCKS?” The number of correct responses was tabulated to create a summary score.
Statistical analysis
In Experiment 1, we conducted multivariate analyses of variance (MANOVA) to assess the extent of ambiguity aversion and to identify potential moderating and mediating factors. Perceived cancer risk and cancer-related worry (ascertained prior to provision of comparative risk information) were the dependent measures, and ambiguity and representational format were between-subjects factors. Dispositional optimism and numeracy were included as cofactors in the model in order to assess their main effects and any interactions that would suggest a moderating effect on ambiguity aversion; because scores of each factor were highly skewed, and to aid in interpretability, these variables were dichotomized by median split. A separate ANOVA was conducted with perceived credibility as the dependent measure, to test its potential mediating role; if the analyses showed a significant association between ambiguity and perceived credibility (the hypothesized mediator), we planned to further assess for mediation using the method of Baron and Kenny.38
To assess how the communication of ambiguity influences the effect of comparative cancer risk information, we used repeated measures MANOVA, with perceived cancer risk and cancer-related worry as the dependent measures, ambiguity and representational format as between-subjects factors, and comparative risk information as the within-subjects factor.
In Experiment 2, one-way multivariate analyses of variance (MANOVA) were conducted, with perceived cancer risk and cancer-related worry as the dependent measures, and representational format as the between-subjects factor. Dispositional optimism and numeracy were included as cofactors in the model.
Results
Sample characteristics
Experiment 1 had a total of 240 participants from all geographic regions of the U.S.. The mean age was 52 years (range 40–74), and nearly equal numbers of men and women were enrolled; approximately 10% identified themselves as non-white/Caucasian. The educational level of participants was unexpectedly skewed towards lower education; 74% reported a highest achieved level of high school diploma/GED or less. Numeracy scores ranged from 0–3 (M=1.3, Mdn=1); the proportion of respondents with 0, 1, 2, and 3 correct responses were 22.9%, 33.8%, 33.8%, and 9.6%, respectively. Thus, the sample was relatively low in numeracy. Experiment 2 had a total of 135 participants with a mean age of 54 years (range 40–74); approximately 8% identified themselves as non-white/Caucasian, and 26% were in the low education group. Numeracy scores ranged from 0–3 (M=1.4, Mdn=1); the proportion of respondents with 0, 1, 2, and 3 correct responses were 18.1%, 34.7%, 31.9%, and 15.3%, respectively (for all subsequent analyses, the numeracy variable was therefore dichotomized by median split into two categories: 0–1 vs. 2–3). There were no significant differences in sociodemographic characteristics between any of the experimental groups.
Ambiguity aversion: extent and effect modifiers
In Experiment 1, the primary MANOVA to assess the extent and potential moderators and mediators of ambiguity aversion showed a significant main effect of ambiguity (Wilks’ λ = .97, F(3, 230)=3.54, p=.03). Univariate ANOVAs for individual dependent variables revealed that the main effect of ambiguity emerged on cancer-related worry (F (1, 231)=5.19, p=.02); ambiguity was associated with higher worry, consistent with ambiguity aversion. However, there was no significant main effect of ambiguity on perceived risk. There were also no significant main effects of representational format, dispositional optimism, or numeracy on perceived risk or worry.
More importantly, there were significant interactions between ambiguity and representational format (Wilks’ λ = .96, F(2, 230)=4.52, p=.01), and between ambiguity and dispositional optimism (Wilks’ λ = .97, F(2, 230)=3.39, p=.04). The Ambiguity × Representational Format interaction was significant for both perceived cancer risk (F (1, 231)=9.08, p=.003) (Figure 3) and cancer-related worry (F (1, 231)=3.86, p=.05). The Ambiguity × Dispositional Optimism interaction was significant for cancer-related worry (F (1, 230)=6.79, p=.01) (Figure 4) and borderline significant for perceived cancer risk (F (1, 230)=3.31, p=.07). Use of the textual representational format and low dispositional optimism were each associated with ambiguity aversion (higher perceived risk and/or worry with the range than with the point estimate), whereas use of the visual representational format and high dispositional optimism were each associated with ambiguity tolerance (lower perceived risk and worry with the range than with the point estimate). The direction of the interaction was consistent with our hypotheses for dispositional optimism, but opposite to predictions for representational format in that we expected more ambiguity aversion in response to the visual representation. There was no significant interaction between ambiguity and numeracy, contrary to our hypothesis.
Figure 3.

Interaction of ambiguity and representational format on level of perceived risk.
Figure 4.

Interaction of ambiguity and dispositional optimism on cancer-related worry.
The ANOVA examining the relationship between ambiguity and the perceived credibility of the information showed no significant main effect, contrary to our hypothesis of a mediating effect of this variable on ambiguity aversion.
Effect of communicating ambiguity on responses to comparative risk information
The repeated measures MANOVA to assess responses to ambiguity following the provision of comparative cancer risk information showed between-subjects effects of ambiguity similar to those observed prior to the provision of comparative risk information, although they were stronger and their pattern was more consistent. Once again, there was a significant main effect for ambiguity (Wilks’ λ = .96, F(2, 227)=4.18, p=.02), and a significant interaction between ambiguity and dispositional optimism (Wilks’ λ = .95, F(2, 227)=6.37, p=.002), such that high optimism was associated with ambiguity tolerance. Furthermore, univariate ANOVAs assessing levels of the dependent variables following provision of comparative risk information showed a main effect not only on cancer-related worry (F (1, 229)=8.21, p=.005), but on perceived cancer risk (F (1, 229)=4.86, p=.03). The previously-observed Ambiguity × Dispositional Optimism interaction was likewise significant both for cancer-related worry (F (1, 229)=15.39, p<.001) and perceived cancer risk (F (1, 229)=6.83, p=.01).
Within subjects, there was a significant main effect of the provision of comparative risk information (Wilks’ λ = .85, F(2, 227)=19.90, p<.001), and a 3-way interaction among comparative risk information, ambiguity, and representational format (Wilks’ λ = .92, F(2, 227)=9.41, p<.001). Overall, the provision of comparative risk information itself was associated with a significant increase in perceived cancer risk (t = 6.66, p<.001). However, ambiguity and representational format each moderated this effect; to illustrate the direction and magnitude of the 3-way interaction we conducted ANOVAs on the change score, or difference in perceived risk before and after provision of comparative risk information. These showed a significant interaction between ambiguity and representational format (F (1, 232)=15.67, p<.001). Figure 5 illustrates that the increase in perceived risk following provision of comparative risk information was highest when a textual point estimate was used to represent individual risk, and relatively low when risk estimates were either communicated as a range, or represented visually. Post hoc tests showed that the change score for the textual point estimate differed significantly from the change scores of the three other conditions—which did not differ from each other. In other words, both the communication of ambiguity and the use of visual representational formats blunted the observed increase in perceived risk following the provision of comparative risk information.
Figure 5.

Change in perceived risk following provision of comparative risk information.
Responses to enhanced representational formats for communicating ambiguity
In Experiment 2, the primary MANOVA to assess differences in responses to the novel enhanced representational formats for communicating ambiguity revealed no significant main effects of representational format; respondents exposed to the text-only and integrated textual+visual representations did not significantly differ in their perceptions of risk or in cancer-related worry. There were no significant interactions with dispositional optimism or numeracy. Furthermore, there were no significant associations between representational format and the perceived credibility of the information, the hypothesized mediator.
Discussion
In this study we examined laypersons’ responses to the communication of uncertainty, focusing on ambiguity related to imprecision regarding individualized colorectal cancer risk estimates. We tested, using a real world disease problem and risk application prototype, the theory- and evidence-based hypothesis that communicating ambiguity would lead to ambiguity aversion, manifest as heightened perceptions of risk and cancer-related worry. We obtained findings that have several implications for risk communication research and for the development and use of disease risk prediction models for educational and clinical purposes.
First, the data suggest that communicating ambiguity regarding cancer risk estimates does lead to ambiguity aversion, although its effects appear to be more affective than cognitive, causing heightened cancer-related worry while having smaller and non-significant effects on risk perceptions. These effects, furthermore, do not appear to be mediated by the perceived credibility of the risk information, contrary to our hypotheses. Our findings also suggest that ambiguity aversion is a highly moderated phenomenon; specifically, optimism and the use of visual communication methods both reduce ambiguity aversion, while numeracy appears to have no significant influence. These moderating factors may account for the relatively small main effects observed in our study, as well as inconsistencies in the findings of previous studies,13, 18, 19, 39, 40 most of which have not accounted for moderators of ambiguity aversion.
These findings yield insights regarding the potential mechanisms of ambiguity aversion and tolerance. The moderating influence of optimism is consistent with evidence from our prior qualitative work9 and a study by Highhouse,41, and suggests the influence of personality characteristics in determining the extent to which people selectively attend to optimistic rather than pessimistic extremes in interpreting the meaning of a risk range. The other moderating influence of visual representational format, not previously reported in the literature, was opposite to our predictions and may also relate to the capacity of visual representations to focus people’s attention to specific aspects of risk information.25, 28 In the case of ambiguity, visual representations may differentially draw attention to the lower end of the risk range, enabling people to downplay the threat associated with the risk estimate. This may be particularly true among individuals who are temperamentally optimistic.
Yet the null results of the second experiment suggest that the differential effects of visual and textual representational formats may be modifiable and attributable to the content or amount of information provided. Enhancing the text-only representation to explicitly reinforce the conceptual meaning of imprecision diminished the differences in people’s responses to textual vs. visual representations of imprecision. This suggests that the critical determinant of these differential effects may not be the representational format per se, but rather the conceptual content or amount of information on ambiguity that different representations convey. Enhancing these informational aspects may enable textual representations to be as effective as visual representations at drawing attention to the lower end of the risk range. These explanations are speculative, however, given that we did not ascertain participants’ perceptions and understanding of ambiguity in response to different communication formats. For these reasons, we also cannot determine the true value of using newer visual representations such as those developed in our study, particularly for individuals with low literacy or numeracy—for whom visual means of communicating risk information may be particularly effective in improving understanding.23, 30
The other novel finding of our study was the moderating effect of both ambiguity and representational format on responses to comparative risk information. Both the communication of ambiguity and use of visual representational formats appear to “debias” people’s responses to comparative risk information, dampening the heightened risk perceptions that can occur even when people’s absolute risks are low.34 This finding has not been previously reported, and its mechanisms are not clear. It could conceivably reflect a demand effect resulting from our sequential presentation of comparative risk information. However, our finding of an overall within-subjects increase in perceived risk is consistent with previous studies of the effects of comparative risk information,34 and a demand effect would not explain the observed differences in risk perceptions between participants in the two ambiguity groups (present and absent). It remains to be shown whether these differences were due to the depiction of ambiguity regarding the individual’s risk estimate, the population average risk, or both, and whether the underlying cause relates to differential attention to or processing of particular elements of the information, heightened informational complexity and cognitive load, or other mechanism. Further research is also needed to determine whether the same effects would have been observed had the individual’s risk estimate been lower instead of higher than average. It is also not clear why we did not observe an additive effect of ambiguity and visual communication in dampening the response to comparative risk information (Figure 5); this may suggest the presence of other unmeasured effect modifiers that need to be identified.
Although these and other important questions remain regarding the effects of communicating ambiguity and the mechanisms of ambiguity aversion, our preliminary findings have several important practical implications. In the real world, risk communication efforts are complex and typically integrate multiple types and elements of information that are often communicated through multiple means, jointly or in sequence, and have a variety of interrelated effects. We have focused on only a few of these elements, means, and effects; however, our data suggest that communicating ambiguity visually not only reduces ambiguity aversion but judgmental biases in response to comparative risk information. Our data also suggest that enhancing and integrating textual representations of ambiguity do not increase, and may actually reduce ambiguity aversion.
However, efforts to communicate ambiguity ultimately need to be evaluated according to their effectiveness in enhancing patients’ understanding of the concept, and we did not assess this outcome in the current study. Other limitations also qualify our findings. First, our experiments used hypothetical risk information and ascertained participants’ anticipated—rather than “real”—perceptions in response to actual risk estimates; this limits the generalizability of our findings. Notably, however, this limitation also applies to much of the existing experimental research on health risk communication. Basing our experimental intervention on an existing disease risk calculator also enhanced its realism and supports the applicability of our findings for health communication efforts.
Our study sample also consisted of web survey panel members who may not be representative of the general population, and in our first experiment, lower education participants were disproportionately represented as a result of our efforts to oversample this group. This raises further questions about the generalizability of our findings and the comparability of results between our experiments; however, it is also notable that—contrary to predictions—we did not observe a significant interaction between numeracy and ambiguity aversion in either experiment. Our study may not have had sufficient power to detect this interaction; nevertheless, our data suggests that any potential moderating effect of education level or numeracy on responses to ambiguity is likely small. Further research is needed to confirm and determine the reasons for our findings.
We also did not examine the effects of communicating ambiguity at other levels of risk—particularly higher levels (>50%)—or ambiguity, although these conditions may influence people’s responses to ambiguity, and the factors that moderate or mediate these responses.13, 42 We also assessed a limited range of outcomes and outcome mediators, in relatively limited fashion. For cancer-related worry, we used a single-item measure, although the item was adapted from a widely-used national survey for which it also represented the sole cancer worry measure, and single-item measures of this construct have been shown to predict behavioral outcomes such as cancer screening.43, 44 However, we used a new and unvalidated measure for the construct of informational credibility, and this could account for our finding of no association between this hypothesized mediator and the communication of ambiguity. This null finding needs to be confirmed, and more research is needed to identify the factors that mediate ambiguity aversion.
In spite of these limitations, the current study provides important new insights about the effects, theoretical mechanisms, and practical implications of communicating ambiguity through different means. Ambiguity aversion is complex and likely moderated by numerous factors, including dispositional optimism and the method of communication. Different textual and visual methods evoke varying degrees of ambiguity aversion, and our study sheds initial light on the reasons. Our preliminary findings have practical value in characterizing the outcomes that can be anticipated when ambiguity is communicated, and in identifying communication strategies that might minimize ambiguity aversion and other judgmental biases that limit people’s understanding of risk and uncertainty. In the final analysis, it is this understanding that needs to be measured and improved in future research and health communication efforts.
Acknowledgments
Financial support for this study was provided by intramural research funds from the National Cancer Institute. We thank Barbara Barry and Erin Nomiyama for their assistance in programming and developing the visual representations tested in this study.
Appendix 1. Textual and visual representations used in Experiment 1
-
Textual representation, Ambiguity absent
-
Initial absolute risk estimate

-
With comparative risk estimate

-
-
Textual representation, Ambiguity present
-
Initial absolute risk estimate
-
With comparative risk estimate

-
-
Visual representation, Ambiguity absent
-
Initial absolute risk estimate

-
With comparative risk estimate

-
-
Visual representation, Ambiguity present
-
Initial absolute risk estimate

-
With comparative risk estimate

-
Appendix 2. Textual and visual representations used in Experiment 2
-
Textual only

-
Integrated textual and visual: solid bar

-
Integrated textual and visual: blurred bar

References
- 1.Freedman AN, Seminara D, Gail MH, et al. Cancer risk prediction models: a workshop on development, evaluation, and application. J Natl Cancer Inst. 2005 May 18;97(10):715–723. doi: 10.1093/jnci/dji128. [DOI] [PubMed] [Google Scholar]
- 2.National Cancer Institute. About risk communication models. 2007 http://riskfactor.cancer.gov/cancer_risk_prediction/about.html.
- 3.Colditz GA, Atwood KA, Emmons K, et al. Harvard report on cancer prevention volume 4: Harvard Cancer Risk Index. Risk Index Working Group, Harvard Center for Cancer Prevention. Cancer Causes Control. 2000 Jul;11(6):477–488. doi: 10.1023/a:1008984432272. [DOI] [PubMed] [Google Scholar]
- 4.Emmons KM, Koch-Weser S, Atwood K, Conboy L, Rudd R, Colditz G. A qualitative evaluation of the Harvard Cancer Risk Index. J Health Commun. 1999 Jul–Sep;4(3):181–193. doi: 10.1080/108107399126904. [DOI] [PubMed] [Google Scholar]
- 5.Claus EB. Risk models used to counsel women for breast and ovarian cancer: a guide for clinicians. Fam Cancer. 2001;1(3–4):197–206. doi: 10.1023/a:1021135807900. [DOI] [PubMed] [Google Scholar]
- 6.Gail MH, Costantino JP. Validating and improving models for projecting the absolute risk of breast cancer. J Natl Cancer Inst. 2001 Mar 7;93(5):334–335. doi: 10.1093/jnci/93.5.334. [DOI] [PubMed] [Google Scholar]
- 7.Gillies D. Philosophical Theories of Probability. London: Routledge; 2000. [Google Scholar]
- 8.Politi MC, Han PK, Col NF. Communicating the uncertainty of harms and benefits of medical interventions. Med Decis Making. 2007 Sep–Oct;27(5):681–695. doi: 10.1177/0272989X07307270. [DOI] [PubMed] [Google Scholar]
- 9.Han PK, Klein WM, Lehman TC, Massett H, Lee SC, Freedman AN. Laypersons’ responses to the communication of uncertainty regarding cancer risk estimates. Med Decis Making. 2009 May–Jun;29(3):391–403. doi: 10.1177/0272989X08327396. [DOI] [PMC free article] [PubMed] [Google Scholar]
- 10.Johnson BB, Slovic P. Presenting uncertainty in health risk assessment: initial studies of its effects on risk perception and trust. Risk Analysis. 1995;15(4):485–494. doi: 10.1111/j.1539-6924.1995.tb00341.x. [DOI] [PubMed] [Google Scholar]
- 11.Ellsberg D. Risk, ambiguity, and the Savage axioms. Quart J Econ. 1961;75:643–669. [Google Scholar]
- 12.Han PK, Moser RP, Klein WM. Perceived ambiguity about cancer prevention recommendations: relationship to perceptions of cancer preventability, risk, and worry. J Health Commun. 2006;11( Suppl 1):51–69. doi: 10.1080/10810730600637541. [DOI] [PMC free article] [PubMed] [Google Scholar]
- 13.Camerer C, Weber M. Recent developments in modeling preferences: uncertainty and ambiguity. Journal of Risk and Uncertainty. 1992;5:325–370. [Google Scholar]
- 14.Schapira MM, Nattinger AB, McHorney CA. Frequency or probability? A qualitative study of risk communication formats used in health care. Med Decis Making. 2001 Nov–Dec;21(6):459–467. doi: 10.1177/0272989X0102100604. [DOI] [PubMed] [Google Scholar]
- 15.Kuhn KM. Communicating uncertainty: framing effects on responses to vague probabilities. Organ Behav Hum Decis Process. 1997;71(1):55–83. [Google Scholar]
- 16.Kuhn KM, Budescu DV. The relative importance of probabilities, outcomes, and vagueness in hazard risk decisions. Organ Behav Hum Decis Process. 1996;68(3):301–317. [Google Scholar]
- 17.Viscusi WK, Magat WA, Huber J. Communication of ambiguous risk information. Theory and Decision. 1991;31:159–173. [Google Scholar]
- 18.Viscusi WK, Magat WA, Huber J. Smoking status and public responses to ambiguous scientific risk evidence. Southern Economic Journal. 1999;66(2):250–270. [Google Scholar]
- 19.Einhorn HJ, Hogarth RM. Decision making under ambiguity. Journal of Business. 1986;59(4):S225–S250. [Google Scholar]
- 20.Han PK, Lehman TC, Massett H, Lee SJ, Klein WM, Freedman AN. Conceptual problems in laypersons’ understanding of individualized cancer risk: a qualitative study. Health Expect. 2009 Mar;12(1):4–17. doi: 10.1111/j.1369-7625.2008.00524.x. [DOI] [PMC free article] [PubMed] [Google Scholar]
- 21.Freedman AN, Slattery ML, Ballard-Barbash R, et al. Colorectal cancer risk prediction tool for white men and women without known susceptibility. J Clin Oncol. 2009 Feb 10;27(5):686–693. doi: 10.1200/JCO.2008.17.4797. [DOI] [PMC free article] [PubMed] [Google Scholar]
- 22.Reyna VF, Nelson WL, Han PK, Dieckmann N. How numeracy influences risk reduction and medical decision making. Psychological Bulletin. 2009 doi: 10.1037/a0017327. In press. [DOI] [PMC free article] [PubMed] [Google Scholar]
- 23.Lipkus IM. Numeric, verbal, and visual formats of conveying health risks: suggested best practices and future recommendations. Med Decis Making. 2007 Sep–Oct;27(5):696–713. doi: 10.1177/0272989X07307271. [DOI] [PubMed] [Google Scholar]
- 24.Schirillo J, Stone E. The greater ability of graphical versus numerical displays to increase risk avoidance involves a common mechanism. Risk Analysis. 2005;25(3):555–566. doi: 10.1111/j.1539-6924.2005.00624.x. [DOI] [PubMed] [Google Scholar]
- 25.Stone E, Yates J, Parker A. Effects of numerical and graphical displays on professed risk-taking behavior. Journal of Experimental Psychology: Applied. 1997;3( 4):243–256. [Google Scholar]
- 26.Bostrom A, Anselin L, Farris J. Visualizing seismic risk and uncertainty: a review of related research. Ann N Y Acad Sci. 2008 Apr;1128:29–40. doi: 10.1196/annals.1399.005. [DOI] [PubMed] [Google Scholar]
- 27.Chua HF, Yates JF, Shah P. Risk avoidance: graphs versus numbers. Mem Cognit. 2006 Mar;34(2):399–410. doi: 10.3758/bf03193417. [DOI] [PubMed] [Google Scholar]
- 28.Stone E, Sieck W, Bull B, Yates JF, Parks S, Rush C. Foreground:background salience: explaining the effects of graphical displays on risk avoidance. Organ Behav Hum Decis Process. 2003;90:19–36. [Google Scholar]
- 29.Slavin D, Troy Tucker W, Ferson S. A frequency/consequence-based technique for visualizing and communicating uncertainty and perception of risk. Ann N Y Acad Sci. 2008 Apr;1128:63–77. doi: 10.1196/annals.1399.008. [DOI] [PubMed] [Google Scholar]
- 30.Ancker JS, Senathirajah Y, Kukafka R, Starren JB. Design features of graphs in health risk communication: a systematic review. J Am Med Inform Assoc. 2006 Nov–Dec;13(6):608–618. doi: 10.1197/jamia.M2115. [DOI] [PMC free article] [PubMed] [Google Scholar]
- 31.Ibrekk H, Morgan MG. Graphical communication of uncertain quantities to nontechnical people. Risk Analysis. 1987;7:519–529. [Google Scholar]
- 32.Klein WM. Objective standards are not enough: affective, self-evaluative, and behavioral responses to social comparison information. J Pers Soc Psychol. 1997;72:763–774. doi: 10.1037//0022-3514.72.4.763. [DOI] [PubMed] [Google Scholar]
- 33.Klein WM, Stefanek ME. Cancer risk elicitation and communication: lessons from the psychology of risk perception. CA Cancer J Clin. 2007 May–Jun;57(3):147–167. doi: 10.3322/canjclin.57.3.147. [DOI] [PubMed] [Google Scholar]
- 34.Fagerlin A, Zikmund-Fisher BJ, Ubel PA. “If I’m better than average, then I’m ok?” Comparative information influences beliefs about risk and benefits. Patient Educ Couns. 2007 Dec;69(1–3):140–144. doi: 10.1016/j.pec.2007.08.008. [DOI] [PMC free article] [PubMed] [Google Scholar]
- 35.Cameron LD, Sherman KA, Marteau TM, Brown PM. Impact of genetic risk information and type of disease on perceived risk, anticipated affect, and expected consequences of genetic tests. Health Psychol. 2009 May;28(3):307–316. doi: 10.1037/a0013947. [DOI] [PubMed] [Google Scholar]
- 36.Scheier MF, Carver CS, Bridges MW. Distinguishing optimism from neuroticism (and trait anxiety, self-mastery, and self-esteem): A re-evaluation of the Life Orientation Test. Journal of Personality and Social Psychology. 1994;67:1063–1078. doi: 10.1037//0022-3514.67.6.1063. [DOI] [PubMed] [Google Scholar]
- 37.Schwartz LM, Woloshin S, Black WC, Welch HG. The role of numeracy in understanding the benefit of screening mammography. Ann Intern Med. 1997 Dec 1;127(11):966–972. doi: 10.7326/0003-4819-127-11-199712010-00003. [DOI] [PubMed] [Google Scholar]
- 38.Baron RM, Kenny DA. The moderator-mediator variable distinction in social psychological research: conceptual, strategic, and statistical considerations. Journal of Personality and Social Psychology. 1986;51:1173–1182. doi: 10.1037//0022-3514.51.6.1173. [DOI] [PubMed] [Google Scholar]
- 39.Lipkus IM, Klein WM, Rimer BK. Communicating Breast Cancer Risks to Women Using Different Formats. Cancer Epidemiology, Biomarkers and Prevention. 2001 Aug;10(8):895–898. [PubMed] [Google Scholar]
- 40.Viscusi WK. Alarmist decisions with divergent risk information. The Economic Journal. 1997;107:1657–1670. [Google Scholar]
- 41.Highhouse S. A verbal protocol analysis of choice under ambiguity. J Economic Psychology. 1994;15:621–635. [Google Scholar]
- 42.Curley SP, Yates JF. The center and range of the probability interval as factors affecting ambiguity preferences. Organizational Behavior and Human Decision Processes. 1985;36:273–287. [Google Scholar]
- 43.Diefenbach MA, Miller SM, Daly MB. Specific worry about breast cancer predicts mammography use in women at risk for breast and ovarian cancer. Health Psychol. 1999 Sep;18(5):532–536. doi: 10.1037//0278-6133.18.5.532. [DOI] [PubMed] [Google Scholar]
- 44.Lipkus IM, Iden D, Terrenoire J, Feaganes JR. Relationships Among Breast Cancer Concern, Risk Perceptions, and Interest in Genetic Testing for Breast Cancer Susceptibility Among African-American Women with and Without a Family History of Breast Cancer. Cancer Epidemiol Biomarkers Prev. 1999 Jun;8(6):533–539. [PubMed] [Google Scholar]