

Abstract
This paper reports preparation of a highly crystalline nano hydroxyapatite (HA) coating on commercially pure titanium (Cp-Ti) using inductively coupled radio frequency (RF) plasma spray and their in vitro and in vivo biological response. HA coatings were prepared on Ti using normal and supersonic plasma nozzles at different plate powers and working distances. X-ray diffraction (XRD) and Fourier transformed infrared spectroscopic (FTIR) analysis show that the normal plasma nozzle lead to increased phase decomposition, high amorphous calcium phosphate (ACP) phase formation, and severe dehydroxylation of HA. In contrast, coatings prepared using supersonic nozzle retained the crystallinity and phase purity of HA due to relatively short exposure time of HA particles in the plasma. In addition, these coatings exhibited a microstructure that varied from porous and glassy structure at the coating-substrate interface to dense HA at the top surface. The microstructural analysis showed that the coating was made of multigrain HA particles of ~200 nm in size, which consisted of recrystallized HA grains in the size range of 15– 20 nm. Apart from the type of nozzle, working distance was also found to have a strong influence on the HA phase decomposition, while plate power had little influence. Depending on the plasma processing conditions, a coating thickness between 300 and 400 μm was achieved where the adhesive bond strengths were found to be between 4.8 MPa to 24 MPa. The cytotoxicity of HA coatings was examined by culturing human fetal osteoblast cells (hFOB) on coated surfaces. In vivo studies, using the cortical defect model in rat femur, evaluated the histological response of the HA coatings prepared with supersonic nozzle. After 2 weeks of implantation, osteoid formation was evident on the HA coated implant surface, which could indicate early implant- tissue integration in vivo.
Keywords: Nano HA coatings, Induction plasma spray, Mechanical properties, In vitro studies, Histology
1. Introduction
Long-term fixation of metallic implants in bony tissues is still a concern for load bearing implants. Because of poor osteoconductivity, metallic implants often get encapsulated by fibrous tissue, which prolong the healing time. To address these limitations, HA coating was developed as a surface modification technique to improve osteoconductivity of metallic implants. A variety of coating techniques have been used to coat metallic implants with HA [1, 2]. Among them, plasma spraying is the most widely used commercial technique due to its ease of operation, high deposition rate, low substrate temperature, and low cost. A relatively low substrate temperature during the coating process is especially advantageous, as the mechanical properties of the implant materials are not compromised due to plasma spraying. Radio frequency (RF) and direct current (DC) are the two main types of plasma used for HA coating [3–5]. Axial feeding of precursor sol/solution/particle, which reduces turbulence in the plasma, is an important advantage of RF induction plasma spray process [4]. The induction plasma spray is an electrode free system, which eliminates the risk of contamination from the electrodes and is advantageous especially for preparing high purity HA coatings.
Problems associated with conventional plasma sprayed HA coatings include decomposition of HA, amorphous calcium phosphate (ACP) formation, and cracking. Plasma sprayed HA coating typically contains tricalcium phosphates (TCP in α/β form), oxyhydroxyapatite (OHA), tetracalcium phosphate (TTCP), and calcium oxide (CaO) with different dissolution properties [1, 6–8]. Phases such as TTCP or CaO do not have any proven bioactivity and also dissolve faster than other calcium phosphate phases. Although partial dissolution of HA coating is necessary for intimate biological bonding, excessive dissolution can lead to an unstable implant-bone interface, which not only affect the bioactive fixation but also lead to coating disintegration [9]. Therefore, TTCP and CaO phases have to be minimized in the coating to improve bioactivity, stability, and implant life. ACP dissolves faster than its crystalline form and thus, adversely affects the bioactive fixation process [10, 11]. Although post deposition heat treatment can improve coatings crystallinity, the volume changes associated with amorphous to crystalline phase transformation can generate large stresses, leading to coating disintegration or delamination [12]. Moreover, during the post deposition heat treatment, the microcracks that are created during plasma spraying merge to form larger cracks that can result in mechanical degradation of HA coating [12]. Post deposition heat treatment might also degrade mechanical properties of metallic substrate.
The objective of present work is to create plasma sprayed HA coating with minimum phase decomposition and high crystallinity without compromising the adhesive bond strength. Previous studies on plasma sprayed HA coating generally reported the coating properties in terms of crystallinity [6–8], phase decomposition [13], dissolution properties [14] and mechanical properties [9]. Effects of precursor powder and substrate on coating properties have also been reported [15, 16]. This study investigates the role of different plasma nozzle design on coating properties of HA in terms of phase decomposition and ACP phase formation. A 30 kW inductively coupled RF plasma system equipped with either normal or a supersonic nozzle was used for HA coating preparation. Coatings were characterized for phase purity and crystallinity using X-ray diffraction and FTIR. To ensure adequate mechanical integrity, adhesive bond strength of the coatings was measured. In vitro bone cell-materials interactions were evaluated on the plasma sprayed HA coatings, prepared with supersonic nozzle, to understand the cytocompatibility. In vivo, performances of the similarly prepared HA coatings were assessed using an intramedullary defect model in rat femur.
2. Experimental Procedure
2.1 Coating preparation
Commercial grade 150 μm sized HA powder (Monsanto, USA) of was used to coat 2 mm thick commercially pure Ti substrate (Grade 2, President Titanium, MA, USA) of 99.7% purity. Prior to coating, Ti substrates were sandblasted, washed ultrasonically in de-ionized water, and then cleaned with acetone to remove any organic materials.
A 30 kW inductively coupled RF plasma spray system (Tekna Plasma Systems, Canada), equipped with an axial powder feeding system, was used for the HA coating preparation. Argon (Ar) was used to create the plasma. The gas flow rate was expressed as standard liters per minute (slpm). In this study, coatings were initially prepared at 25 kW and at 110 mm working distance using normal and supersonic plasma nozzles to understand the effect of nozzle design on coating properties. From now onwards, the HA coatings prepared with normal and supersonic nozzles will be called as NHA and SHA, respectively. Schematic diagram of these two nozzles are shown in Figure 1. At first, both NHA and SHA coatings were prepared and compared, and later on all of the coatings were prepared with only supersonic nozzle, as the SHA coatings showed better properties in terms of coating crystallinity and phase purity. To study the effects of plate power and working distances on coating properties, SHA coatings were prepared with three levels of plate power and working distances. Table 1 lists the plasma spray parameters used for SHA.
Figure 1.

Schematic of (a) normal and (b) supersonic plasma nozzle.
Table 1.
Experimental conditions
| Central gas flow rate (slpm) | 25 Ar |
| Sheath gas flow rate (slpm) | 60 Ar + 6 H2 |
| Carrier gas flow rate (slpm) | 10 Ar |
| Power (kW) | 22,25,28 |
| Working distance (mm) | 90, 110, 130 |
| Chamber Pressure (Psig) | 5 |
2.2 Coating microstructure, phase, and chemical analysis
Coated samples were mounted, sectioned, and polished for microstructural observation. Polished sections were then etched with a solution of hydrofluoric acid (49% by acidometry), nitric acid (15.8 N) and distilled water in a ratio of 1:2:25 to reveal coating microstructure. Microstructural characterization of the coatings was performed using a field emission scanning electron microscope (FEI 200F, FEI Inc., OR, USA).
Siemens D500 Krystalloflex X-ray diffractometer using Cu Kα radiation at 35 kV and 30 mA at room temperature was used to determine different phases in the coating with a Ni-filter over the 2θ range between 20° and 60°, at a step size of 0.02° and a count time of 0.5 sec per step. To identify the chemical groups present in the coating and its crystallinity, the coating was scraped off from the substrate and grounded for FTIR analysis. ATR-IR (Attenuated Total Reflection-Infra Red) spectra were recorded on a FTIR spectrometer (FTIR, Nicolet 6700, ThermoFisher, Madison, WI). Samples were placed on an ATR diamond crystal and spectra were obtained in the wave number ranging from 400 to 4000 cm−1.
2.3 Mechanical properties
The bond strength of the as sprayed HA coatings was evaluated using a standard tensile adhesion test (ASTM C633) set up, where 5 replicates were used. The counter Ti substrate was also sand blasted and attached to the surface of the HA coating using epoxy resin as an adhesive glue. After curing in an oven at 120 °C for 2 h, the fixtures were subjected to a tensile test at a constant cross head speed of 0.0013 cm/sec until failure. The adhesive bond strength was calculated as: failure load/sample area. The data were reported as mean ± standard deviation.
2.4 In vitro cell culture
All samples were sterilized by autoclaving at 121 °C for 20 min. Established human osteoblast cell line hFOB 1.19 (ATCC, Manassas, VA, USA) was used. Cells were seeded onto the samples placed in 24-well plates. The base medium for this cell line was a 1:1 mixture of Ham’s F12 Medium and Dulbecco’s Modified Eagle’s Medium (DMEM/F12, Sigma, St. Louis, MO, USA), with 2.5 mM L-glutamine (without phenol red). The medium was supplemented with 10% fetal bovine serum (HyClone, Logan, UT, USA) and 0.3 mg/ml G418 (Sigma, St. Louis, MO, USA). Cultures were maintained at 34 °C under an atmosphere of 5% CO2 as recommended by ATCC. Medium was changed every 2 days for the duration of the experiment. Samples for testing were removed from culture at 3 and 11 days of incubation. Samples were observed under FE-SEM for cell morphologies using our earlier established methods [2, 17, 18].
MTT (3-(4,5-dimethylthiazol-2-yl)-2,5-diphenyl tetrazolium bromide) assay was used to evaluate cell proliferation. The MTT (Sigma, St. Louis, MO, USA) solution of 5 mg/ml was prepared by dissolving MTT in sterile filtered PBS. 10% MTT solution was then added to each sample in 24-well plates. After 2 h of incubation, 1 ml of solubilization solution made up of 10% Triton X-100, 0.1N HCl and isopropanol was added to dissolve the formazan crystals. 100 μl of the resulting supernatant was transferred into a 96-well plate, and read by a plate reader at 570 nm. Statistical analysis was performed using Student’s t-test and p<0.05 was considered statistically significant. Triplicate samples were used in MTT assay experiments to insure reproducibility. Data are presented as mean ± standard deviation.
2.5 In vivo biocompatibility evaluation
In vivo biocompatibility of the SHA coating was determined by implanting in the cortical defect in rat femur. Uncoated Ti implants were used as control. Rectangular Ti implants (3 × 3 × 5 mm3) were coated with HA using supersonic nozzle at 25 kW plasma power and 110mm working distance. All implants were sterilized at 121 °C for 20 min prior to implantation. The rats were sacrificed after two weeks and the bone specimens with uncoated Ti control and HA coated Ti implants were retrieved. The samples were fixed in 10% buffered formalin solution for 60 h and dehydrated in graduated ethanol (70% for 30 min, 95% for 30 min, and 100% for 2 × 1h) series. After embedding samples in Spurr’s resin, each undecalcified implant block was sectioned perpendicular to the implant surface using a low speed diamond saw [19]. After polishing, the sections were stained by Goldner’s Massion Trichrome stain and observed under light microscope [Olympus BH-2, Olympus America Inc., NY, USA] [20].
3. Results
3.1 Phase and chemical analysis
Figure 2 shows the X-ray diffraction (XRD) patterns of the coatings prepared with normal (NHA) and supersonic plasma nozzles (SHA). HA phase (JCPDS # 09-0432) was identified as the major phase in both the coatings along with other minor phases, such as α-TCP (JCPDS # 09-0348), β-TCP (JCPDS # 09-0169), TTCP (JCPDS # 25-1137) and CaO (JCPDS # 82-1691). Phase decomposition in plasma sprayed HA coating is very common and has been reported by many researchers [6, 9, 13– 16]. Phase decomposition was predominant for NHA coating compared to SHA coating. Presence of TTCP and CaO in the NHA coating indicated the extensive phase decomposition of HA. No TTCP or CaO phases were found in SHA coatings, though they were present in NHA coatings. At the same plasma processing conditions, the overall intensity of HA peaks dropped significantly for NHA coating compared to the SHA coating. The amorphous hump around 2θ = 32o also became obvious in the XRD pattern of NHA coating. The lower peak intensity and the broad hump signified lower crystallinity in NHA coating.
Figure 2.

X-ray diffraction spectra of HA coatings prepared at 25 kW and 110mm working distance with different plasma nozzle.
Spectral changes accompanying HA during RF plasma spraying were evaluated using FTIR and the results are shown in Figure. 3. The spectral features between 970 and 1190 cm−1 corresponds to the antisymmetric (ν3) P-O stretching modes of ACP and HA phosphate groups whereas the symmetric stretching mode of P-O (ν1) appears at 960 cm−1. Bands in the 540 to 660 cm−1 region arise from the antisymmetric (ν4) P-O bending modes of the phosphate groups. The weak absorbance band at 870 cm−1 was identified as (ν2) of carbonate [21, 22]. The shape of the ν1, ν3 and ν4 bands showed distinctive change from broad contour in NHA, to a composite of split narrower bands for SHA coating. The broad and shallow ν4 band in the 540 to 660 cm−1 range become resolved in two distinct and sharp peaks which are the basic characteristics of crystalline HA [22]. The bands at 630 cm−1 and 3572 cm−1 in the SHA coating were identified as OH. The absence of these OH bands in NHA coating signified dehydroxylation of HA.
Figure 3.

FTIR of SHA and NHA coatings prepared at 25 kW at 110mm different working.
As the SHA coating showed better characteristics in terms of crystallinity and phase stability, further parametric study was done with SHA coatings only. The XRD pattern of SHA coatings prepared at different plate power is shown in Figure 4a. All the SHA coatings were found to have HA as the primary phase with small amounts of α-TCP and β-TCP. In addition, undesirable phases, such as CaO or TTCP, were not detected in the XRD pattern for any of the SHA coatings. Moreover, the ACP hump around 2θ; = 32o was insignificant and showed three distinct peaks which are characteristics of crystalline HA. These results indicate that plate power had no significant influence in this range on crystallinity and phase decomposition of HA during plasma spraying.
Figure 4.

X-ray diffraction spectra of SHA coatings (a) 110mm working distance (b) 28 kW plate power.
Figure 4b shows the XRD pattern of SHA coatings prepared at different working distances. The phase decomposition of HA to α-TCP and β-TCP was significantly high in the coatings made at 90 mm working distance. TTCP and α-TCP were the major phases in this SHA coating. In comparison, coatings prepared at 110 mm or 130 mm had HA as the primary phase with very little phase decomposition. In addition to phase decomposition, peak intensities were lower for coating prepared at 90 mm working distance, signifying poor crystallinity.
The FTIR spectra of SHA coatings prepared at 25 kW plate power with different working distances is shown in Figure 5. The peaks related to Ca-P and OH was identified. OH bands at 630 cm−1 and 3572 cm−1 were absent in the coatings prepared at 90 mm working distance, indicating prominent dehydroxylation of HA. The splitting of the antisymmetric (ν3) P-O band at 1040 and 1096 cm−1 also decreased for the coating prepared at 90 mm, indicating lower crystallinity of HA.
Figure 5.

FTIR of SHA coating prepared at 28 kW at different working distances (a) 90mm, (b) 110mm, (c) 130mm and (d) precursor.
3.2 Microstructural analysis
Figure 6 shows cross sectional microstructural features of SHA coating prepared at 25 kW with 110 mm working distance. The coating microstructure showed a coherent structure with no visible cracking. Zone (a) in Figure 6 shows the coating microstructure near the interface. Although some micro-pores can be noticed at the coating- substrate interface region, detailed microstructural study showed excellent interparticle bonding (zone (a)), signifying good mechanical integrity of the coating. The interface region consisted of diffused HA particles without prominent grain boundaries, which generally indicate some amorphicity in this region. As shown in zone (b) in Figure 6, the upper region of the coating comprised of distinct HA grains, symbolizing higher level of crystallinity. High magnification microstructural study revealed that each of the HA particles in the coating were composed of a large number of 15–20 nm sized HA grains. These HA nano grains were due to recrystallization of HA particles. A similar microstructure has been reported previously; however, with random scattering of HA nano particles [9].
Figure 6.
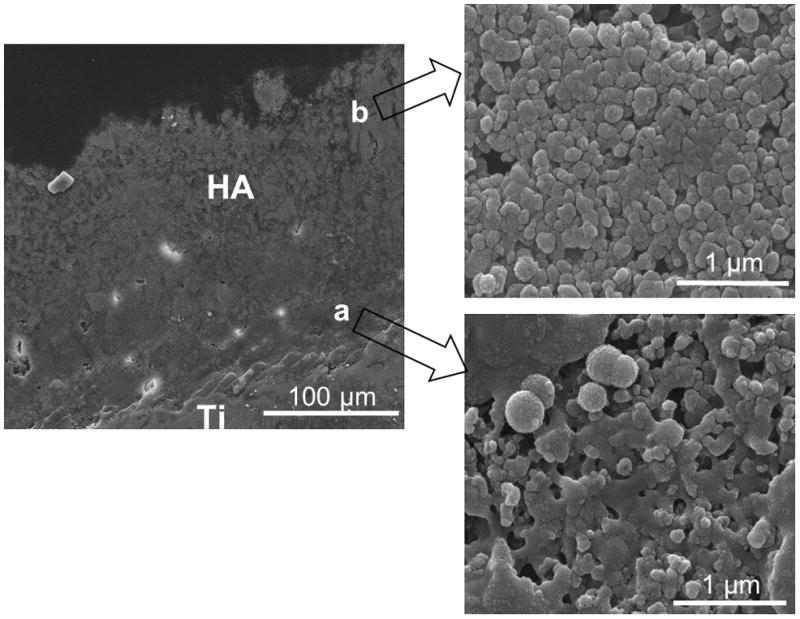
Cross sectional SEM micrographs of HA coating prepared at 25 kW with a working distance of 110mm.
3.3 Mechanical properties
Adhesive bond strength of the SHA coatings is summarized in Table 2. Depending on plasma processing conditions, adhesive bond strength varied from 4.8 MPa to 24 MPa, which were comparable to the referred literature values [12, 14, 15]. The bond strength was found to increase with increasing plate power, whereas it decreased with an increase in the working distance. The maximum adhesive bond strength of 24 MPa was achieved for samples prepared at 28 kW plate power with a working distance of 90 mm. After pull-off test, the fracture surfaces were digitally imaged in order to evaluate the failure modes and are shown in Figure 7. The failure modes were classified as adhesive (delamination at the coating substrate interface) and cohesive (delamination within the coating) failure. The coatings prepared at 28 kW and 130 mm working distance have a predominant cohesive failure, as shown in Figure 7c. At the same plasma power, the coating showed adhesive failure when prepared at 90 mm working distance (Figure 7a). A mixture of adhesive and cohesive failure mode was observed when coating was prepared at 28 kW and 110 mm working distance, as shown in Figure 7b.
Table 2.
Adhesive strength of SHA coatings
| Working distance (mm) | Plate power (kW) | ||
|---|---|---|---|
| 22 | 25 | 28 | |
| 130 | 4.8 ± 2.2 MPa | 5.47±1.93 MPa | 14.6±3.1 MPa |
| 110 | 9.7±3.1 MPa | 19.02±2.0 MPa | 20.78±2.8 MPa |
| 90 | 11.32±2.52 MPa | 19.92±4.4 MPa | 24.78±3.3 MPa |
Figure 7.

Images of the pull off area of SHA coatings prepared at 28kW (a) 90mm, (b) 110mm and (c) 130 mm (scale bar = 1cm).
3.4 In vitro and in vivo biological response
Initial attachment, growth and spreading of hFOB cells on Ti control and HA coating, prepared at 25 kW and 110mm working distance, were analyzed using FE-SEM. Figure 8 shows the morphology of hFOB cells on Ti control and HA coatings after 3 and 11 days of culture. As expected there were more hFOB cells attached to the surface of HA coatings compared to uncoated Ti. The cells on Ti surface exhibited few filopodia extensions indicating that they largely failed to attach and spread on control surface. Cells on HA coatings spread with more filopodia extensions, as shown in Figure 8, suggesting significantly better cell attachment. After 11 days of culture, cell spreading was evident on the surface of the HA coatings. Significantly higher number of cells could be observed compared to day 3. The hFOB cells also became confluent on HA coatings with spherical granules on the cell surfaces, which implies mineralization. Uncoated surface did not show good cell coverage and extracellular matrix (ECM) formation, even after 11 days of culture.
Figure 8.
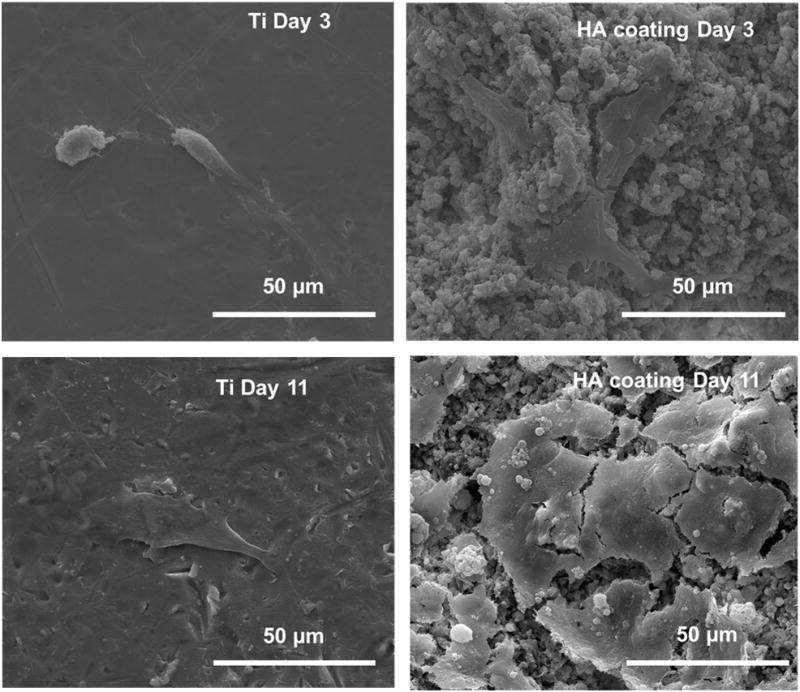
FE-SEM micrographs illustrating the hFOB cell morphologies after 3 and 11 days of culture.
The MTT assay was used to determine hFOB cell proliferation on HA coatings. Figure 9 shows the comparison of cell densities on uncoated Ti and HA coatings over the course of the experiment. As expected, significantly higher cell density was observed on HA coating surface compared to that observed on Ti control for all culture durations.
Figure 9.

MTT assay of hFOB cells observed on Ti and HA coating surfaces as a function of culture time ( P < 0.05, n = 3). A higher optical density represents higher concentration of living cells.
Histological evaluation at the bone-implant interface was performed at 2 weeks to evaluate the biocompatibility and new bone formation which is shown in Figure 10. During the experiments, all rats remained in good health and at harvesting, there were no clinical signs of inflammation or adverse tissue reaction around the implants. At 2 weeks of implantation, the region between the HA surface and old bone was found to be rich in collagen and mesenchymal cells which differentiate to osteoblast phenotype and form the nonmineralized bone, osteoid [23, 24]. The osteoid (red in color) formation was evident on HA coated surface (Figure 10a). Comparatively, few osteoblast precursor mesenchymal cells were found in the defect zone around the uncoated Ti implant. Moreover, osteoid formation was scarce on the surface of the control uncoated Ti implant surface.
Figure 10.
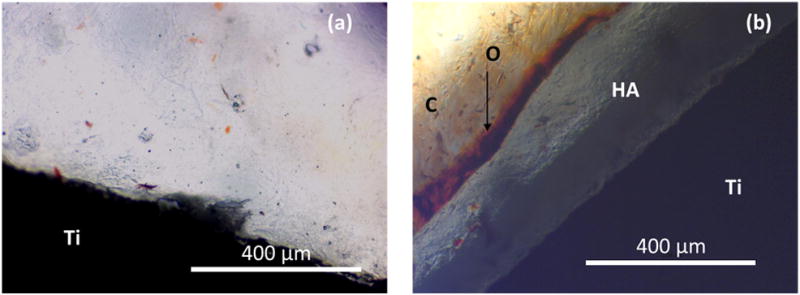
Optical photomicrograph of a longitudinal section of (a) Uncoated Ti and (b) HA coated Ti, implanted in rat femur at 2 weeks showing (O) nonmineralized osteoid, and (C) collagen matrix with Putative Mesenchymal Cells (Goldner’s Masson Trichrome stain).
4. Discussion
The temperature in RF plasma goes well above 10000 °C whereas the decomposition temperature of HA is 1670 °C. Therefore the phase decomposition of HA during plasma spraying is common [1]. The high temperature exposure partially or completely decomposes the HA particles depending on plasma parameters, as well as particle morphology and size [15]. Due to rapid cooling, plasma sprayed HA coatings generally contain some amount of ACP phases.
4.1. Influence of plasma nozzle
Supersonic plasma nozzle design is the main factor contributing to the phase stability of HA, and its high level of crystallinity. In supersonic nozzle, HA particles are introduced in the lower region of the plasma torch, as shown in Figure 1b. In contrast, HA particles are discharged at the upper central portion of plasma, where the temperature is maximum for normal plasma nozzle. Therefore, HA particles show higher degree of decomposition in coating prepared with normal plasma nozzle compared to supersonic nozzle. The specially designed supersonic plasma nozzle has a plasma exit velocity of 510m/s, much higher than that of normal plasma nozzle. Moreover, the travel distance is shorter for SHA since HA particles are discharged in the lower region. The shorter distance traveled at a higher speed makes the residence time for HA particle very small. Typical residence time of HA particles in plasma are 5 ms and 290 μs for normal and supersonic plasma nozzles, respectively. Therefore, in supersonic plasma nozzle, the available heat energy for phase decomposition is very small, which aids in HA phase stabilization.
To better understand crystallinity in the NHA and SHA coatings, we have used the FTIR analysis. The FTIR analysis also supports the higher amount of amorphous calcium phosphate formation in NHA coating. The absence of OH band at 630 cm−1 and 3572 cm−1 in NHA coating indicates extensive dehydroxylation of HA. The dehydroxylation of HA during plasma spray coating leads to lattice distortion and vacancies which makes it difficult for the atoms to reconstruct themselves into a crystalline structure [10, 11]. Therefore, dehydroxylated HA forms ACP phases in NHA coating. Formation of ACP phases can also be explained by the thermodynamics approach [10]. Free energy of formation for HA is larger than oxyapatite and hence, the nucleation barrier for crystallization is higher in oxyapatite, which results in ACP phase formation. Longer residence time of HA particles at higher temperature in NHA coating leads to dehydroxylation of HA, and promotes the ACP phase formation. Moreover, the less split and composite P-O bands with low transmittance also confirm the ACP phase formation in NHA coatings. The change in absorbance bands in the 900 to 1200 cm−1 range was used by Pleshko et al. to determine the crystallinity of HA, which showed that the sharp and high transmittance bands are associated with relatively higher crystalline HA phase [22]. Considering the fact that NHA and SHA coatings are characterized in similar manner, it can be said that the decrease in transmittance in FTIR spectra is directly related to crystallinity of the coating. The splitting of the broad antisymmetric (ν3) P-O bands, at 1040 and 1096 cm−1, in NHA coating decreases significantly, indicating a poorly crystalline HA phase. Both the XRD and FTIR analysis indicates that the highly crystalline and phase pure HA coatings can be prepared by using induction plasma spray equipped with supersonic nozzle. Therefore, the effect of plasma parameters on coating properties was studied for SHA coatings.
4.2. Effect of plate power and working distance
An increase in plate power also increases energy of the plasma that generates higher temperature. Therefore, the phase decomposition should increase with an increase in plate power as reported in literature [9, 13]. However, in our work, phase decomposition and ACP phase formation in the SHA coatings are not significantly affected by plate power in the range that we have tested. An increase in plate power increases the degree of ionization of the plasma gas, which results in higher temperature. Referring to Figure 1b, increase in degree of ionization (or temperature) is more pronounced at the center of the plasma, where the induction coils are positioned. However, the temperature in the lower region of the plasma does not increase significantly due to plate power increase. Since the probe discharges the HA particles in the lower region of the supersonic plasma nozzle where the temperature fluctuations are less, the effect of change in plate power on phase decomposition of HA is insignificant.
Although the phase decomposition and ACP phase formation is not significantly affected by plate power, the change in working distance has a pronounced effect on them. Increase in phase decomposition with decreasing working distance can be attributed to the prolonged plasma-HA interaction. The plasma coating is a layer by layer build up process, where the properties of the layers are controlled by the relative movement of the substrate- plasma head and the working distance. The HA particles interact with the plasma in the plasma nozzle, where they partially melt and get deposited on the Ti substrate. A plasma-HA second interaction arises at very short working distances (90 mm), where the plasma directly impinges on the coating surface. Due to a slow scanning rate, the plasma-HA second interaction is usually longer, which essentially melts the top surface of the coating, and forms undesirable phases such as TTCP and α-TCP. Moreover, the extended plasma-HA interaction removes the hydroxyl ions from the HA and enhances amorphous calcium phosphate phase formation. The absence of OH bands at 630 cm−1 and 3572 cm−1, also confirms the dehydroxylation of HA in the coating prepared at 90 mm working distance.
4.3. Microstructure of SHA coatings
The in vivo stability of a coated implant depends on physical and mechanical integrity of the coating. Although, certain amount of porosity is required to achieve good biological fixation, excessive porosity at the coating interface region as well as on the surface, can increase the dissolution rate, and thereby compromise the in vivo stability of an implant. Therefore, porosity with good inter-particle bonding is desired for long term stability of a coated implant. The dense coating formation can be attributed to the plasma spraying technique. In the SHA coating, the partially molten HA particles are forced at a high speed to the substrate, where they form the dense coating.
During the initial stage of the coating formation, the partially molten HA particles dissipate heat to the Ti and cool down at a higher rate. Therefore, the coating close to the substrate is mostly amorphous in nature. As the coating thickens with successive HA layers, partially molten HA particles lose their heat through HA layers, where lower thermal conductivity of HA (0.72– 2.16 W m−1 K−1) decreases the cooling rate than that of Ti (21.9 W m−1 K−1). Therefore, the upper region of the coating shows relatively higher amount of crystalline HA than near the substrate. The HA nano grains in the coating results from the newly recrystallized HA particles [9]. The recrystallization is less pronounced at the interface region, where most of the heat is transferred through the substrate.
4.4. Mechanical properties
The adhesive bond strength is one of the decisive factors for the in vivo application of HA coatings. Higher adhesive bond strength not only ensures long term stability of HA coating in vivo but also prevents osteolysis, a bone resorption process generally triggered by wear debris. HA coatings prepared at 90mm working distance have higher bond strength than coatings prepared at 110 or 130mm working distances. At smaller working distance, the partially molten HA particles remain molten up to the point of impact on the Ti surface where they form the glassy phase and bond to the Ti substrate [15]. Therefore the coating prepared at 28 kW and 90mm working distance show the highest adhesive bond strength. Fractographic analysis of the pull off area also indicates that at lower distance the coating is strongly bonded to the substrate as well as between the layers. The HA particles have higher velocity of impact when the working distance is smaller, thereby increasing the coating’s cohesive strength. As the working distances increases, HA particles travel higher distance before impact when it looses speed and temperature and that significantly decreases the interlayer cohesive strength. However, short working distance also increases amorphous calcium phosphate phase in the coating. Based on this study, we conclude that the HA coatings prepared at 25 kW-110mm, 28 kW-110mm and 28 kW-130mm have bond strength higher than the requirements of the standard for HA coated implants, i.e.,15 MPa (ISO 13779-2), while maintaining a high level of crystallinity and phase purity [25, 26].
4.5. In vitro and in vivo biological response
The hFOB cell-material interactions are characterized by cellular morphology and proliferation. Cells attach to the material surface by a variety of cellular micro-extensions, such as filopodia and lamelliopodia [26]. Our results show improvement in cell attachment and spreading on HA coated Ti compared to uncoated Ti, which is in line with previous studies [26, 27]. FE-SEM observation also reveals the presence of ECM on the HA coatings after 11 days of culture, an indication of cell differentiation [28]. This results show that the HA coatings not only promote better cell attachment and spreading, but also capable of producing a suitable matrix for mineralization [26]. The MTT assay and cellular morphology confirmed that HA coatings are not cytotoxic, and thus does not prevent cell proliferation.
For bone implant materials, it is critical to investigate the osteogeneic ability of the materials in vivo, using a standardized animal model. During the initial period of bone healing, the mesenchymal cells move into the inflamated site and differentiate into osteoblasts, which allow the osteoid formation. The presence of mesenchymal cells in abundance at the healing zone between the HA coated implant and the mature bone indicates the commencement of bone regeneration [23]. In our study, formation of osteoid on the HA coated implant surface confirms the cellular activity required for the new bone formation. These results are in accordance with earlier studies which show faster new bone formation on HA coated implants [29, 30]. Daugaard et al. demonstrated increased bone ongrowth on HA coatings compared to uncoated Ti [31]. The absence of such osteoid on the uncoated Ti surface indicates that the cellular activity has not been started even after 2 weeks of implantation.
Conclusions
The present study investigates the possible effects of plasma nozzle designs, plate power, and working distance on coating crystallinity, phase decomposition, and mechanical properties of plasma sprayed HA coatings. The HA coatings prepared with supersonic plasma nozzle was highly crystalline in nature with insignificant phase decomposition. Both the crystallinity and purity of HA decreased when sprayed with normal plasma nozzle (NHA). The SHA coating composition and crystallinity was not significantly influenced by the change in plate power. However, phase decomposition and loss in crystallinity was observed for SHA coatings prepared with low working distance. The microstructural analysis confirmed the presence of nano HA grains which were in the size of ~ 20 nm. SHA coatings, sprayed under different plasma parameters, had adhesive bond strength ranging from 4.8 MPa to 24 MPa. Based on phase purity, amorphicity, and adhesive bond strength, the optimized conditions for SHA coating preparation were 25 kW-110mm, 28 kW-110mm and 28 kW-130mm. In vitro studies indicated that the SHA coatings promoted hFOB cell attachment and proliferation. In vivo study with rat distal femur model showed the formation of osteoid on HA coated implant surface, which is an indication of early bone tissue-implant integration compared to uncoated Ti.
Acknowledgments
Authors acknowledge financial support from the National Institute of Health (N1H-RO1-EB-007351). The authors also like to acknowledge the financial support from the Office of Naval Research and the W. M. Keck Foundation to establish a Biomedical Materials Research Laboratory at WSU. The authors thank Dr. Christine Davitt and Dr. Valerie Lynch- Holm, of Franceschi Microscopy and Imaging Center, Washington State University, for their helpful assistance in the histology and FESEM analyses.
Footnotes
Publisher's Disclaimer: This is a PDF file of an unedited manuscript that has been accepted for publication. As a service to our customers we are providing this early version of the manuscript. The manuscript will undergo copyediting, typesetting, and review of the resulting proof before it is published in its final citable form. Please note that during the production process errors may be discovered which could affect the content, and all legal disclaimers that apply to the journal pertain.
References
- 1.Groot KD, Wolke JG, Jansen JA. Proc Inst Mech Eng H. 1998;212:137–147. doi: 10.1243/0954411981533917. [DOI] [PubMed] [Google Scholar]
- 2.Roy M, Krishna BV, Bandyopadhyay A, Bose S. Acta Biomater. 2008;4:324–333. doi: 10.1016/j.actbio.2007.09.008. [DOI] [PubMed] [Google Scholar]
- 3.Boulos MI. J Thermal Spray Technology. 1992;1:33–40. [Google Scholar]
- 4.Guo JY, Gitzhofer F, Boulos MI. Plasma Chem Plasma Process. 1997;1:219–249. [Google Scholar]
- 5.Ravi BG, Sampath S, Gambino R, Devi PS, Parise JB. J Thermal Spray Technology. 2006;15:701–707. [Google Scholar]
- 6.Berndt CC, Haddadt GN, Farmer AJD, Gross KA. Mater Forum. 1990;14:161–173. [Google Scholar]
- 7.Lucas LC, Lacefield WR, Ong JL, Whitehead RY. Colloids Surf A Physicochem Eng Asp. 1993;77:141–147. [Google Scholar]
- 8.Sun L, Berndt CC, Gross KA, Kucuk A. J Biomed Mater Res. 2001;58:570–592. doi: 10.1002/jbm.1056. [DOI] [PubMed] [Google Scholar]
- 9.Sun L, Berndt CC, Grey CP. Mater Sci Eng A Struct Mater. 2003;360:70–84. [Google Scholar]
- 10.Gross KA, Berndt CC, Herman H. J Biomed Mater Res. 1998;39:407–414. doi: 10.1002/(sici)1097-4636(19980305)39:3<407::aid-jbm9>3.0.co;2-n. [DOI] [PubMed] [Google Scholar]
- 11.Weng J, Li XD, Zhang XD. Biomaterials. 1995;16:39–44. doi: 10.1016/0142-9612(95)91094-f. [DOI] [PubMed] [Google Scholar]
- 12.Yang CW, Lui TS. Mater Trans. 2007;48:211–218. [Google Scholar]
- 13.Tsui YC, Doyle C, Clyne TW. Biomaterials. 1998;19:2015–2029. doi: 10.1016/s0142-9612(98)00103-3. [DOI] [PubMed] [Google Scholar]
- 14.Sun L, Berndt CC, Khor KA, Cheng HN, Gross KA. J Biomed Mater Res. 2002;62:228–236. doi: 10.1002/jbm.10315. [DOI] [PubMed] [Google Scholar]
- 15.Khor KA, Cheang P. J Mater Process Techno. 1997;63:271–276. [Google Scholar]
- 16.Guipont V, Espanol M, Borit F, Llorca-Isern N, Jeandin M, Khor KA, Cheang P. Mater Sci Eng A Struct Mater. 2002;325:9–18. [Google Scholar]
- 17.Roy M, Bandyopadhyay A, Bose S. Accepted in J Am Ceram Soc. 2010 June; [Google Scholar]
- 18.Roy M, Bandyopadhyay A, Bose S. J Am Ceram Soc. 2008;91:3517–3521. [Google Scholar]
- 19.Yang CY, Lee TM, Yang CW, Chen LR, Wu MC, Lui TS. J Biomed Mater Res. 2007;83A:263–271. doi: 10.1002/jbm.a.31246. [DOI] [PubMed] [Google Scholar]
- 20.Gruber HE. Biotech Histochem. 1992;67:30–34. doi: 10.3109/10520299209110002. [DOI] [PubMed] [Google Scholar]
- 21.Carden A, Morris MD. J Biomed Opt. 2000;5:259–268. doi: 10.1117/1.429994. [DOI] [PubMed] [Google Scholar]
- 22.Pleshko N, Boskey A, Mendelsohn R. Biophys J. 1991;60:786–793. doi: 10.1016/S0006-3495(91)82113-0. [DOI] [PMC free article] [PubMed] [Google Scholar]
- 23.Vögelin E, Jones NF, Huang JI, Brekke JH, Toth M. Tissue Eng. 2000;6:449–460. doi: 10.1089/107632700418155. [DOI] [PubMed] [Google Scholar]
- 24.Tonino A, Oosterbos C, Rahmy A, Therin M, Doyle C. J Bone Joint Surg. 2001;83A:817–825. [PubMed] [Google Scholar]
- 25.Narayanan R, Seshadri SK, Kwon TY, Kim KH. J Biomed Mater Res Part B Appl Biomater. 2008;85B:279–299. doi: 10.1002/jbm.b.30932. [DOI] [PubMed] [Google Scholar]
- 26.Xue W, Hosick HL, Bandyopadhyay A, Bose S, Ding C, Luk KDK, Cheung KMC, Lu WW. Surf Coat Technol. 2007;201:4685–4693. [Google Scholar]
- 27.Kweh SWK, Khor KA, Cheang P. Biomaterials. 2002;23:775–785. doi: 10.1016/s0142-9612(01)00183-1. [DOI] [PubMed] [Google Scholar]
- 28.Banerjee A, Bandyopadhyay A, Bose S. Mater Sci Eng C. 2007;27:729–735. [Google Scholar]
- 29.Xue W, Tao S, Liu X, Zheng X, Ding C. Biomaterials. 2004;25:415–421. doi: 10.1016/s0142-9612(03)00545-3. [DOI] [PubMed] [Google Scholar]
- 30.Ong JL, Carnes DL, Bessho K. Biomaterials. 2004;25:4601–4606. doi: 10.1016/j.biomaterials.2003.11.053. [DOI] [PubMed] [Google Scholar]
- 31.Daugaard H, Elmengaard B, Bechtold JE, Jensen T, Soballe K. J Biomed Mater Res. 2010;92A:913–921. doi: 10.1002/jbm.a.32303. [DOI] [PMC free article] [PubMed] [Google Scholar]