

Abstract
BACKGROUND AND PURPOSE:
Hemodynamics are thought to play an important role in the mechanisms of aneurysm pathogenesis, progression, and rupture. The purpose of this study was to define quantitative measures related to qualitative flow characteristics previously analyzed and to investigate their relationship to aneurysm rupture.
MATERIALS AND METHODS:
The hemodynamic environments in 210 cerebral aneurysms were analyzed by using image-based CFD under different flow conditions. Quantitative hemodynamic variables were defined and extracted from the simulation results. A statistical analysis of the relationship to the previous history of aneurysm rupture was performed, and the variability with flow conditions was assessed.
RESULTS:
Ruptured aneurysms were more likely to have larger inflow concentrations, larger MWSS, larger shear concentrations, and lower viscous dissipation ratios than unruptured aneurysms. Areas under low WSS and measures of abnormally low shear force distributions of ruptured and unruptured aneurysms were not statistically different. Although the values of hemodynamic quantities changed with different flow conditions, the statistical differences or ratios between their mean values over the ruptured and unruptured groups were maintained, for both pulsatile and steady flows.
CONCLUSIONS:
Concentrated inflow streams and WSS distributions with elevated levels of MWSS and low aneurysmal viscous dissipation are statistically associated with a clinical history of prior aneurysm rupture. In contrast, the area and total viscous shear force applied in the aneurysm region subjected to abnormally low WSS levels are not. This study highlights the potential for image-based CFD for investigating aneurysm-evolution mechanisms and for clinical assessment of aneurysm risks.
Precise assessment of cerebral aneurysm rupture risk is very valuable for clinicians because current treatments carry a small but significant risk that can exceed the small natural risk of rupture.1–3 Currently, aneurysm size is the main variable used to assess aneurysm-rupture risk, with large aneurysms more likely to rupture than smaller aneurysms.4,5 However, many small aneurysms do rupture; therefore, aneurysm size alone may not be enough for a precise evaluation of the risk of rupture. Thus, several researchers have attempted to better stratify the rupture risk with more sophisticated geometric measures.6–9 However, planning elective interventions requires a better understanding of the underlying mechanisms of aneurysm formation, progression, and rupture so that a sound judgment between the risks and benefits of possible therapies can be made. Although these processes are not well-understood, hemodynamics and, in particular, flow-induced WSS are thought to play a fundamental role.10–13 For this reason, several investigators have used image-based CFD models to extract patient-specific hemodynamic information.14–16 Although these studies have suggested interesting relationships between hemodynamic characteristics and aneurysm rupture, statistically significant results have not been achieved because the studies have been mostly limited to small numbers of aneurysms. Only recently has it been shown that ruptured and unruptured aneurysms had statistically different qualitative hemodynamic characteristics.17 In particular, that study showed that ruptured aneurysms were more likely to have concentrated inflow jets, small impingement regions, and complex and unstable flow patterns than unruptured aneurysms. The purpose of this study was to define quantitative hemodynamic variables related to these qualitative characteristics that can be objectively extracted from patient-specific CFD models and to study their relationship to aneurysm rupture.
Materials and Methods
Patients and Imaging Data
A total of 210 cerebral aneurysms in 128 patients imaged by 3DRA were included in this study for analysis, irrespective of aneurysm location, size, or morphology. The patients' medical and radiologic records were reviewed and evaluated for evidence of aneurysmal intracranial hemorrhage. In 27 patients with multiple aneurysms, the clinical and radiologic information were considered and a judgment of the most likely source of hemorrhage was made. The other coincident aneurysms were classified as unruptured. Cases with poor image quality (n = 8) or incomplete filling of the vessels (n = 9), evidence of vasospasm (n = 6), or incomplete or inconclusive clinical information (n = 3) as well as dissecting aneurysms (n = 2) were excluded from the study. All angiographic images were obtained under conventional transfemoral catheterization of the cerebral blood vessels. Rotational angiograms were acquired during a 6-second contrast injection for a total of 24 mL of contrast agent on an Integris biplane unit (Philips Healthcare, Best, the Netherlands). Bilateral 3DRA images were acquired for aneurysms of the anterior communicating artery accepting blood from the left and right A1 segments of the anterior cerebral arteries. 3D voxel datasets were reconstructed from the projection images by using standard proprietary software (XtraVision, Philips Healthcare).
Computational Modeling
Patient-specific models of the cerebral aneurysms and connected vessels were constructed from the 3DRA images by using seeded region-growing algorithms that reconstruct the vascular topology, followed by isosurface deformable models that recover the vascular geometry.18,19 As much of the proximal parent artery that was visible in the 3D images was included in the models to ensure proper representation of secondary flows and inflow to the aneurysms.20 Unstructured tetrahedral grids were then generated with a resolution of 0.01–0.02 cm for CFD simulation. Pulsatile blood-flow simulations were performed by numerically solving the 3D Navier-Stokes equations for a Newtonian incompressible fluid under the assumption of rigid vessel walls. Because patient-specific flow conditions were not available, typical flow waveforms derived from measurements on healthy subjects at different heart rates were used to prescribe inlet boundary conditions.21,22 The flow waveforms were scaled to achieve a given mean WSS at the inlets, which were located in internal carotid, vertebral, or basilar arteries. A total of 5 simulations were carried out for each aneurysm, 2 under pulsatile conditions corresponding to heart rates of 60 and 100 bpm and a mean inlet WSS of 15 dyne/cm2 and 3 under steady flow conditions of “low,” “medium,” and “high” flow rates corresponding to inlet WSS of 10, 15, and 20 dyne/cm2, respectively. The unsteady flow solutions were advanced in time by using 100 time steps per cardiac cycle for 2 cycles with a fully implicit scheme and efficient solution algorithms.23,24 Results of the second cycle were used for hemodynamic aneurysm characterization.
Data Reduction and Analysis
To extract quantitative measures of the aneurysm hemodynamic environment, we first partitioned the vascular models into different geographic regions as follows: First, the aneurysm necks were interactively delineated on the vascular models and the aneurysm orifices were triangulated. The regions of the vascular models on each side of the ostium surface triangulations were then classified as “aneurysm” or “vessel.” The vessel regions were further subdivided into 2 subregions labeled as “near vessel” and “far vessel,” corresponding to distances to the ostium surface less than or larger than 1.0 cm respectively, as seen in Shojima et al.14 Similarly, the aneurysm region was subdivided into “neck,” “body,” and “dome” subregions corresponding to geodesic distances (distance measured along the surface) to the ostium between 0% and 10%, 10% and 40%, and 50% and 100% of the maximum aneurysm distance. The methodology is illustrated in Fig 1(top row). Using this geographic vascular subdivision, schematically illustrated in Fig 1, we defined a number of hemodynamic measures. The mathematic definition of the different vascular regions and hemodynamic variables are detailed in the Appendix. The following variables were defined.
Fig 1.

Subdivision of the volumetric vascular domain and its surface into geographic regions: aneurysm, near-parent vessel, far-parent vessel, and ostium surface.
ICI measures the degree of concentration of the flow stream entering the aneurysm. It is defined as the percentage of the flow rate of the parent artery that enters the aneurysm divided by the percentage of the aneurysm ostium area that corresponds to positive inflow velocity:
where Qin is the flow rate into the aneurysm (inflow), Qv is the flow rate in the parent artery, Ain is the area of the inflow region, and Ao is the area of the ostium surface.
MWSS is the maximum wall shear stress computed over the aneurysm region.
SCI measures the degree of concentration of the WSS distribution. The region of the aneurysm sac where the WSS is higher than the mean WSS over the “near-vessel” region by 1 SD is defined as a region of “high WSS.” If we denote Ah as the area of this region and Aa as the area of the aneurysm sac, the SCI is defined as
where Fh and Fa represent the total viscous shear forces computed over the region of high WSS (Ah) and the entire sac (Aa):
with τ the shear stress vector. This index will take a value of zero if no part of the aneurysm has abnormally high WSS and will become large when the WSS distribution has a peak with high WSS concentrated on a small region of the sac.
LSA measures the extent of the aneurysm that is subjected to an abnormally low WSS. It is defined as the percentage of the area of the aneurysm sac that has WSS below the mean WSS in the parent artery by 1 SD:
where Al is the area under low WSS. This variable will tend to 1 if the aneurysm is entirely under abnormally low WSS and to zero if there is no region with abnormally low WSS.
LSI measures the relative amount of the total shear force applied in regions of abnormally low WSS:
where Fl represents the total shear force applied in the area of low WSS (Al):
This variable changes from zero (no frictional force applied in regions of abnormally low WSS) to 1 (total frictional force applied in region of abnormally low WSS).
KER measures the kinetic energy content of the aneurysm relative to that in the near-parent artery:
 |
VDR measures the amount of dissipation of mechanical energy by viscous effects in the aneurysm relative to that in the near-parent artery:
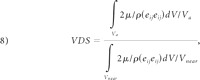 |
where eij is the strain rate tensor:
For each aneurysm, the values of these variables were computed at each instant of time and averaged over the cardiac cycle. Then, the average values of these variables over the groups of ruptured and unruptured aneurysms were computed and statistically compared by using the Student t test. The differences in the mean values were considered statistically significant if the 2-tailed P values were <.05 (95% confidence interval). The methodology for extraction of hemodynamic quantities from the CFD results is illustrated in Fig 2, with a patient-specific model.
Fig 2.

Hemodynamic data reduction. Top row, left to right: aneurysm neck delineation, aneurysm orifice triangulation, and vascular model geographic subdivision. Middle row: flow visualization, left to right: flow streamlines, isovelocity surface, WSS distribution. Bottom row, left to right: normal velocity magnitude at the aneurysm orifice; inflow (red) and outflow (blue) regions of the ostium; and regions of high (red), normal (gray), and low (blue) WSS.
Results
A total of 1050 CFD simulations, 420 pulsatile and 630 steady, on 210 patient-specific aneurysm geometries were carried out. Quantitative hemodynamic measures were obtained for each geometry and flow condition as explained before. The results are presented in Table 1. This Table lists, for each flow condition, the average of hemodynamic variables computed over the ruptured and unruptured aneurysm groups, along with the corresponding 2-tailed P values. These results are also summarized in Fig 3. This figure shows the ratio of mean hemodynamic variables computed over the ruptured group with respect to the mean values computed over the unruptured group, for each flow condition considered. The asterisks above the bars indicate statistically significant differences between the mean values of the ruptured and unruptured groups.
Table 1:
Mean values of hemodynamic variables computed over the ruptured and unruptured groups for each of the flow conditions considereda
| Flow Condition | Aneurysm Group | ICI | MWSS (dyne/cm2) | SCI | VDR | KER | LSA | LSI |
|---|---|---|---|---|---|---|---|---|
| Pulsatile flow (HR = 60 bpm) | Ruptured | 1.012 | 384 | 9.97 | 0.36 | 0.232 | 60% | 0.26 |
| Unruptured | 0.66 | 277 | 6.47 | 0.951 | 0.176 | 56% | 0.25 | |
| P value | .0035 | .0034 | .0154 | .0123 | .2226 | .3716 | .6630 | |
| Pulsatile flow (HR = 100 bpm) | Ruptured | 1.001 | 545 | 10.14 | 0.4156 | 0.259 | 60% | 0.27 |
| Unruptured | 0.651 | 402 | 6.39 | 1.0321 | 0.197 | 56% | 0.25 | |
| P value | .0034 | .0039 | .0073 | .0065 | .1836 | .4317 | .6837 | |
| Steady flow, low | Ruptured | 1.031 | 271 | 8.26 | 0.399 | 0.25 | 54% | 0.216 |
| Unruptured | 0.682 | 191 | 5.90 | 1.081 | 0.19 | 52% | 0.216 | |
| P value | .0029 | .0026 | .0490 | .0102 | .2410 | .0953 | .9800 | |
| Steady flow, medium | Ruptured | 1.001 | 187 | 9.88 | 0.341 | 0.226 | 60% | 0.26 |
| Unruptured | 0.662 | 130 | 6.36 | 0.914 | 0.170 | 56% | 0.25 | |
| P value | .0035 | .0026 | .0159 | .0174 | .2362 | .4621 | .7407 | |
| Steady flow, high | Ruptured | 0.951 | 108 | 12.77 | 0.236 | 0.168 | 68% | 0.333 |
| Unruptured | 0.622 | 74 | 7.52 | 0.571 | 0.129 | 63% | 0.308 | |
| P value | .0040 | .0037 | .0092 | .0105 | .3492 | .2357 | .5029 |
The (2-tailed) P values indicate the statistical significance of the difference of the mean values between the ruptured and unruptured groups, computed using a Student t test.
Fig 3.

Ratio of mean hemodynamic variables of ruptured aneurysms to unruptured aneurysms for each flow condition considered. The green bars represent the mean values over the unruptured aneurysm group used as reference values (ie, normalized to 1). The asterisks indicate that the differences in mean values between ruptured and unruptured groups are statistically significant (for all flow conditions).
Ruptured aneurysms were statistically more likely to have larger inflow concentration indices (ratio = 1.52 ± 0.01, P < .004), larger MWSS values (ratio = 1.41 ± 0.03, P < .0039), larger shear concentration indices (ratio = 1.54 ± 0.14, P < .0159), and lower viscous dissipation ratios (ratio = 0.38 ± 0.02, P < .017) than unruptured aneurysms. They also tended to have larger KERs (ratio = 1.31 ± 0.01, P < .241); however, this association did not reach statistical significance with the current sample. We also observed that the areas under low WSS (ratio = 1.08 ± 0.04, P < .462) and the LSIs (ratio = 1.04 ± 0.04, P < .741) of ruptured and unruptured aneurysms were not statistically different.
The variability with respect to the different flow conditions of the average hemodynamic variables over ruptured and unruptured groups is presented in Table 2. This Table lists the maximum relative difference of each hemodynamic variable obtained with the different flow conditions. Additionally, this Table shows the maximum relative difference of the ratio of ruptured-to-unruptured averaged hemodynamic variables obtained with the different flow conditions. It can be seen that as expected, hemodynamic measures change with the flow conditions while the ratio of ruptured-to-unruptured averaged values has a relatively low variability (<10%, except for the SCI, which reaches a maximum of a 17% relative difference). The data thus suggest that though the values of hemodynamic quantities change with the flow conditions, the statistical differences or ratios between their mean values over the ruptured and unruptured groups are maintained for both pulsatile and steady flows.
Table 2:
Variability with flow conditions of average hemodynamic measures and ratios of ruptured to unruptured aneurysms
| Variable | Ruptured | Unruptured | Ratio |
|---|---|---|---|
| ICI | 7.8% | 8.8% | 1.6% |
| MWSS | 80.2% | 81.6% | 7.1% |
| SCI | 35.3% | 21.5% | 17.5% |
| VDR | 43.2% | 47.1% | 10.7% |
| KER | 20.5% | 17.4% | 2.0% |
| LSA | 20.5% | 17.4% | 3.7% |
| LSI | 35.1% | 29.8% | 7.5% |
Discussion
The natural history of intracranial aneurysms consists of 3 stages: genesis, enlargement, and rupture. It is generally accepted that the pathogenesis is associated with abnormally high hemodynamic stresses.25,26 Rupture occurs when wall stress exceeds wall strength. Enlargement of aneurysms appears to be governed by the interaction between hemodynamic loads and mechanobiologic responses of the cellular elements of the wall, resulting in a weakening of the wall.27–29 However, there is significant controversy regarding the mechanisms responsible for growth and ultimate rupture of cerebral aneurysms, which can be divided into 2 theories: high- and low-flow effects. The distinguishing feature between the 2 schools of thought is in the mechanisms responsible for wall weakening. The high-flow theory focuses on the effects of elevation of WSS, which can cause endothelial injury and thus initiate wall remodelling and potential degeneration,30–33 which would result in an imbalance between the blood pressure and the internal wall stresses and subsequent local dilation of the arterial wall. The resulting abnormal blood WSS field is the driving factor for further progression of the aneurysm geometry. On the other hand, the low-flow theory points to localized stagnation of blood flow against the wall in the dome as causing a dysfunction of the endothelium, as well as accumulation and adhesion of platelets and leukocytes along the intimal surface, which then induce intimal damage and inflammation and subsequent wall degradation.34–36 The aneurysm wall would progressively thin and may result finally in a tearing of the tissue.
Previously, Cebral et al37 analyzed a series of 62 cerebral aneurysms and found that ruptured aneurysms were more likely to have concentrated inflow jets, small flow impingement regions, and complex unstable intra-aneurysmal flow patterns than unruptured aneurysms. These results were recently statistically confirmed with a larger series of aneurysms.17 The current study thus focused on defining quantitative hemodynamic variables that attempt to capture some of these qualitative characteristics as well as new variables that can help discriminate among theories of aneurysm progression based on low- or high-flow effects.
The statistical analysis indicates that the concentration of the inflow stream, determined by the ICI; the MWSS; the concentration of the WSS distribution determined by the SCI; and the viscous dissipation of the aneurysm with respect to that on the parent artery assessed by the VDR are all strongly correlated with aneurysm rupture. In particular, these associations suggest that ruptured aneurysms tend to have more concentrated inflows and WSS distributions, larger MWSS, and lower viscous dissipation. Note that as suggested in Speelman et al,38 the use of the 99th percentile may yield more robust and reproducible results than the peak WSS used here. On average, ruptured aneurysms also had larger kinetic energy contents than their parent artery as determined by the KER, but this trend did not reach statistical significance. In contrast, the percentage of the aneurysm area under low WSS (measured by the LSA) as well as the percentage of the viscous shear forces applied over this area (measured by the LSI) did not correlate with rupture. Mechanistically, these results seem to point to regions of concentrated rapid-flow activity as correlating with rupture rather than to regions of low or stagnant flows. However, establishing the dependence or independence of the hemodynamic measures considered requires a more sophisticated multivariate analysis than the simplistic analysis performed in this study and will be part of future research.
During the modeling process, a number of assumptions and approximations were made that need to be considered when interpreting the results. The most important approximations are perhaps the vascular geometry, the flow boundary conditions, the blood rheology, and the wall compliance. In this study, blood was approximated by a Newtonian model, and the vessel walls were considered rigid. Previous sensitivity analyses on a small number of aneurysms indicated that these 2 factors are secondary with respect to the geometry and flow conditions.18,20 Vascular geometries were obtained from 3D rotational angiograms with special attention paid to the reconstruction of the parent artery to properly represent the swirling flows that determine the way blood flows into the aneurysms.39 Images that failed to properly depict the parent vessel because of incomplete filling or images that were too noisy due to low contrast dose were discarded. Because patient-specific flow conditions were not available, the models were run under a range of physiologic flow conditions derived from measurements performed on healthy subjects, including both pulsatile and steady flows. The results of this study indicate that though the values of the hemodynamic measures considered do change with different flow conditions as expected, the statistical differences between ruptured and unruptured groups as well as their ratios are mostly unaffected. In other words, the same associations between hemodynamic quantities and rupture would be obtained if one decided to use 1 set of flow conditions or another. In particular, this conclusion implies that one could use steady flow conditions to extract some hemodynamic measures that are related to aneurysm rupture. This could allow the use of image-based CFD models for quick evaluation of cerebral aneurysms during clinical examinations to enhance current risk assessment and ultimately improve patient care.
Conclusions
A hemodynamic analysis of a series of cerebral aneurysms by using image-based CFD has shown that concentrated inflow streams and WSS distributions with elevated levels of MWSS and low aneurysmal viscous dissipation are statistically associated with a clinical history of prior aneurysm rupture. In contrast, the area and total viscous shear force applied in the aneurysm region subjected to abnormally low WSS levels did not correlate with rupture. These results seem to favor theories of aneurysm progression based on high-flow effects; however, further multivariate analyses are necessary to establish the dependence of the high- or low-flow measures defined in the current study and to shed further light onto these mechanisms. This study also highlights the potential for image-based CFD for investigating aneurysm-evolution mechanisms and in the clinical assessment of aneurysm risks.
Abbreviations
- bpm
beats per minute
- CFD
computational fluid dynamics
- 3DRA
3D rotational angiography
- HR
heart rate
- ICI
inflow concentration index
- KER
kinetic energy ratio
- LSA
low shear area
- LSI
low shear index
- MWSS
maximum WSS
- SCI
shear concentration index
- VDR
viscous dissipation ratio
- WSS
wall shear stress
Appendix
This Appendix lists the mathematic definitions of the vascular regions of Fig 1 as well as fluid dynamic (Table 3), geographic (Table 4), and hemodynamic (Table 5) variables used for analysis.
Table 3:
Fluid dynamic variables

Table 4:
Vascular regions and geographic variables
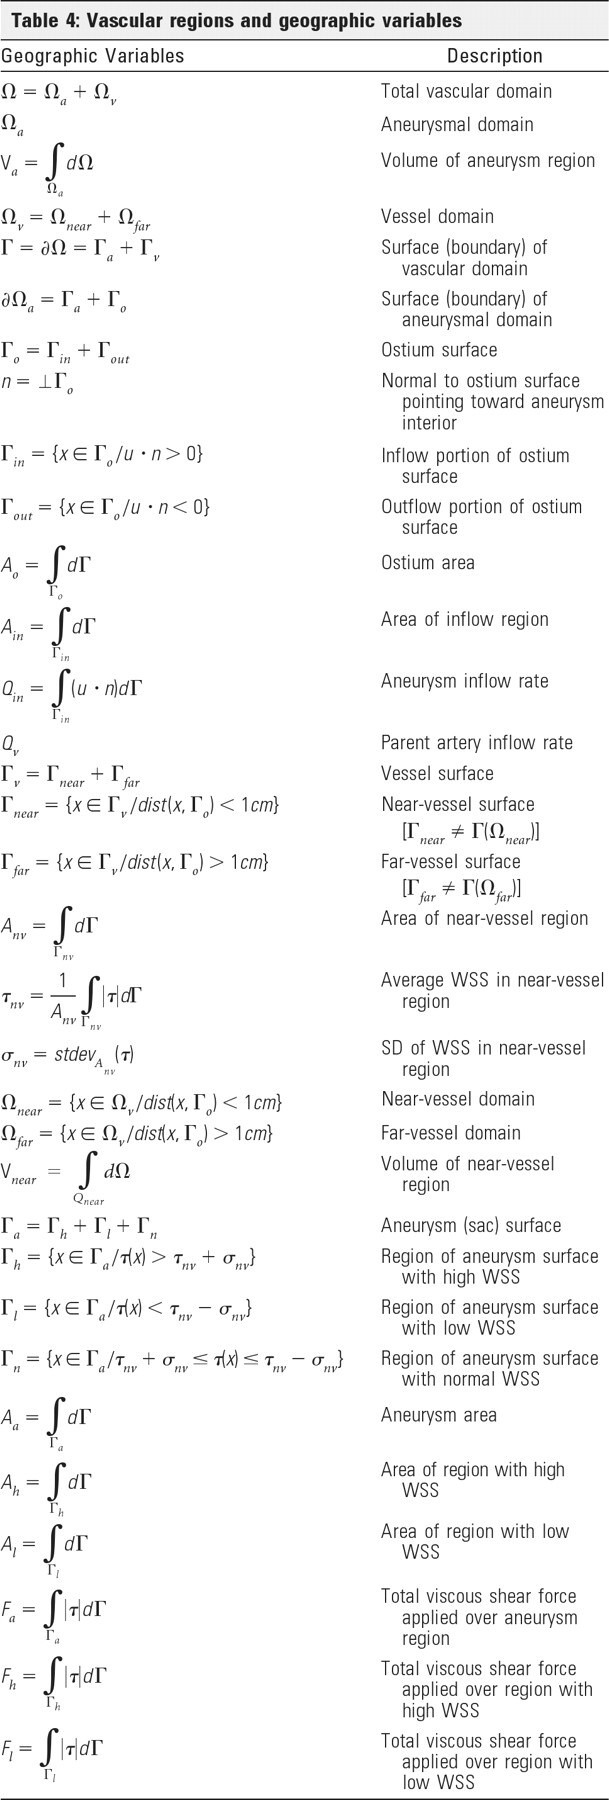
Table 5:
Aneurysm hemodynamic variables

Footnotes
This work was supported by Philips Healthcare and the National Institutes of Health (grant R01NS059063).
References
- 1. Kassell NF, Torner JC, Haley EC, et al. The International Cooperative Study on the Timing of Aneurysm Surgery. Part 1. Overall management results. J Neurosurg 1990;73:18–36 [DOI] [PubMed] [Google Scholar]
- 2. Wiebers DO, Whisnant JP, Huston J, 3rd, et al. , for the International Study of Unruptured Intracranial Aneurysms Investigators. Unruptured intracranial aneurysms: natural history, clinical outcome, and risks of surgical and endovascular treatment. Lancet 2003;362:103–10 [DOI] [PubMed] [Google Scholar]
- 3. Tomasello F, D'Avella D, Salpietro FM, et al. Asymptomatic aneurysms: literature meta-analysis and indications for treatment. J Neurosurg Sci 1998;42:47–51 [PubMed] [Google Scholar]
- 4. Nishioka H, Torner JC, Graf CJ, et al. Cooperative study of intracranial aneurysms and subarachnoid hemorrhage: a long-term prognostic study. II. Ruptured intracranial aneurysms managed conservatively. Arch Neurol 1984;41:1142–46 [DOI] [PubMed] [Google Scholar]
- 5. White PM, Wardlaw JM. Unruptured intracranial aneurysms. J Neuroradiol 2003;30:336–50 [PubMed] [Google Scholar]
- 6. Ujiie H, Tamano Y, Sasaki K, et al. Is the aspect ratio a reliable index for predicting the rupture of a saccular aneurysm? Neurosurgery 2001;48:495–503 [DOI] [PubMed] [Google Scholar]
- 7. Raghavan ML, Ma B, Harabaugh RE. Quantified aneurysm shape and rupture risk. J Neurosurg 2005;102:355–62 [DOI] [PubMed] [Google Scholar]
- 8. Ma B, Harbaugh RE, Raghavan ML. Three-dimensional geometrical characterization of cerebral aneurysms. Ann Biomed Eng 2004;32:264–73 [DOI] [PubMed] [Google Scholar]
- 9. Millan D, Dempere-Marco L, Pozo JM, et al. Morphological characterization of intracranial aneurysms using 3-D moment invariants. IEEE Trans Med Imaging 2007;26:1270–82 [DOI] [PubMed] [Google Scholar]
- 10. Stehbens WE. Intracranial aneurysms. In: Stehbens WE. Pathology of the Cerebral Blood Vessels. St. Louis, Missouri: CV Mosby; 1972:351–470 [Google Scholar]
- 11. Sforza D, Putman CM, Cebral JR. Hemodynamics of cerebral aneurysms. Annu Rev Fluid Mechanics 2009;41:91–107 [DOI] [PMC free article] [PubMed] [Google Scholar]
- 12. Kayembe KN, Sasahara M, Hazama F. Cerebral aneurysms and variations of the circle of Willis. Stroke 1984;15:846–50 [DOI] [PubMed] [Google Scholar]
- 13. Nixon AM, Gunel M, Sumpio BE. The critical role of hemodynamics in the development of cerebral vascular disease. J Neurosurg 2010;112:1240–53 [DOI] [PubMed] [Google Scholar]
- 14. Shojima M, Oshima M, Takagi K, et al. Magnitude and role of wall shear stress on cerebral aneurysm: computational fluid dynamic study of 20 middle cerebral artery aneurysms. Stroke 2004;35:2500–05 [DOI] [PubMed] [Google Scholar]
- 15. Steinman DA, Milner JS, Norley CJ, et al. Image-based computational simulation of flow dynamics in a giant intracranial aneurysm. AJNR Am J Neuroradiol 2003;24:559–66 [PMC free article] [PubMed] [Google Scholar]
- 16. Jou LD, Quick CM, Young WL, et al. Computational approach to quantifying hemodynamic forces in giant cerebral aneurysms. AJNR Am J Neuroradiol 2003;24:1804–10 [PMC free article] [PubMed] [Google Scholar]
- 17. Cebral JR, Mut F, Weir J, et al. Association of hemodynamic characteristics and cerebral aneurysm rupture. AJNR Am J Neuroradiol 2010. November 24. [Epub ahead of print] [DOI] [PMC free article] [PubMed] [Google Scholar]
- 18. Cebral JR, Castro MA, Appanaboyina S, et al. Efficient pipeline for image-based patient-specific analysis of cerebral aneurysm hemodynamics: technique and sensitivity. IEEE Trans Med Imaging 2005;24:457–67 [DOI] [PubMed] [Google Scholar]
- 19. Yim PJ, Cebral JR, Mullick R, et al. Vessel surface reconstruction with a tubular deformable model. IEEE Trans Med Imaging 2001;20:1411–21 [DOI] [PubMed] [Google Scholar]
- 20. Castro MA, Putman CM, Cebral JR. Computational fluid dynamics modeling of intracranial aneurysms: effects of parent artery segmentation on intra-aneurysmal hemodynamcis. AJNR Am J Neuroradiol 2006;27:1703–09 [PMC free article] [PubMed] [Google Scholar]
- 21. Cebral JR, Castro MA, Putman CM, et al. Flow-area relationship in internal carotid and vertebral arteries. Physiol Meas 2008;29:585–94 [DOI] [PMC free article] [PubMed] [Google Scholar]
- 22. Jiang J, Strother C. Computational fluid dynamics simulations of intracranial aneurysms at varying heart rates: a “patient-specific” study. J Biomech Eng 2009;131:091001. [DOI] [PubMed] [Google Scholar]
- 23. Cebral JR, Löhner R, Appanaboyina S, et al. Image-based computational hemodynamics methods and their application for the analysis of blood flow past endovascular devices. In: Leondes CT. Biomechanical Systems: Techniques and Applications, Volume I: Computer Techniques and Computational Methods in Biomech. Hackensack, New Jersey: World Scientific; 2007:29–85 [Google Scholar]
- 24. Mut F, Aubry R, Löhner R, et al. Fast numerical solutions of patient-specific blood flows in 3D arterial systems. Commun Numer Meth Engng 2010;26:73–85 [DOI] [PMC free article] [PubMed] [Google Scholar]
- 25. Gao L, Hoi Y, Swartz DD, et al. Nascent aneurysm formation at the basilar terminus induced by hemodynamics. Stroke 2008;39:2085–90 [DOI] [PMC free article] [PubMed] [Google Scholar]
- 26. Metaxa E, Tremmel M, Xiang J, et al. High wall shear stress and positive wall shear stress gradient trigger the initiation of intracranial aneurysms. In: Proceedings of the Summer Bioengineering Conference, Lake Tahoe, California. June 17–21, 2009 [Google Scholar]
- 27. Chatziprodromou I, Tricoli A, Poulikakos D, et al. Haemodynamics and wall remodelling of a growing cerebral aneurysm: a computational model. J Biomech 2007;40:412–26. Epub 2006 Mar 9 [DOI] [PubMed] [Google Scholar]
- 28. Humphrey JD. Vascular adaptation and mechanical homeostasis at tissue, cellular, and sub-cellular levels. Cell Biochem Biophys 2008;50:53–78. Epub 2007 Oct 24 [DOI] [PubMed] [Google Scholar]
- 29. Socci L, Pennati G, Gastaldi D, et al. Modeling and mechanobiology of cerebral aneurysms. J Appl Biomater Biomech 2008;6:63–71 [PubMed] [Google Scholar]
- 30. Sho E, Sho M, Singh TM, et al. Blood flow decrease induces apoptosis of endothelial cells in previously dilated arteries resulting from chromic high blood flow. Arterioscler Thromb Vasc Biol 2001;21:1139–45 [DOI] [PubMed] [Google Scholar]
- 31. Hara A, Yoshimi N, Mori H. Evidence for apoptosis in human intracranial aneurysms. Neurol Res 1998;20:127–30 [DOI] [PubMed] [Google Scholar]
- 32. Fukuda S, Hashimoto N, Naritomi H, et al. Prevention of rat cerebral aneurysm formation by inhibition of nitric oxide synthase. Circulation 2000;101:2532–38 [DOI] [PubMed] [Google Scholar]
- 33. Nakatani H, Hashimoto N, Kang Y, et al. Cerebral blood flow patterns at major blood vessel bifurcations and aneurysms in rats. J Neurosurg 1991;74:258–62 [DOI] [PubMed] [Google Scholar]
- 34. Griffith TM. Modulation of blood flow and tissue perfusion by endothelium-derived relaxing factor. Exp Physiol 1994;779:873–913 [DOI] [PubMed] [Google Scholar]
- 35. Moncada S, Plamer RM, Higgs EA. Nitric oxide: physiology, pathology and pharmacology. Exp Physiol 1991;43:109–42 [PubMed] [Google Scholar]
- 36. Moritake K, Handa H, Hayashi K, et al. Experimental studies on intracranial aneurysms (a preliminary report): some biomechanical considerations on the wall structures of intracranial aneurysms and experimentally produced aneurysms. [in Japanese] No Shinkei Sheka 1973;1:115–23 [Google Scholar]
- 37. Cebral JR, Castro MA, Burgess JE, et al. Characterization of cerebral aneurysms for assessing risk of rupture using patient-specific computational hemodynamics models. AJNR Am J Neuroradiol 2005;26:2550–59 [PMC free article] [PubMed] [Google Scholar]
- 38. Speelman L, Bosboom EM, Schurink GW, et al. Patient-specific AAA wall stress analysis: 99-percentile versus peak stress. Eur J Vasc Endovasc Surg 2008;36:668–76 [DOI] [PubMed] [Google Scholar]
- 39. Castro MA, Putman CM, Cebral JR. Patient-specific computational fluid dynamics modeling of anterior communicating artery aneurysms: a study of the sensitivity of intra-aneurysmal flow patterns to flow conditions in the carotid arteries. AJNR Am J Neuroradiol 2006;27:2061–68 [PMC free article] [PubMed] [Google Scholar]