Abstract
Brain asymmetry, or the structural and functional specialization of each brain hemisphere, has fascinated neuroscientists for over a century. Even so, genetic and environmental factors that influence brain asymmetry are largely unknown. Diffusion tensor imaging (DTI) now allows asymmetry to be studied at a microscopic scale by examining differences in fiber characteristics across hemispheres rather than differences in structure shapes and volumes. Here we analyzed 4 Tesla DTI scans from 374 healthy adults, including 60 monozygotic twin pairs, 45 same-sex dizygotic pairs, and 164 mixed-sex DZ twins and their siblings; mean age: 24.4 years +/− 1.9SD). All DTI scans were nonlinearly aligned to a geometrically-symmetric, population-based image template. We computed voxel-wise maps of significant asymmetries (left/right differences) for common diffusion measures that reflect fiber integrity (fractional and geodesic anisotropy; FA, GA and mean diffusivity, MD). In quantitative genetic models computed from all same-sex twin pairs (N=210 subjects), genetic factors accounted for 33% of the variance in asymmetry for the inferior fronto-occipital fasciculus, 37% for the anterior thalamic radiation, and 20% for the forceps major and uncinate fasciculus (all L>R). Shared environmental factors accounted for around 15% of the variance in asymmetry for the cortico-spinal tract (R>L) and about 10% for the forceps minor (L>R). Sex differences in asymmetry (men > women) were significant, and were greatest in regions with prominent FA asymmetries. These maps identify heritable DTI-derived features, and may empower genome-wide searches for genetic polymorphisms that influence brain asymmetry.
Keywords: DTI, brain asymmetry, fractional anisotropy, geodesic anisotropy, structural equation model, twins, quantitative genetics, path analysis
1 Introduction
Asymmetries in brain structure and function have been studied for over a century. Anatomical asymmetries give evidence for the developmental and evolutionary origins of lateralized cognitive functions and behavioral traits, such as language and handedness (Lancaster et al., 2003; Toga and Thompson, 2003; Luders et al., 2005).
Structural brain asymmetries are influenced by both genetic and environmental factors throughout life. The degree of anatomical asymmetry depends to some extent on age (Sowell et al., 2003), sex (Luders et al., 2003; Witelson et al., 1993), and handedness (Narr et al., 2007).
Aberrant asymmetries, reported in several brain disorders, may indicate a derailment in processes that establish normal hemispheric specialization. Some mental illnesses, such as schizophrenia, are thought by some to arise due to a failure of normal functional lateralization (Crow et al, 1990; Narr et al., 2007; Hamilton et al., 2007) although such a view is not universally accepted. Altered asymmetries have been found in groups of patients with dyslexia (Beaton, 1997), Williams syndrome (Thompson et al., 2005; Eckert et al., 2006), fetal alcohol syndrome (Sowell et al., 2002), Huntington’s disease (Mühlau et al., 2007), and multiple sclerosis (Koziol et al., 2005). Inherently lateralized pathologies, such as temporal lobe epilepsy (where the seizure focus is typically on one side of the brain only) may also be assessed by mapping the level of brain asymmetry (Lin et al., 2006).
Asymmetries in the rate of disease progression have reported in some, but not all, studies of degenerative diseases such as Alzheimer’s disease and mild cognitive impairment (MCI; Thompson et al., 2003; Thompson et al., 1998; Morra et al., 2009). Taken together, all these asymmetries heighten interest in possible differences in the vulnerability of the two hemispheres to various types of neuropathology and age-related decline, and the origins of these differences.
Diffusion tensor imaging (DTI) offers a new opportunity to study hemispheric differences in microscopic fiber characteristics. DTI is a variant of magnetic resonance imaging, sensitive to directionally constrained water diffusion that occurs preferentially along myelinated axons (Basser and Pierpaoli, 1996). The fractional anisotropy (FA) of diffusion tends to be higher when fiber tracts are more directionally coherent, or more heavily myelinated, and is a widely accepted index of the microstructural integrity of white matter (Klingberg et al., 2000; Beaulieu, 2002).
DTI studies in twins can be used to determine genetic and environmental effects on fiber architecture. Monozygotic twins share all their genes while dizygotic twins share, on average, half. Estimates of the proportion of variance attributable to genes versus environment may be inferred by fitting structural equation models to data from both types of twins. Twin MRI studies have already found that genetic factors strongly influence several aspects of brain structure, such as cortical thickness, and gray and white matter volumes (Thompson et al., 2001; Styner et al., 2005; Hulshoff Pol et al., 2006; Peper et al., 2007; Schmitt et al. 2008; Chou et al., 2008; Leporé et al., 2008; Brun et al., 2009). Even so, twin studies using DTI are still quite rare (recent examples include Lee et al., 2009a,b; Kochunov et al., 2009; Chiang et al., 2009).
Here we used a twin design to map the 3D pattern of asymmetries and to search for regions where these asymmetries are highly heritable. Honing in on heritable DTI-derived signals may empower genome-wide searches for specific contributing genes, by first isolating regions where differences are heritable. This may alleviate, to some degree, the enormous sample sizes and multiple comparisons corrections that frustrate efforts to detect and replicate single-gene effects on brain structure (Stein et al., 2009a, b) and DTI (Chiang et al., 2009b).
We set out to create the first DTI-based maps of asymmetries (left/right hemisphere differences) for commonly-studied fiber characteristics (FA, GA, MD) in a large, mixed-sex twin population (N=374). Studies of fiber-level asymmetries may be confounded by known asymmetries in brain shape, such as the natural petalias that make the right frontal lobe protrude beyond the left (Toga and Thompson, 2003). It makes sense to reduce these pronounced macrostructural differences across subjects before gauging the level of microstructural asymmetry, especially in a mixed-sex population, where sex differences in anatomy may also be found (Brun et al., 2009). We therefore adjusted, as far as possible, for the known structural differences between hemispheres by aligning brains to a “symmetrized” minimal deformation target (MDT) created from the set of fractional anisotropy images in the study.
As well as assessing genetic influences on diffusion asymmetry, secondary (exploratory) analyses were also performed to assess any effects of sex and IQ.
2 Methods
2.1. Subjects and image acquisition
Structural and diffusion tensor (DT) whole-brain MRI scans were acquired from 374 subjects with a high magnetic field (4T) Bruker Medspec MRI scanner. T1-weighted images were acquired with an inversion recovery rapid gradient echo sequence. Acquisition parameters were as follows: TI/TR/TE= 700/1500/3.35 msec; flip angle=8 degrees; slice thickness = 0.9 mm, with an acquisition matrix of 256×256×256. Diffusion-weighted images were also acquired using single-shot echo planar imaging with a twice-refocused spin echo sequence to reduce eddy-current induced distortions. Acquisition parameters were optimized to provide the best signal-to-noise ratio for estimation of diffusion tensors (Jones et al., 1999). Imaging parameters were: 23 cm FOV, TR/TE 6090/91.7 ms, with a 128×128 acquisition matrix. Each 3D volume consisted of 55 2-mm thick axial slices with no gap and 1.79×1.79 mm2 in-plane resolution. 105 images were acquired per subject: 11 with no diffusion sensitization (i.e., T2-weighted b0 images) and 94 diffusion-weighted (DW) images (b = 1149 s/mm2) with gradient directions evenly distributed on the hemisphere. Scan time was 14.2 minutes. The subjects included 120 young adult monozygotic (MZ) twins (60 pairs - 21 male, 39 female), 90 same-sex dizygotic (DZ) twins (45 pairs - 15 male, 30 female); and an additional 148 mixed-sex dizygotic twins (i.e., one male and female twin per pair) and any non-twin siblings for whom scans were available. No subjects reported a history of significant head injury, neurological or psychiatric illness, substance abuse or dependence, or had a first-degree relative with a psychiatric disorder. In addition, all subjects were screened, using a detailed neurocognitive evaluation (de Zubicaray et al., 2008) to exclude cases of pathology known to affect brain structure. In total, diffusion images from 374 (145 male, 229 female) right-handed young adults (mean age: 24.37 years, s.d. 1.94) were included in this study. Handedness was assessed in these subjects based on 12 items from Annett’s Handedness Questionnaire (Annett, 1970).
2.2. Preprocessing and General Overview
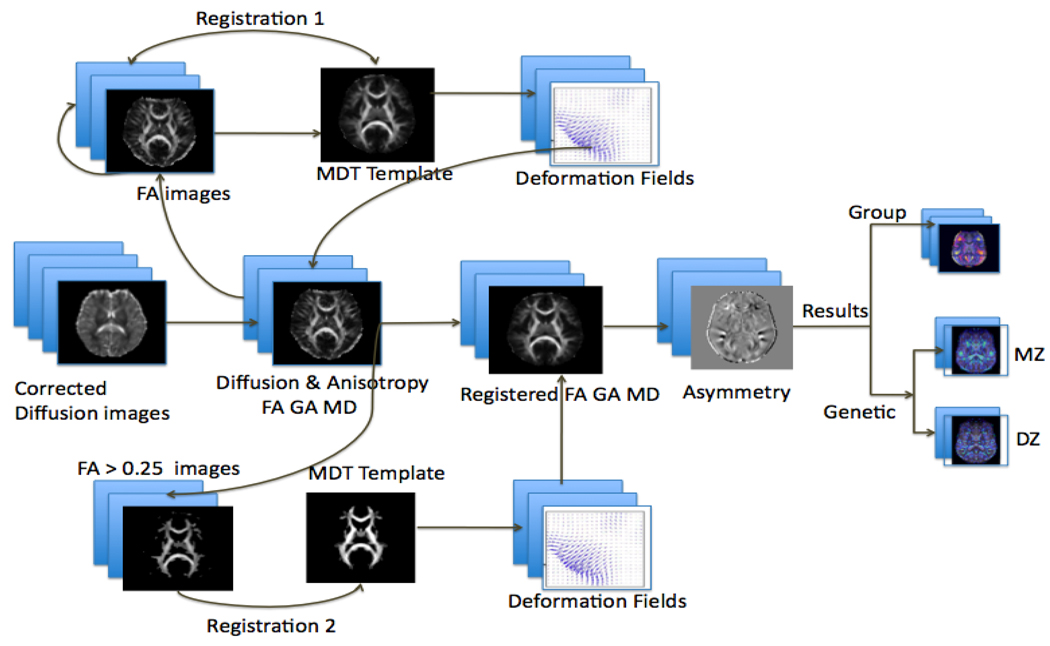
Each subject’s T1-weighted MR and DWI images were edited to remove extracerebral tissues. All skull-stripped structural T1-weighted images were linearly aligned (with 9 degrees of freedom) to a standard template to ensure alignment in space. The raw diffusion weighted images were corrected for eddy current induced distortions using the FSL tool, “eddy_correct”. For each subject, the 11 eddy-corrected images with no diffusion sensitization, also called the b0 images, were averaged. The average b0 maps were then aligned and elastically registered to the subject’s aligned T1-weighted structural scan using a mutual information cost function (Leow et al., 2005) to account for EPI induced susceptibility artifacts. Similar registrations have been shown to be useful for EPI distortion correction (Huang, 2008). The rest of the image processing steps, using the distortion corrected sets of diffusion weighted images, are summarized in Figure 1. A “mean deformation template” image was created using fractional anisotropy (FA) maps derived from the diffusion-weighted data (detailed below). The FA images were registered directly to the target and the resulting deformation fields were applied to all the anisotropy maps to put them all into the same coordinate space. To further ensure alignment of white matter tracts, the registered FA maps were thresholded to include only those regions where FA > 0.25. These images were then registered to the thresholded template, and the resulting deformation fields were reapplied to all the registered anisotropy maps. Left-right asymmetries in the anisotropy maps were calculated, and various group-wise statistical analyses were performed. Voxel-wise statistics were used, as in many prior DTI studies (Liu et al., 2009; Ardekani et al., 2007). These included quantitative genetic analyses to estimate genetic and environmental contributions to the observed differences. We expected genetic factors to play a substantial role in the lateralization of the fiber anisotropy in language association regions of the temporal lobe, including the arcuate fasciculus (de Jong et al., 2009; Rodrigo et al., 2007). We also predicted that the use of a symmetrized brain template as a registration target might somewhat reduce the level of observed asymmetry, by eliminating factors reflecting brain shape, such as the level of petalia, or torquing, of the brain.
Figure 1.
Flow chart of steps used to analyze DTI asymmetries. The non-diffusion-weighted images (also called b0 images) from all subjects were used to make a group “average-shape” brain, or mean deformation template (MDT), and they were nonlinearly registered to this template. The deformation fields were also applied to maps of mean diffusivity (MD) and anisotropy (FA, GA) to align them all to the common template. Statistical maps were made to show the mean level of asymmetry in different brain regions. Genetic analysis of the variance in fiber characteristics was performed at each location in the brain.
2.3 Anisotropy Calculation and Registration
DTI was introduced by Basser et al. (1994) to characterize the anisotropy (directional preference) in the diffusion of water molecules in brain tissue. In DTI, the MR signal attenuation due to water diffusion in direction k decreases according to the Stejskal-Tanner equation, if a Gaussian distribution is assumed: S k (r)=S0 (r)e−b kDk (r). Here S0 (r) is the non-diffusion weighted baseline intensity in direction r, Dk (r) is the apparent diffusion coefficient (ADC), and bk is a constant depending on the direction k. Two of the many popular scalar measures of fiber anisotropy include the fractional anisotropy and geodesic anisotropy. Fractional anisotropy (FA) is one of the most widely used measures in DTI research. Geodesic anisotropy (GA) is a measure more recently advocated by several groups (Batchelor et al., 2005; Arsigny et al., 2006). Both measures are calculated from a local tensor (3D Gaussian) approximation for Dk (r); GA assesses differences between tensors using a geodesic distance measure on the manifold on which the tensors lie (Arsigny et al., 2006; Fletcher and Joshi, 2004). Prior work on the genetics of fiber integrity suggested that GA was slightly better able to detect genetic influences on the DTI signal than FA (Lee et al., 2008, 2009).
Diffusion tensors were computed from the 105-gradient diffusion-weighted images using the FSL software (http://fsl.fmrib.ox.ac.uk/fsl/). FA and GA scalar images of anisotropy, and mean (MD), axial (AD) and radial diffusivity (RD) measures were created for the 374 subjects from the eigenvalues (λ1, λ2, λ3) of the symmetric 3×3 diffusion tensor. The hyperbolic tangent of the GA (tanhGA or tGA) was also computed, which takes values in the same range as FA, i.e., [0,1]:
| (1) |
| (2) |
| (3) |
2.4 Template Creation and Registration
To avoid misinterpreting any detected differences, it is helpful to reduce the pronounced macrostructural differences when gauging the level of microstructural asymmetry, especially in a mixed-sex population. We therefore adjusted, as far as possible, for the known structural differences between hemispheres by aligning brains to a symmetrized minimal deformation target (MDT) created from the set of FA images. The choice of registration target is known to affect the accuracy of region of interest (ROI) analyses (Wang et al., 2005), so we created a symmetrical population-based mean deformation target (MDT) using non-linear fluid registration, as described in (Leporé et al., 2006, 2008). Several alternative methods to create an MDT have been proposed, but here we used the method proposed by (Kochunov et al., 2001, 2002): the N 3D vector fields fluidly registering a specific individual to all other N subjects were averaged and applied to that subject. This way, the anatomy was geometrically adjusted while the image intensities and anatomical features of that specific subject were retained.
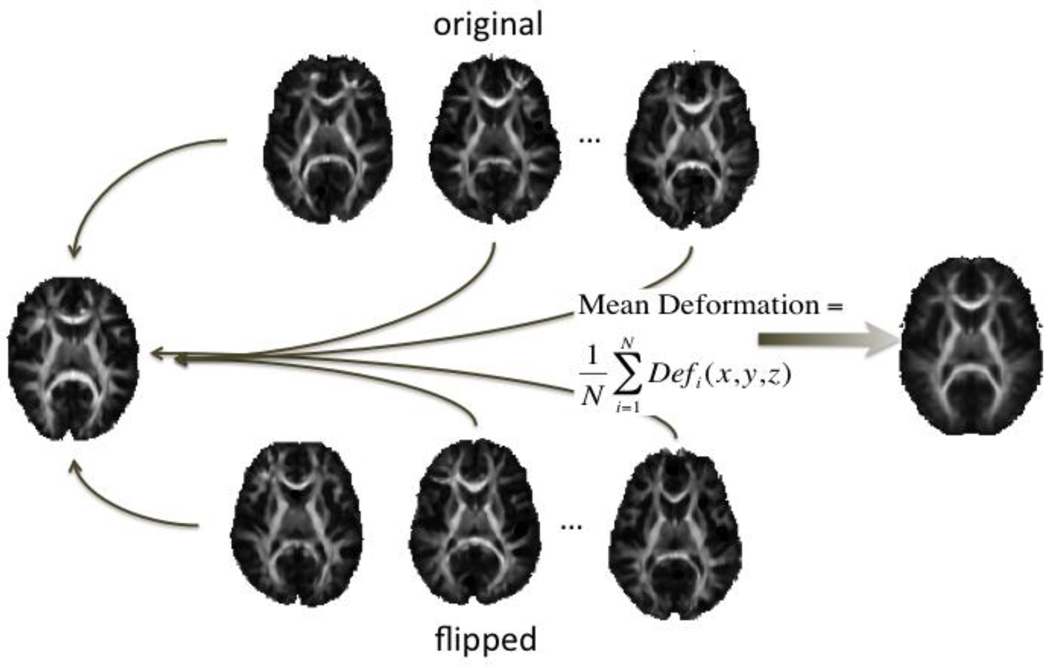
To construct a symmetric, population-based MDT, a random selection of 32 (16 female/16 male) non-related subjects’ fractional anisotropy images were used (calculated after b0 susceptibility correction). This group was split into two subgroups of 16 (8 women in each). Within each subgroup, half the subjects (8 total, 4 women) were reflected across the midsagital plane. All subjects in the subgroups were then fluidly registered to a single subject target within the group. In one group the target was selected to be a mirrored image, while in the other the target was in the original orientation. One group’s target was female, the other male. In each group, 8 of the 15 images aligned to the target were of the opposite orientation to the target (original orientation or mirrored across the midsagittal) and the other 7 were in the same orientation (see Figure 2). Once all images were registered to the designated target, the deformation fields from all registrations within the group were averaged and applied to the corresponding target to obtain the within-group mean deformation target (MDT). The 2 group MDTs were the co-registered, and averaged along with their mirror images to ensure a structurally symmetric template on both a macro- and micro-structural scale.
Figure 2.
To create an MDT that was symmetrical by design, deformation fields - mapping images in their original orientation and others in the flipped orientation to the template - were averaged and applied to the template.
In our prior work (Jahanshad et al., 2009), we found that using T2-weighted images for registration purposes yields results similar to those obtained from using higher resolution T1-weighted images, with the advantage that they are inherently in register with the diffusion-weighted images from the same scanning session. To further ensure alignment of the white matter regions of interest, in this study, we decided to use a DTI-derived measure, the FA, to drive the registration. This should reduce the bias in examining micro-structural asymmetry by greatly reducing the macroscopic misregistration of the white matter. Other groups have proposed the use of multiple diffusion tensor based channels may improve the process of template generation and reduce the misregistration bias (Park et al., 2003, 2004)
FA maps for each of the linearly aligned 374 subjects were registered to the final population averaged FA-based MDT using a 3D elastic warping technique. This elastic registration enforces diffeomorphic mappings and uses mutual information as a cost function (Leow et al., 2005). 3D deformation fields mapping each subject to the MDT were retained and applied to the original FA, tGA, and MD maps. To further ensure alignment of white matter regions of interest, the FA-MDT as well as all whole-brain registered FA maps were then thresholded to include only those regions where the FA was greater than 0.25. The individual thresholded FA maps were then re-registered to the thresholded MDT in the same way as the whole brain registration. The resulting deformation fields were once again applied to the anisotropy maps. When transforming FA maps onto a common template, strictly speaking, the FA values cannot be absolutely preserved as they are trilinearly interpolated after they are transformed through a displacement field. As such they will be very slightly smoother than the raw data, but the smoothing will not vary in a spatially biased way. The warping of FA maps through a non-rigid transform will also slightly alter the relative volumes of different brain regions, although this spatial normalization is deliberate and is required for cross-subject averaging and comparisons.. For region of interest analysis, the JHU DTI atlas (Mori et al., 2005; Wakana et al., 2007) was also mapped to the MDT using elastic registration. Tract probability maps were thresholded to include all regions that had a probability greater than 0.25 of being within a specific tract.
2.5 Creating Asymmetry Maps
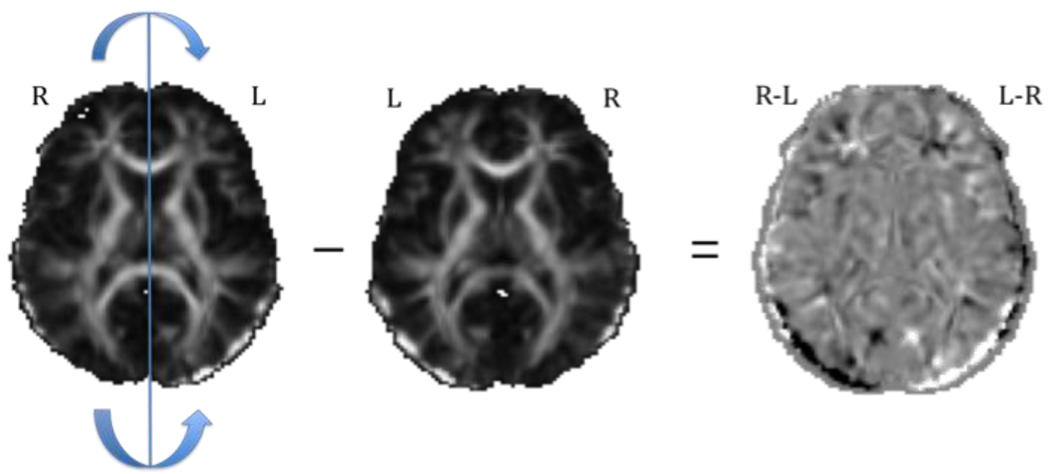
Each aligned anisotropy map was mirrored across the midline (Figure 3), and the voxel-wise difference map between the original and flipped images was created. In this new map, the left side of the image represents the difference between the subjects’ right and left hemispheres; voxels on the other side of the image have the opposite sign.
Figure 3.
Maps of anisotropy asymmetry were created by reflecting every axial slice in the original image across midline and subtracting the flipped image from the original. Dark regions represent negative values; brighter (e.g., white) regions represent positive values.
2.6 Estimating Genetic Contributions
To determine the magnitude of the genetic contributions to fiber asymmetry, three approaches were employed, each of which takes advantage of the fact that monozygotic twins share all of their genetic material while dizygotic twins share, on average, half. All genetic analyses were performed on a subset of 210 subjects: 60 pairs of monozygotic twins and 45 pairs of same-sex dizygotic twins.
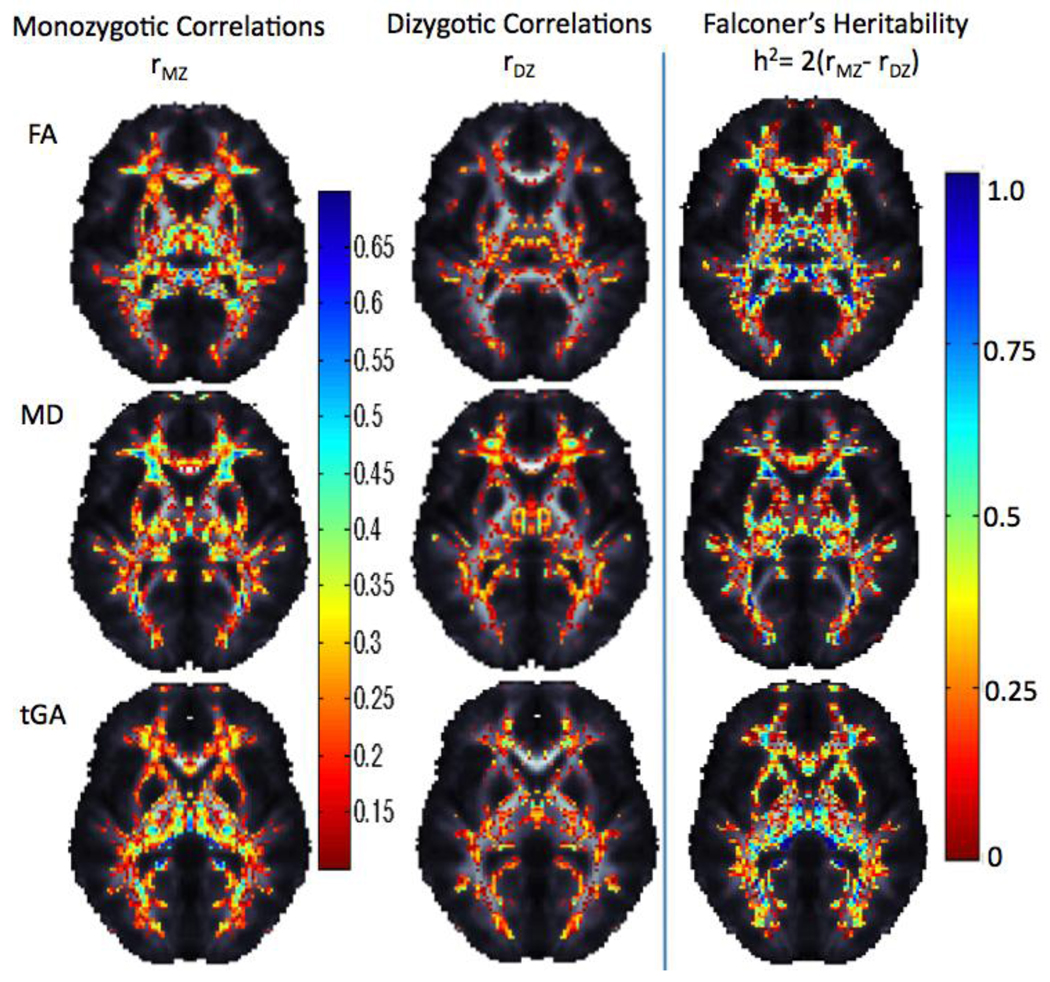
First, voxel-wise maps were derived showing the intra-class correlations (ICC) within MZ and DZ twins, rMZ and rDZ respectively, to compute a simple measure of genetic effects: Falconer's heritability estimate, h2 =2(rMZ −r DZ) (Falconer and Mackay, 1995) for the asymmetry in FA, MD, and tGA. The intra-class correlations are general measures of resemblance defined as the difference between the mean squared estimates of the between-pair and within-pair variance divided by the sum of the two. Falconer’s heritability measures differences between the correlations of the two types of twins as an initial index of any genetic contribution to the overall observed variance.
Next, average measures of the anisotropy difference were examined in certain regions of interest (ROIs). For region of interest analysis, the tract probability maps from the JHU DTI atlas (Mori et al., 2005; Wakana et al., 2007) were mapped using elastic registration to the symmetric MDT, and were thresholded to include regions where the probability for the tract occurring at that voxel was greater than 0.25. As these tracts were already mapped to our symmetric template, only portions of the tracts in one hemisphere were retained to accurately assess inter-hemispheric differences. The tracts included in the analysis were the anterior thalamic radiation, corticospinal tract, cingulate gyrus, hippocampus cingulum, forceps major, forceps minor, inferior fronto-occipital fasciculus, inferior longitudinal fasciculus, superior longitudinal fasciculus, uncinate fasciculus, and the temporal superior longitudinal fasciculus
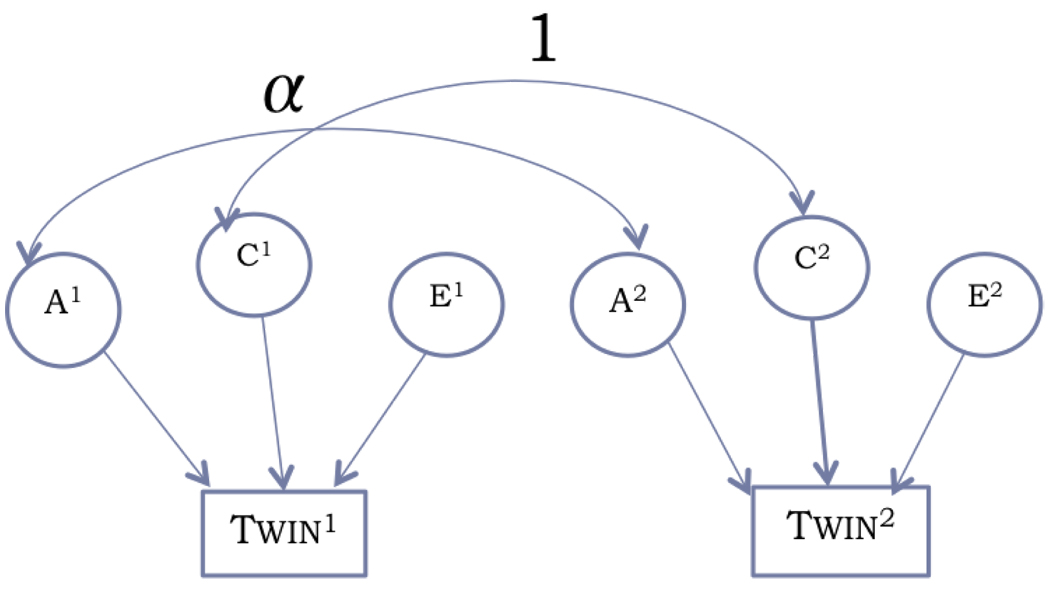
For each anisotropy measure, covariances for the average asymmetry in the region of interest were computed between the pairs of MZ and DZ twins. These were entered into a univariate structural equation model to estimate additive genetic (A), shared environmental (C) and unique environmental (E) components of the variance in asymmetry (Rijsdijk and Sham, 2002) using Mx modeling software (http://www.vcu.edu/mx/).
Finally, voxelwise A/C/E tests were computed for asymmetries in the anisotropy measures, after determining the covariance between the twin pairs using the same type of univariate structural equation model to specify locations of heritable effects on fiber asymmetry. The asymmetry was calculated for each subject and the covariance between the members of the twin pairs was measured for each type of twin (MZ and DZ) at every voxel, resulting in an observed covariance matrix S for every voxel. These observed covariance matrices may be computed for any variable (Z) modeled as in Equation 4, and a structural equation model (SEM) may be fitted to compare the observed and expected covariances (Σ in Equation 5) to infer the proportion of the variance due to the A, C and E factors:
| (4) |
A/C/E are latent (unobserved) variables and a, c, e are the weights of each parameter determined through optimization of Σ using maximum likelihood fitting. The variance components combine to create the total observed inter-individual variance, so that a2 +c2 +e2 =1.
This form of structural equation model (SEM) uses the maximum likelihood estimate (MLE; Equation 5) with a χ2 null distribution to estimate genetic versus environmental contributions to the variance, where m=1, the number of observed variables, Ng, is the number of twin pairs used, Sg is the observed covariance matrix for each twin group g, and Σg is the expected covariance matrix for group g, with α=1 for the MZ group and α=0.5 for the DZ group:
| (5) |
In structural equation modeling, the χ2 goodness of fit measure determines a p-value for all specified regions of interest where the test was performed, in this case either the lobar regions (for the regional summaries) or at every individual voxel. This value indicates that the model is a good fit to the data if p>0.05. However, to determine the significance of a particular factor, such as A or C, the χ2 goodness of fit values of the model may be compared to those for a model that does not include the factor (i.e., to a C/E model to determine the significance of the additional A factor, and to an A/E model to determine the significance of the C factor), giving:
| (6) |
where χ2 1DF −1 denotes the inverse of the cumulative distribution function for a chi-squared distributed variable with one degree of freedom. In this case, low p-values express significant improvements when adding a factor, which is consistent with the more standard convention for p-values, and allows the resulting uncorrected p-value maps to be assessed using false discovery rate analyses.
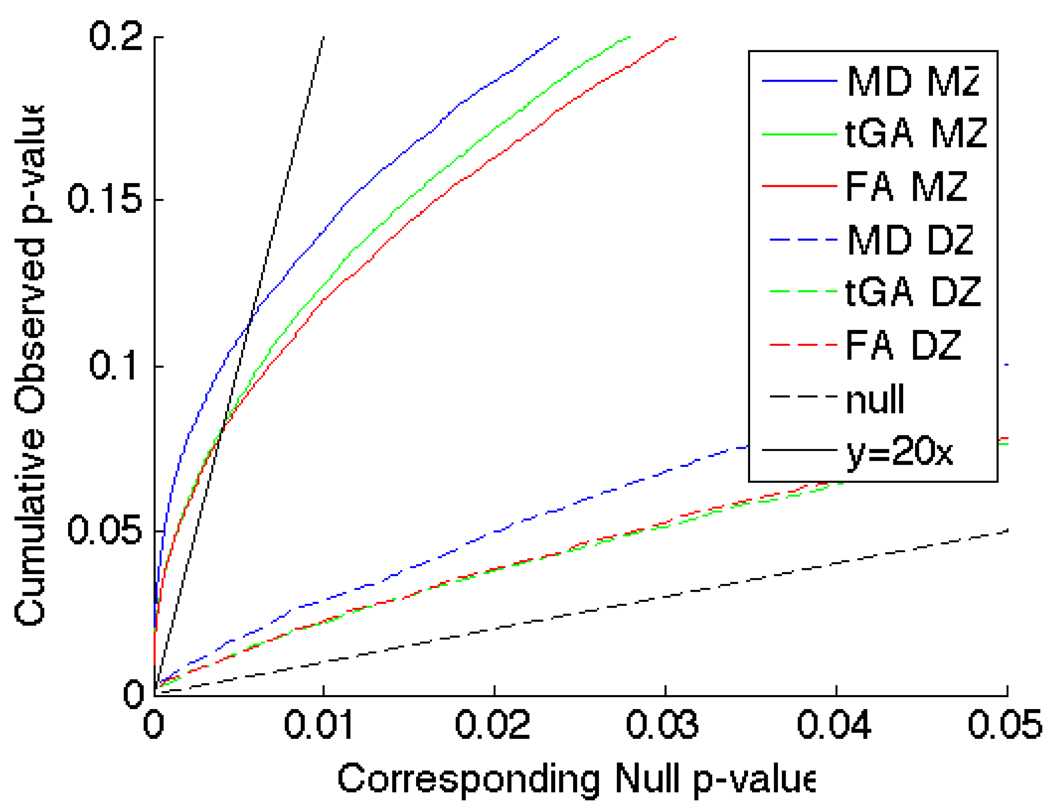
To account for the multiple comparison problem that arises when testing a statistical hypothesis at every voxel, non-parametric permutation tests were conducted based on the correlation values at each voxel. Non-parametric permutation tests are widely used in imaging (e.g., Nichols and Holmes, 2002). We also confirmed the reliability of our results by assessing whether statistical thresholding of the statistical maps could be used to control the false discovery rate at the conventional 5% level (Benjamini and Hochberg, 1995; Genovese et al., 2002; Lawyer et al., 2009). To visualize effect sizes in the maps, the cumulative distribution function (CDF) of the p-values associated with the intra-class correlations was computed and graphed. The p-values were plotted against those p-values that would be expected from a null distribution, in a Q-Q plot. If the CDF initially rises faster than 20 times the null CDF, there is some non-zero statistical threshold that controls the FDR at the 5% level. For null distributions (where no group differences are detected), these plots are expected to fall approximately along the y=x line. Larger deviations from this line represent larger effect sizes; curves that rise at a rate steeper than y=20x, show that the corresponding maps are significant (in the sense of controlling the FDR) after stringent multiple comparison correction.
As the A/C/E model is difficult to randomize to run permutation tests, the p-values for determining the significance of adding the A and C factors into the model were corrected for multiple comparisons by finding the highest p-value threshold that controlled the False Discovery Rate in the map at 5%, where possible.
2.7 Additional Asymmetry Analyses
In post hoc analyses, we examined whether the degree of asymmetry in the anisotropy measures was associated with the subject’s sex or IQ.
2.7.1 Asymmetry Differences between the Sexes
To determine if there were sex differences in fiber integrity asymmetry, we compared fiber asymmetries in men versus women, based on using the largest possible sample of unrelated subjects. 126 female subjects and 81 male subjects were used for this comparison. Voxel-wise statistics of sex differences were calculated using Student’s t-tests. The false discovery rate was also controlled at the 5% level to correct for multiple comparisons.
2.7.2 Correlations between Asymmetry and IQ
Three measures of intelligence were obtained from each subject; the perceptual intelligence quotient (PIQ), the verbal intelligence quotient (VIQ), and the full scale IQ (FIQ).
Using asymmetry information from the entire group of subjects with IQ information (N=358), statistics were computed at all voxels to correlate the fiber integrity difference across the hemispheres with intellectual performance. We used a random mixed effects regression model for this analysis to account for the familial relation between subjects.
3 Results
3.1 Population-based Average Maps of Diffusion Anisotropy
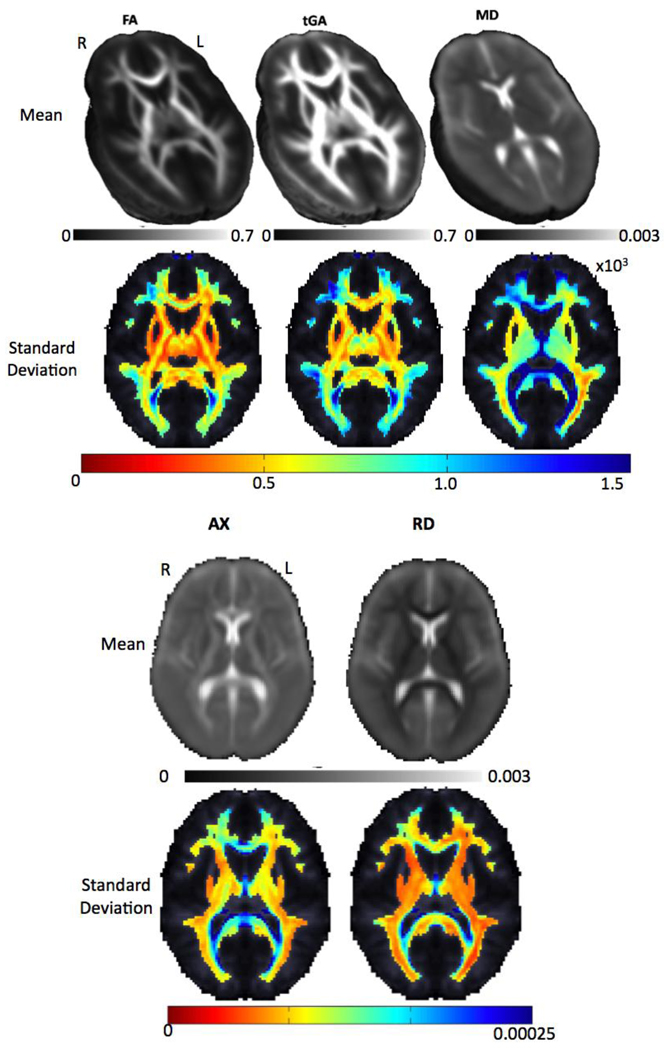
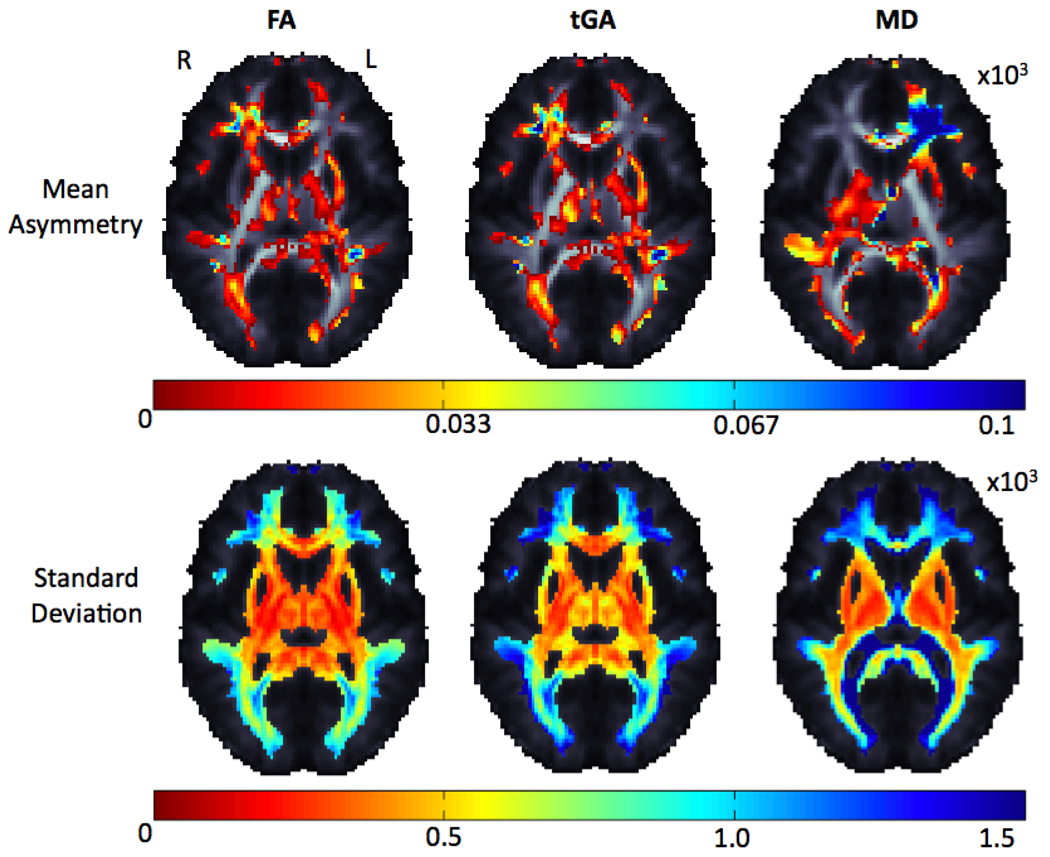
Figure 5 shows average FA, tGA and MD maps for all 207 independent subjects used in this analysis.
Figure 5.
Average and standard deviation maps for FA, tGA, MD, axial and radial diffusivity from the 207 independent subjects used in this analysis. In the FA and tGA maps, fiber anisotropy is higher, as expected, in the deep white matter tracts (corpus callosum, internal capsule and corona radiata), and the variance in the DTI-derived measures is higher in the same regions (blue colors).
3.2 Anisotropy Asymmetry
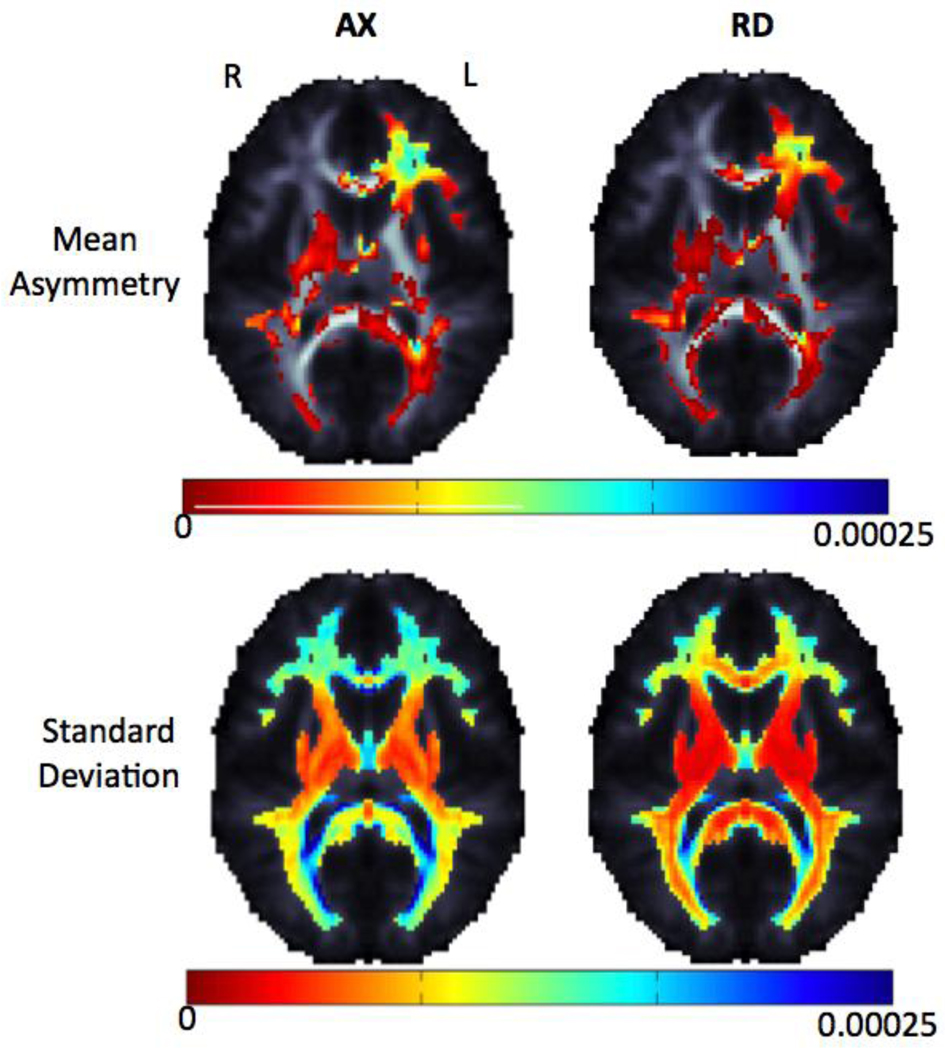
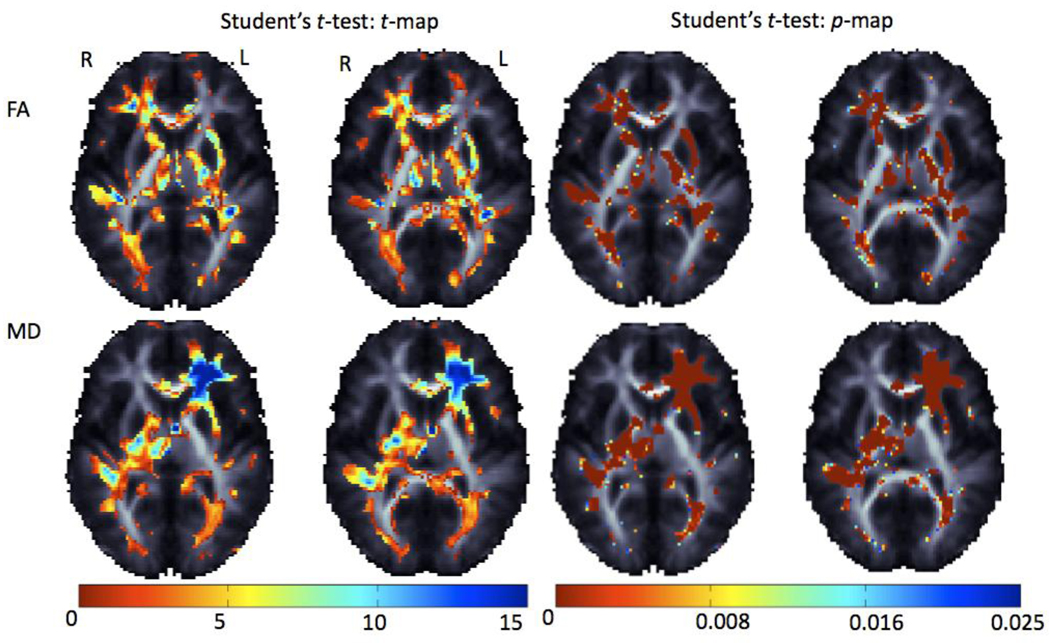
Figure 6 shows the average difference in anisotropy measures between hemispheres. Anisotropy differences exceeded 0.15 in frontal and temporal regions – this number is the difference in the mean FA between left and right hemisphere. FA values run from 0 to 1, so the difference reaches ~1/6 of the allowable range. Percent differences are not shown, to avoid over-emphasizing differences in regions with low anisotropy. Significant asymmetries were detected after using FDR to correct for multiple comparisons, when comparing registered images in their original orientation to their reflected images. The percentage of voxels significant after FDR correction is shown in Table 1. In Figure 7 the pairwise differences calculated from Student's t-test across hemispheres are shown as maps of the t-statistics and associated p-values.
Figure 6.
Average and standard deviation for FA, tGA, mean, axial and radial diffusivity asymmetry (left-right difference) maps are shown for 207 unrelated subjects. Only one twin per pair was used to ensure independent sampling. The dorsolateral pre-frontal cortex (DLPFC) and Meyer’s loop have strong asymmetries; also frontal lobe asymmetry is highly variable (bottom row – blue colors).
Table 1.
FDR was controlled at the 5% level, showing that the observed asymmetries survived a multiple comparison correction, when measured using any index above (FA, tGA, MD). Around half of the white matter (defined as voxels with FA > 0.25) showed a detectable asymmetry.
| FA | tGA | MD | |
|---|---|---|---|
| FDR corrected p-value | 0.0238 | 0.0243 | 0.0283 |
| % significant | 47.69% | 48.62% | 56.68% |
Figure 7.
Pairwise t-tests show regions with inter-hemispheric differences in FA and MD, based on comparing images in their original orientation with their reflected versions. These maps visualize the effect size for the asymmetry (high in the DLPFC and Meyer’s loop). The p-values and absolute value of t are shown from this test – |t| values are as high as 15. Over 50% of the brain’s white matter (Table 1) shows detectable asymmetry.
3.3 Anisotropy Asymmetry Differences between Sexes
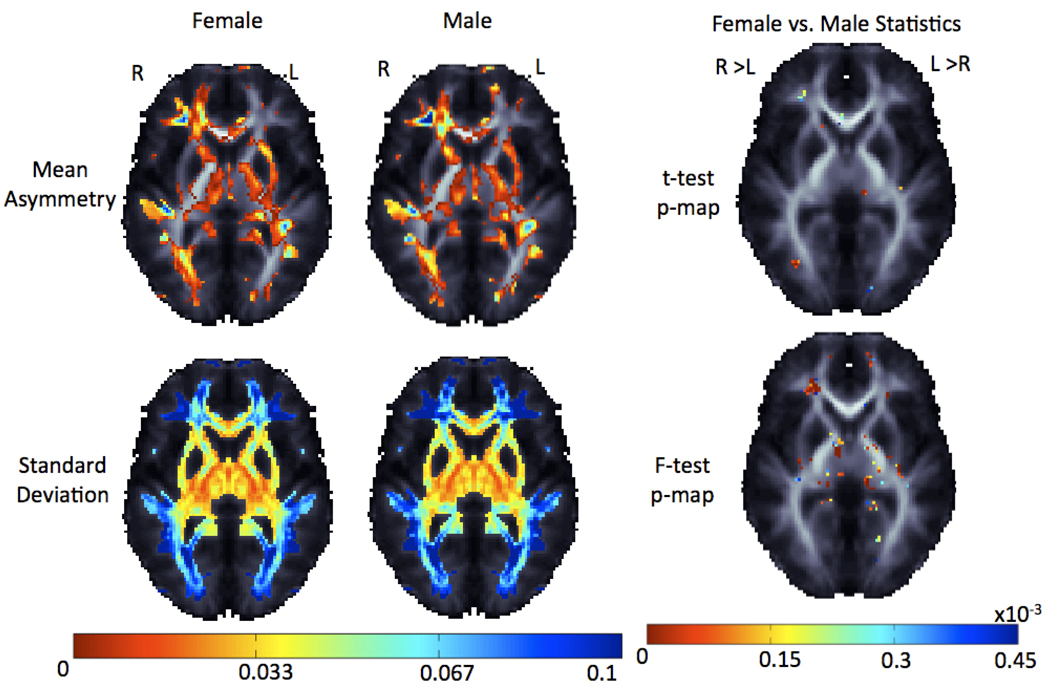
Figure 8 shows the average difference in fiber anisotropy across hemispheres in analyses split by sex. Asymmetry maps for the two sexes were compared, using a map of t-statistics. FDR confirmed sex differences, but very few voxels had sufficient effect sizes to pass the FDR threshold. The percentage of voxels within the brain found to be significant, while still keeping the FDR at 5%, is shown in Table 2, and is less than 1%. This result is formally significant, due to the large sample, but may not be relevant in practice.
Figure 8.
Top row: Average FA asymmetry maps are shown for separate groups of 126 women and 81 men, all unrelated. One twin per pair was used, to ensure independent sampling and avoid including correlated observations. Sex differences (last column) were detected in the degree of fiber asymmetry. Men showed greater asymmetries than women, but these sex differences were detectable in <1% of the brain’s white matter. Bottom row: The standard deviation for asymmetry in each sex is presented along with the resulting p-map after a test for differences in within-group variance. Group differences in the variance of asymmetry are minor, but are more pronounced than the differences in asymmetry intensity itself.
Table 2.
Sex differences in asymmetry. FDR was controlled at the 5% level, as a multiple comparison correction. Even so, <1% of voxels fell below the statistical threshold required to control the FDR.
| FA | tGA | MD | |
|---|---|---|---|
| FDR corrected p-value | 3.232 × 10⁻⁶ | 3.251 × 10⁻⁵ | 3.844 × 10⁻⁴ |
| % significant | 0.0079 % | 0.067 % | 0.781 % |
In a post hoc exploratory analysis, we examined the significance of the variance in fiber asymmetry difference across the sexes using F-tests and found a much greater effect in white matter (FA > 0.25) regions (Table 3).
Table 3.
These maps of differences in the variance of asymmetry between the sexes could be thresholded at the above critical p-values while controlling the FDR at the 5% level, as a multiple comparison correction. There were significant sex differences in the population variance associated with fiber asymmetry (with significantly greater asymmetry variance in men than women in the frontal lobe and in women than men in temporal-parietal regions, on average).
| FA | tGA | MD | |
|---|---|---|---|
| FDR corrected p-value | 0.0032 | 0.0030 | 0.012 |
| % significant | 6.39% | 6.21% | 25.49% |
3.4 Genetics of Fiber Asymmetry
Falconer’s heritability maps were computed from the intraclass correlations of the monozygotic and dizygotic twin pairs (Figure 9). This revealed regions of high heritability for asymmetry in some frontal and temporal lobe regions.
Figure 9.
Intraclass correlation maps for monozygotic and dizygotic twins along with Falconer’s heritability maps for asymmetries in FA, and tGA. In general, monozygotic twins have higher intra-pair correlations than dizygotic twins.
To account for multiple comparisons, non-parametric permutation tests were performed on a voxel by voxel level to avoid assuming parametric null distributions for the statistics. Cumulative distribution functions (CDFs) of the resulting significance values from the ICCs were plotted against their expected null distribution. This reveals which results were significant overall when enforcing a false discovery rate at the 5% level.
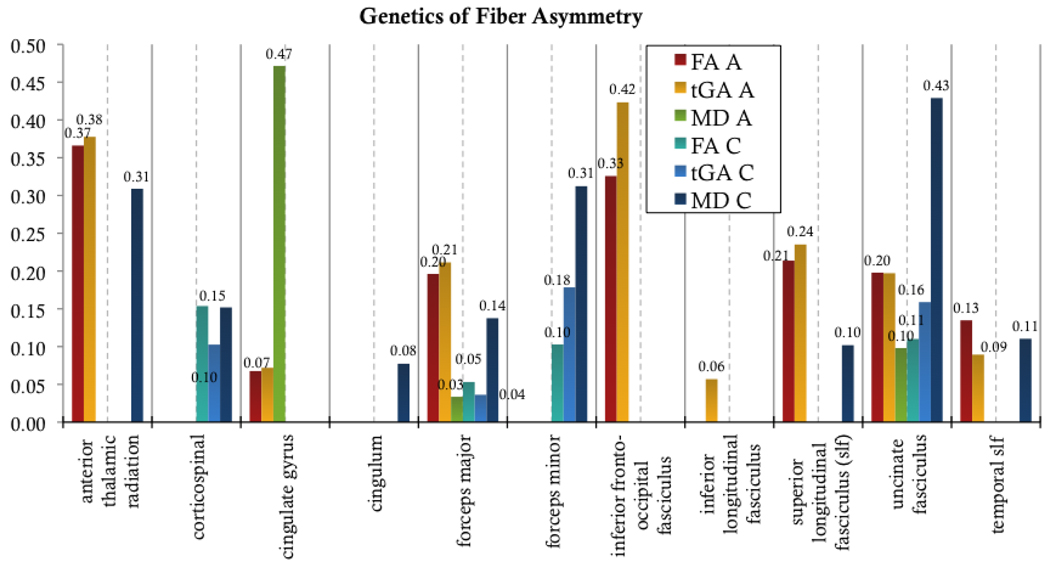
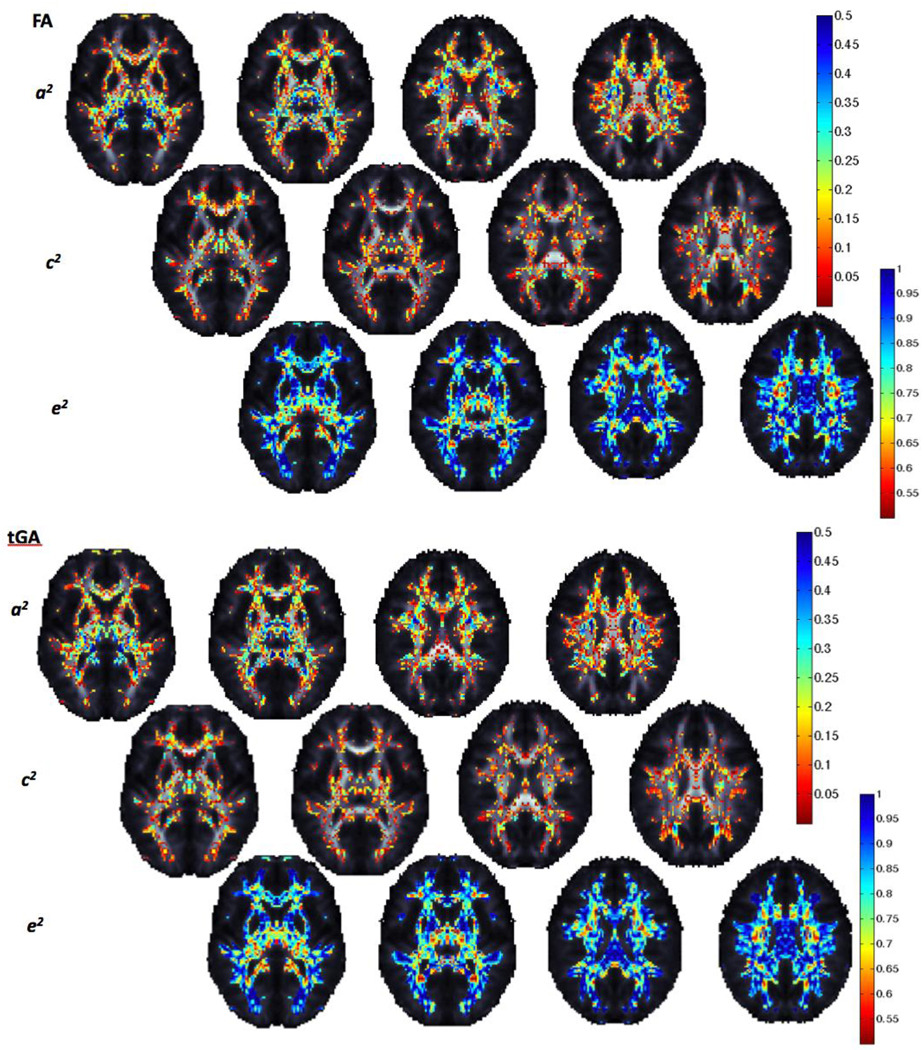
Figure 11 shows an A/C/E analysis of variance components for mean fiber measures in various white matter regions of interest (ROIs). Asymmetries in the inferior fronto-occipital fasciculus and the anterior thalamic radiation are highly genetically influenced (a2=0.33 and a2=0.37 respectively for FA). Both the forceps major and the uncinate fasciculus showed genetic (a2=0.2 and a2=0.2, respectively for FA) and common environmental (c2=0.05 and c2=0.11, respectively for FA) components of variance contributing to asymmetries. In contrast, the cortico-spinal tract and the forceps minor showed larger proportions of asymmetry variance attributable to shared environmental factors.
Figure 11.
A/C/E genetic results for fiber asymmetry per lobe. The proportion of variance (ranging from 0 to 1) due to each factor is shown for each region of interest. Both anisotropy measures show similar trends.
When the goodness-of-fit probability for the ACE model is greater than p = 0.05, it suggests a good fit (note that this is the opposite of the usual p-value convention). All models shown in Figure 11 had a sufficient goodness-of-fit. For a few of the regions tested (not shown), the ACE model did not fit. These included: for FA, the cingulum (p=0.02) and the inferior longitudinal fasciculus (p=0.04) and for MD: the inferior fronto-occipital fasciculus (p=0.02), and the inferior longitudinal fasciculus (p=1×10⁻⁶). All tGA models fitted well.
When determining the overall improvement in the model when we include A (the genetic component) and C (the shared environmental component), genetic influences on fiber asymmetry were highly significant in the frontal lobe (Table 4, 5).
Table 4.
ACE summaries: sub-models (AE and CE) are compared to the full (ACE) model to test whether dropping a parameter resulted in significant differences in the chi-squared goodness-of-fit value.
| tGA | Correlation (95% CI) | Model Fit: χ2(dχ2(df), p) | ACE estimates (%) | |||||||||
|---|---|---|---|---|---|---|---|---|---|---|---|---|
| MZ | DZ | ACE | AE | CE | A | C | E | |||||
| Anterior thalamic radition | 0.44 | (0.34:0.77) | 0.00 | (0:0.44) | 6.34 | 6.34 | (0(1);1.00) | 10.15 | (3.812(1);0.05) | 0.38 | 0.00 | 0.62 |
| Cortico-spinal tract | 0.00 | (0:0.37) | 0.33 | (0.08:0.72) | 7.56 | 8.42 | (0.854(1);0.36) | 7.56 | (0(1);1.00) | 0.00 | 0.10 | 0.90 |
| Cingulate gyrus | 0.12 | (0:0.53) | 0.00 | (0:0.38) | 1.57 | 1.57 | (0(1);1.00) | 1.81 | (0.242(1);0.62) | 0.07 | 0.00 | 0.93 |
| Cingulum | 0.00 | (0:0.21) | 0.00 | (0:0.39) | 6.64 | 6.64 | (0(1);1.00) | 6.64 | (0(1);1.00) | 0.00 | 0.00 | 1.00 |
| Forceps major | 0.27 | (0.05:0.66) | 0.12 | (0:0.57) | 3.17 | 3.18 | (0.009(1);0.92 | 3.44 | (0.263(1);0.61 | 0.21 | 0.04 | 0.75 |
| Forceps minor | 0.12 | (0:0.53) | 0.23 | (0:0.66) | 10.93 | 11.62 | (0.693(1);0.41) | 10.93 | (0(1);1.00) | 0.00 | 0.18 | 0.82 |
| Inferior fronto-occipital fasciculus | 0.43 | (0.33:0.76) | 0.12 | (0:0.57) | 8.47 | 8.47 | (0(1);1.00) | 11.83 | (3.364(1);0.07) | 0.42 | 0.00 | 0.58 |
| Inferior longitudinal fasciculus | 0.11 | (0:0.52) | 0.00 | (0:0.27) | 11.75 | 11.75 | (0(1);1.00) | 11.97 | (0.224(1);0.64) | 0.06 | 0.00 | 0.94 |
| Superior longitudinal fasciculus (slf) | 0.29 | (0.09:0.67) | 0.00 | (0:0.45) | 6.51 | 6.51 | (0(1);1.00) | 7.31 | (0.798(1);0.37) | 0.24 | 0.00 | 0.77 |
| Uncinate fasciculus | 0.36 | (0.22:0.72) | 0.25 | (0:0.67) | 2.83 | 3.07 | (0.242(1);0.62) | 3.14 | (0.312(1);0.58) | 0.20 | 0.16 | 0.64 |
| Temporal slf | 0.12 | (0:0.53) | 0.00 | (0:0.45) | 3.54 | 3.54 | (0(1);1.00) | 3.72 | (0.172(1);0.68) | 0.09 | 0.00 | 0.91 |
Table 5.
FDR was computed from the probability maps for the individual components, p(A), p(C) of the twin A/C/E structural model. Genetic effects were confirmed; environmental effects were also detected.
| P(A) | P(C) | |
|---|---|---|
| FDR corrected p-value for FA | 0.000049 | 0.000048 |
| FDR corrected p-value for tGA | 0.000033 | 0.000037 |
| FDR corrected p-value for MD | - | - |
Voxel-wise A/C/E tests were also performed to estimate the genetic component of variance at each voxel. Voxels in temporal and frontal lobe subregions showed highest genetic influences. Results were similar for both anisotropy measures, although geodesic anisotropy measures gave slightly higher measures of genetic variance than FA.
To account for multiple comparisons in the structural equation models that calculate additive genetic and shared environmental factors at every voxel, the model of the individual component of interest p(A) and p(C) was calculated and FDR was performed on the resulting model to yield the probabilities of significance seen in Table 5.
3.5 Fiber Asymmetry and IQ Correlations
As various measures of intelligence were obtained from all subjects, as a post hoc test we examined possible correlations between fiber FA asymmetry and IQ. For this exploratory test, we hypothesized that greater fiber asymmetry might be associated with higher performance IQ (and performance IQ in particular, which may depend on processing speed more than the linguistic skills involved in verbal IQ). ROI-based and voxel-wise random effects regression models were fitted to the data. We used the entire sample of subjects with available IQ information, fixed the effect of sex, and regressed out the random effects due to familial structure. However, after multiple comparisons correction using FDR in the entire white matter region, no overall correlations were detected across the entire group of 358 subjects. We consider this null finding worth reporting, as the sample size is large for a DTI study.
4 Discussion
Our analysis of DTI asymmetries, in this large population (N=374 adults), had 3 main findings. First, frontal and temporal regions had significant asymmetries in FA. Frontal lobe FA is greater in the right hemisphere, but left temporal lobe FA is greater than on the right. The mean difference in this large sample reached 0.15 (which is very high, considering that FA runs on a scale of 0 to 1). Second, in a regional analysis of FA asymmetry, genetic factors accounted for 33% of the variance in asymmetry in the inferior fronto-occipital fasciculus, 37% of the variance in the anterior thalamic radiation, and 20% of the variance in the forceps major and the uncinate fasciculus. Shared environmental factors accounted for ~15% of the variance in the cortico-spinal tract and ~10% of the variance in the forceps minor. Asymmetries are therefore influenced by both genetic and environmental factors. Results were similar regardless of the anisotropy measure used (FA versus tGA). Finally, the frontal lobe FA asymmetry had higher variance in men than in women, but only a small proportion of voxels showed sex differences in the average level of asymmetry.
As expected from twin studies of brain structure (Brun et al., 2009; Thompson et al., 2001), monozygotic twins showed higher similarities in the intra-class correlation maps than dizygotic twins suggesting that fiber asymmetries are genetically influenced. This is in line with a large body of work by Annett, who proposed that there might be a single “right-shift” gene influencing the degree of cerebral dominance and lateralized behavior such as handedness (Annett, 1998).
A preliminary map of heritability, based on Falconer’s heritability formula (Figure 9), crudely estimates the genetic proportion of variance as twice the difference between the monozygotic twin correlations and the dizygotic twin correlations. As this initial analysis detected genetic involvement in fiber asymmetry, we fitted structural equation models to data from lobar regions of interest. A large proportion of the variance in fiber asymmetry in the sample is due to genetic factors in the frontal lobes, but not elsewhere in the brain. Voxelwise genetic models confirmed the genetic effects on the frontal lobe asymmetries, and also suggested high genetic contributions in some temporal lobe regions. The temporal lobe effects did not reach significance in the lobar analyses, and require replication.
Regions with high genetic contributions to fiber asymmetry (frontal lobes) were also the regions where asymmetry is greatest. The finding that frontal lobe FA is greater in the right hemisphere, but greater on the left for the temporal lobes, confirm prior DTI reports of frontal and temporal white matter asymmetries. In general, prior studies focused on specific tracts, e.g., the corticospinal tract (Westerhausen et al., 2007) and the arcuate fasciculus, which is involved in language processing (de Jong et al., 2009; Rodrigo et al., 2007). A voxelwise analysis (Buchel et al., 2004) suggested left greater than right FA white matter asymmetries in the arcuate fasciculus and found asymmetries contralateral to the dominant hand (i.e., higher on the left in right-handers) in tracts innervating the precentral gyrus (as expected, given the crossing of the cortical motor circuitry). Frontal and temporal white matter already show left greater than right FA in early infancy (Dubois et al., 2008), suggesting greater myelination in the left hemisphere. Some developmental studies found that frontal FA differences between the two hemispheres diminish as the brain develops, but temporal lobe asymmetries persist (Barnea-Goraly et al., 2005). These asymmetries may relate to the functional lateralization of higher-level cognitive processes such as spatial association and language, but our regressions with global cognitive measures did not reveal any associations.
Early studies of anatomical asymmetry noted a natural petalia (torquing) of the brain, that shifts right hemisphere structures anterior to their left hemisphere counterparts (Kimura, 1973; Toga and Thompson, 2003). Post mortem studies found volumetric asymmetries in the planum temporale, part of a temporal lobe auditory and language processing area (Geschwind and Levitsky, 1968). More recently, a large MRI study of 142 young adults confirmed leftward volume asymmetries in posterior language areas, and rightward asymmetries in the cingulate gyrus and caudate nucleus (Watkins et al., 2001). Surface-based analysis methods that adjust for the effects of structural translocation in space (e.g., torquing) also found leftward asymmetries in the Heschl’s gyrus and planum temporale (Lyttelton et al., 2009). Deformation-based morphometry studies have used the theory of random Gaussian vector fields to detect brain asymmetries, and have been used to detect statistical departures from the normal level of brain asymmetry (also termed “dissymmetry”; Thirion et al., 2000; Lancaster et al., 2003). In addition, some “apparently” lateralized effects in brain mapping may arise due to hemispheric differences in the statistical power to detect effects. This is inevitable, as the structures in the two hemispheres have different patterns of anatomical variability (Thompson et al., 1998; Fillard et al., 2006).
FA asymmetry had a higher variance in men than women, but there was only limited evidence for differences in the overall level of asymmetry (i.e., the sex difference formally passed the FDR criterion for significance but showed differences in less than 1% of the brain). Many studies report greater anatomical asymmetries in men than women (reviewed in Toga and Thompson, 2003). A voxel-based MRI study of 465 normal adults found sex differences in gray matter volumes and concentrations but no effects of handedness on the level of asymmetries (Good et al., 2001). In a small sample (N=20), Szeszko et al. (2003) reported that women had higher FA in the left frontal lobes compared to men, and a general leftward asymmetry of FA. No hemispheric asymmetry was detected in men. The level of leftward asymmetry in women was associated with better verbal comprehension and memory functioning. This result is surprising, given our finding of strong R>L asymmetry for FA; the magnitude of this effect is quite large in our much larger sample of subjects. Our finding of significant but limited sex differences could be due to our efforts to create a template that minimizes the structural differences between the hemispheres. This reduces the influence of “brain shape” on the asymmetries, which may have diminished any sex differences.
With fMRI, Shaywitz et al. (1995) found significant sex differences in the phonological processing of language. Brain activation in men was lateralized to the left inferior frontal gyrus, while women engaged more diffuse neural systems involving both the left and right inferior frontal gyri. Men and women also have brain regions in which regional volumes correlate with intelligence. Haier et al. (2005) found that women showed more white matter and fewer gray matter areas with volumes correlated with intelligence, when compared to men. IQ correlates with FA in normal subjects, and both IQ and FA are genetically influenced (Chiang et al., 2009a,b; Kochunov et al., 2009). Because of this, we also regressed FA asymmetry against IQ, but no correlations survived FDR correction. IQ may relate closely to FA in specific brain regions, but not so much to its asymmetry.
A premise of any voxel-wise analysis of brain asymmetry is that there is a structural homology between white matter structures in the left and right hemispheres. For the major white matter tracts, such as the corpus callosum, fornix, and optic radiations, this assumption is tenable. The registration methods proposed here are likely to adjust for any macroscopic shape differences that get in the way of pairing homologous anatomy, where it exists, on both sides of the brain. Even so, as in all studies mapping brain asymmetry, there will always be a set of structures – cortical U-fibers for example – with no obvious homologs in the other hemisphere. As such, differences in hemispheric anatomy near the cortex may reflect not just a signal difference from the same structure occurring in both hemispheres but a lack of homology. These cases may ultimately be distinguishable with tools that model and cluster each hemisphere’s tracts as a graph, with known connectivity and topological relations; in that case, differences in tract composition between hemispheres would be easier to identify.
Methodological sources of variance in DTI data may also contribute to the level of asymmetries seen here. Magnetic susceptibility gradients occur at interfaces where tissue and air are in close proximity, and these are known to cause geometric distortions in the frontal and temporal poles. If severe, these distortions can cause a complete loss of signal, but in most cases they only lead to a geometrical warping of the data that can be corrected; here, we adjusted for it by using a mutual-information based 3D elastic warping approach. In individual cases, this distortion could contribute to the level of asymmetry in the DTI signal, and to its variance, but it is unlikely to produce a systematic pattern of asymmetry that favors the left or the right side of the brain. Maps such as Figure 8 (the mean asymmetry of FA) are unlikely to be affected much by susceptibility effects. These artifacts may contribute somewhat to the variance in asymmetry, slightly depleting the true biological correlations across members of a twin pair. Such artifacts would be lumped into the E-term of our structural equation model (which contains variance due to methodological error).
In addition, while the maps of DTI-derived measures (such as FA) were spatially normalized across subjects, no global intensity normalization was performed. We used each subject’s raw FA measures and did not adjust them for overall differences in mean FA between subjects. In group analyses of PET scans, individual data are commonly adjusted for overall (global) levels of activation or ligand binding, but this is not typically done in DTI studies. It is assumed that the FA is an absolute measure of fiber coherence, that is associated with physiological parameters such as axonal conduction speed, and with cognitive measures such as IQ. As a result, global normalization is not usually applied as the raw values are thought to provide a fundamental measure of fiber coherence. Even so, it is possible that local differences may, in part, reflect global differences in FA, or its asymmetry, across subjects.
Our study had 3 main limitations. First, we registered the FA images to a population averaged template created from the subjects’ FA images. The same registrations, based on the FA images, were applied to all the DTI-derived maps, allowing us to structurally align all the images in the same way. Even so, there may be a slight bias in using a single anisotropy measure to drive the nonlinear registration, and other measures could be used, individually or in combination (Park et al., 2003, 2004). Several nonlinear registration algorithms have been proposed for DTI. Studholme (2008) used DTI-derived measures as constraints when aligning standard anatomical images. Chiang et al. (2008) and Li et al. (2009) used orientation and multivariate information in the full diffusion tensor to find correspondences between DTI images.
Second, in this paper, we used voxel-based statistical maps, focusing on highly anisotropic white matter regions. Other approaches may also be helpful for selecting regions with high anisotropy, such as the tract-based spatial statistics method (TBSS: Smith et al., 2006). In TBSS, a skeletonized (one pixel thick) map of the FA is created, and correspondences across subjects are based on distance, rather than by computing a correspondence field for the entire image. A third limitation of our study is that we do not fully exploit the angular information in the 105-direction diffusion-weighted images. Asymmetries in local diffusion geometry could also be examined by analyzing the local 3D diffusion profile, reconstructed using angular space deconvolution methods such as the tensor distribution function (Leow et al., 2008). This could further probe the sources of asymmetry after adjusting for confounds due to the partial voluming and fiber crossings -- an inherent limitation of scalar DTI-derived measures. One could then distinguish whether the right greater than left asymmetries are due to higher fiber integrity in the right hemisphere or whether the anisotropy levels on the left are reduced due to a higher level of fiber crossings.
Figure 4.
Path diagram showing how various components in the structural equation model are related between each twin in a pair. α values are the only parameters that differ for each type of twin: α=1 for the MZ group and α=0.5 for the DZ group. Registration and measurement errors are included as part of the E component.
Figure 10.
CDF plots of the distribution of the p-values obtained after non-parametric permutation testing, to account for multiple comparisons. For all measures, MZ and DZ twins showed significant intraclass correlations after multiple comparison correction using FDR. The MZ twin effects were much greater as denoted by the higher FDR-controlling critical p-values (i.e., the highest non-zero x-coordinate where the CDF crosses the y=20x line). These probabilities were obtained from pre-selected brain regions with average FA > 0.25, to avoid analyzing voxels with very low anisotropy.
Figure 12.
Voxelwise genetic analysis using the A/C/E model shows that most of the asymmetry in fiber integrity is attributable to unique environmental influences, random differences, and measurement error; in some frontal and temporo-parietal regions, ~50% of the differences across hemispheres are due to genetic differences. Geodesic anisotropy measures may be marginally better for detecting genetic effects on fiber asymmetry, but maps for both DTI-derived indices were very similar.
Acknowledgments
This study was supported by grant number RO1 HD050735 from the National Institute of Child Health and Human Development, USA, T15 LM07356 from the NIH/National Library of Medicine, and Project Grant 496682 from the National Health and Medical Research Council, Australia. Additional support for algorithm development was provided by the NIA, NIBIB, and the National Center for Research Resources (EB008432, EB008281, EB007813, AG016570, RR013642 to PT). Zygosity typing was supported by the Australian Research Council (A7960034, A79906588, A79801419, DP0212016). We are extremely grateful to the twins for their participation, to the radiographer, Matt Meredith, Centre for Magnetic Resonance, University of Queensland, for image acquisition, and research nurses, Marlene Grace and Ann Eldridge, Queensland Institute of Medical Research, for twin recruitment.
Footnotes
Publisher's Disclaimer: This is a PDF file of an unedited manuscript that has been accepted for publication. As a service to our customers we are providing this early version of the manuscript. The manuscript will undergo copyediting, typesetting, and review of the resulting proof before it is published in its final citable form. Please note that during the production process errors may be discovered which could affect the content, and all legal disclaimers that apply to the journal pertain.
References
- Annett M. Handedness and cerebral dominance: the right shift theory. J Neuropsychiatry Clin Neurosci. 1998;10(4):459–469. doi: 10.1176/jnp.10.4.459. [DOI] [PubMed] [Google Scholar]
- Annett M. A classification of hand preference by association analysis. British Journal of Psychology. 1970;61:303–321. doi: 10.1111/j.2044-8295.1970.tb01248.x. [DOI] [PubMed] [Google Scholar]
- Ardekani S, Kumar A, Bartzokis G, Sinha U. Exploratory voxel-based analysis of diffusion indices and hemispheric asymmetry in normal aging. Magnetic Resonance Imaging. 2007;25(2):154–167. doi: 10.1016/j.mri.2006.09.045. [DOI] [PubMed] [Google Scholar]
- Arsigny V, Fillard P, Pennec X, Ayache N. Log-Euclidean metrics for fast and simple calculus on diffusion tensors. MRM. 2006;56(2):411–421. doi: 10.1002/mrm.20965. [DOI] [PubMed] [Google Scholar]
- Ashburner J, Friston KJ. Voxel-based morphometry–the methods. NeuroImage. 2000;11(6):805–821. doi: 10.1006/nimg.2000.0582. [DOI] [PubMed] [Google Scholar]
- Barnea-Goraly N, Menon V, Eckert M, Tamm L, Bammer R, Karchemskiy A, Dant CC, Reiss AL. White matter development during childhood and adolescence: A cross-sectional diffusion tensor imaging study. Cereb. Cortex. 2005;15(12):1848–1854. doi: 10.1093/cercor/bhi062. [DOI] [PubMed] [Google Scholar]
- Basser PJ, Mattiello J, Bihan DL. Estimation of the effective self-diffusion tensor from the NMR spin echo. Journal of Magnetic Resonance B. 1994;103:247–254. doi: 10.1006/jmrb.1994.1037. [DOI] [PubMed] [Google Scholar]
- Basser PJ, Pierpaoli C. Microstructural and physiological features of tissues elucidated by quantitative-diffusion-tensor MRI. J Magn Reson B. 1996;111:209–219. doi: 10.1006/jmrb.1996.0086. [DOI] [PubMed] [Google Scholar]
- Batchelor P, Moakher M, Atkinson D, Calamante F, Connelly A. A rigorous framework for diffusion tensor calculus. Magnetic Resonance in Medicine. 2005;53:221–226. doi: 10.1002/mrm.20334. [DOI] [PubMed] [Google Scholar]
- Beaton AA. The relation of planum temporale asymmetry and morphology of the corpus callosum to handedness, gender and dyslexia: A review of the evidence. Brain and Language. 1997;60:255–322. doi: 10.1006/brln.1997.1825. [DOI] [PubMed] [Google Scholar]
- Beaulieu C. The basis of anisotropic water diffusion in the nervous system - a technical review. NMR Biomed. 2002;15:435–455. doi: 10.1002/nbm.782. [DOI] [PubMed] [Google Scholar]
- Benjamini Y, Hochberg Y. Controlling the false discovery rate: A practical and powerful approach to multiple testing. Journal of the Royal Statistical Society, Series B (Methodological) 1995;57(1):289–300. [Google Scholar]
- Brun CC, Leporé N, Pennec X, Lee AD, Barysheva M, Madsen SK, Avedissian C, Chou YY, de Zubicaray GI, McMahon K, Wright MJ, Toga AW, Thompson PM. Mapping the Regional Influence of Genetics on Brain Structure Variability - A Tensor-Based Morphometry Study. NeuroImage. 2009 doi: 10.1016/j.neuroimage.2009.05.022. in press, July 2009. [DOI] [PMC free article] [PubMed] [Google Scholar]
- Buchel C, Raedler T, Sommer M, Sach M, Weiller C, Koch M. White Matter Asymmetry in the Human Brain: A Diffusion Tensor MRI Study. Cereb. Cortex. 2004;14(9):945–951. doi: 10.1093/cercor/bhh055. [DOI] [PubMed] [Google Scholar]
- Chiang MC, Leow AD, Dutton RA, Barysheva M, Rose S, McMahon KL, de Zubicaray GI, Toga AW, Thompson PM. Fluid Registration of Diffusion Tensor Images Using Information Theory. IEEE Transactions on Medical Imaging. 2008 Apr;27(4):442–456. doi: 10.1109/TMI.2007.907326. 2008. [DOI] [PMC free article] [PubMed] [Google Scholar]
- Chiang MC, Barysheva M, Lee AD, Madsen S, Klunder A, Toga AW, McMahon KL, de Zubicaray G, Wright M, Srivastava A, Balov N, Thompson PM. Genetics of brain fiber architecture and intelligence. Journal of Neuroscience. 2009 Feb 18;29(7):2212–2224. doi: 10.1523/JNEUROSCI.4184-08.2009. 2009. [DOI] [PMC free article] [PubMed] [Google Scholar]
- Chiang MC, Avedissian C, Barysheva M, Toga AW, McMahon KL, de Zubicaray GI, Wright MJ, Thompson PM. Extending Genetic Linkage Analysis to Diffusion Tensor Images to Map Single Gene Effects on Brain Fiber Architecture. Medical Image Computing and Computer Assisted Intervention (MICCAI2009) 2009:506–513. doi: 10.1007/978-3-642-04271-3_62. [DOI] [PubMed] [Google Scholar]
- Chou YY, Lepore N, Chiang MC, Avedissian C, Barysheva M, McMahon KL, de Zubicaray GI, Meredith M, Wright MJ, Toga AW, Thompson PM. Mapping Genetic Influences on Ventricular Structure in Twins. Neuroimage. 2009;44:1312–1323. doi: 10.1016/j.neuroimage.2008.10.036. [DOI] [PMC free article] [PubMed] [Google Scholar]
- Crow TJ. Temporal Lobe Asymmetries as the Key to the Etiology of Schizophrenia. Schizophr Bull. 1990;16(3):433–443. doi: 10.1093/schbul/16.3.433. [DOI] [PubMed] [Google Scholar]
- de Jong L, Kovacs S, Bamps S, Calenbergh FV, Sunaert S, van Loon J. The arcuate fasciculus: a comparison between diffusion tensor tractography and anatomy using the fiber dissection technique. Surgical Neurology. 2009;71(1):153–153. [Google Scholar]
- de Zubicaray GI, Chiang MC, McMahon K, Shattuck D, Toga AW, Martin N, Wright MJ, Thompson PM. Meeting the challenges of neuroimaging genetics. Brain Imaging and Behavior. 2008;2(4):258–263. doi: 10.1007/s11682-008-9029-0. [DOI] [PMC free article] [PubMed] [Google Scholar]
- Dubois J, Hertz-Pannier L, Cachia A, Le Bihan DL, Dehaene-Lambertz G. Structural asymmetries in the infant language and sensori-motor networks. Cerebral Cortex. 2008;19(2):414–423. doi: 10.1093/cercor/bhn097. [DOI] [PubMed] [Google Scholar]
- Eckert MA, Galaburda AM, Karchemskiy A, Liang A, Thompson PM, Dutton RA, Lee AD, Bellugi U, Korenberg JR, Mills DL, Rose F, Reiss AL. Anomalous Sylvian Fissure Morphology in Williams Syndrome. NeuroImage. 2006 doi: 10.1016/j.neuroimage.2006.05.062. published online, July 28 2006. [DOI] [PubMed] [Google Scholar]
- Falconer D, Mackay TF. Introduction to Quantitative Genetics. 4th Edition. Addison Wesley Longman (Pearson Education); 1995. [Google Scholar]
- Fillard P, Arsigny W, Pennec X, Hayashi KM, Thompson PM, Ayache N. Measuring Brain Variability by Extrapolating Sparse Tensor Fields Measured on Sulcal Lines. NeuroImage. 2006 Nov 17;:2006. doi: 10.1016/j.neuroimage.2006.09.027. [DOI] [PubMed] [Google Scholar]
- Fillard P, Arsigny V, Pennec X, Ayache N. Clinical DT-MRI estimation, smoothing and fiber tracking with Log-Euclidean metrics. Biomedical Imaging: Nano to Macro, 2006; 3rd IEEE International Symposium on; 2006. pp. 786–789. [DOI] [PubMed] [Google Scholar]
- Fletcher PT, Joshi S. ECCV Workshops CVAMIA and MMBIA. Springer-Verlag: 2004. Principal geodesic analysis on symmetric spaces: Statistics of diffusion tensors; pp. 87–98. (2004) 87–98. [Google Scholar]
- Genovese CR, Lazar NA, Nichols T. Thresholding of statistical maps in functional neuroimaging using the false discovery rate. NeuroImage. 2002;15(4):870–878. doi: 10.1006/nimg.2001.1037. [DOI] [PubMed] [Google Scholar]
- Geschwind N, Levitsky W. Human brain: Left-right asymmetries in temporal speech region. Science. 1968;161(3837):186–187. doi: 10.1126/science.161.3837.186. [DOI] [PubMed] [Google Scholar]
- Good CD, Johnsrude I, Ashburner J, Henson RNA, Friston KJ, Frackowiak RSJ. Cerebral asymmetry and the effects of sex and handedness on brain structure: A voxel-based morphometric analysis of 465 normal adult human brains. NeuroImage. 2001;14(3):685–700. doi: 10.1006/nimg.2001.0857. [DOI] [PubMed] [Google Scholar]
- Hamilton LS, Narr KL, Luders E, Szeszko PR, Thompson PM, Bilder RM, Toga AW. Asymmetries of cortical thickness: Effects of handedness, sex, and schizophrenia. NeuroReport. 2007 Sep 17;18(14):1427–1431. doi: 10.1097/WNR.0b013e3282e9a5a2. 2007. [DOI] [PMC free article] [PubMed] [Google Scholar]
- Hellige JB. Hemispheric Asymmetry: What’s Right and What’s Left. (Perspectives in Cognitive Neuroscience) Harvard University Press; 1993. [Google Scholar]
- Haier RJ, Jung RE, Yeo RA, Head K, Alkire MT. The neuroanatomy of general intelligence: sex matters. NeuroImage. 2005;25(1):320–327. doi: 10.1016/j.neuroimage.2004.11.019. [DOI] [PubMed] [Google Scholar]
- Hulshoff Pol HE, Schnack HG, Posthuma D, Mandl RCW, Baare WF, Van Oel CJ, Van Haren NE, Collins DL, Evans AC, Amunts K, Burgel U, Zilles K, de Geus E, Boomsma DI, Kahn RS. Genetic Contributions to Human Brain Morphology and Intelligence. Journal of Neuroscience. 2006;26:10235, 10242. doi: 10.1523/JNEUROSCI.1312-06.2006. [DOI] [PMC free article] [PubMed] [Google Scholar]
- Huang H, Ceritoglu C, Li X, Qiu A, Miller MI, van Zijl PCM, Mori S. Correction of B0 susceptibility induced distortion in diffusion-weighted images using large-deformation diffeomorphic metric mapping. Magnetic resonance imaging. 2008;26(9):1294–1302. doi: 10.1016/j.mri.2008.03.005. [DOI] [PMC free article] [PubMed] [Google Scholar]
- Jahanshad N, Lee AD, Chou Y, Lepore N, Brun C, Barysheva M, Toga AW, McMahon K, de Zubicaray G, Wright M, Thompson PM. Medical Image Computing and Computer-Assisted Intervention. MICCAI - 2009. 2009. Genetics of anisotropy asymmetry: Registration and sample size effects; pp. 498–505. [DOI] [PubMed] [Google Scholar]
- Jones DK, Horsfield MA, Simmons A. Optimal strategies for measuring diffusion in anisotropic systems by magnetic resonance imaging. Magn Reson Med. 1999 September;42(3):515–525. [PubMed] [Google Scholar]
- Kimura D. The asymmetry of the human brain. Scientific American. 1973;228(3):70–78. doi: 10.1038/scientificamerican0373-70. [DOI] [PubMed] [Google Scholar]
- Klingberg T, Hedehus M, Temple E, Salz T, Gabrieli JD, Moseley ME, Poldrack RA. Microstructure of temporo-parietal white matter as a basis for reading ability: evidence from diffusion tensor magnetic resonance imaging. Neuron. 2000;25:493–500. doi: 10.1016/s0896-6273(00)80911-3. [DOI] [PubMed] [Google Scholar]
- Kochunov P, Glahn DC, Lancaster JL, Winkler AM, Smith S, Thompson PM, Almasy L, Duggirala R, Fox PT, Blangero J. Genetics of microstructure of cerebral white matter using diffusion tensor imaging. Neuroimage. 2010 doi: 10.1016/j.neuroimage.2010.01.078. [DOI] [PMC free article] [PubMed] [Google Scholar]
- Kochunov P, Lancaster JL, Thompson PM, Toga AW, Brewer P, Hardies J, Fox P. An optimized individual target brain in the Talairach coordinate system. NeuroImage. 2002;17(2):922–927. [PubMed] [Google Scholar]
- Kochunov P, Lancaster JL, Thompson PM, Woods R, Mazziotta J, Hardies J, Fox P. Regional spatial normalization: toward an optimal target. J Comput Assist Tomogr. 2001;25(5):805–816. doi: 10.1097/00004728-200109000-00023. [DOI] [PubMed] [Google Scholar]
- Koziol JA, Wagner S, Sobel DF, Feng AC, Adams HP. Asymmetries in the spatial distributions of enhancing lesions and black holes in relapsing-remitting ms. Journal of Clinical Neuroscience. 2005;12(8):895–901. doi: 10.1016/j.jocn.2004.11.010. [DOI] [PubMed] [Google Scholar]
- Lancaster JL, Kochunov PV, Thompson PM, Toga AW, Fox PT. Asymmetry of the Brain Surface from Deformation Field Analysis. Human Brain Mapping. 2003 June;19(2):79–89. doi: 10.1002/hbm.10105. 2003. [DOI] [PMC free article] [PubMed] [Google Scholar]
- Lawyer G, Ferkingstad E, Nesvag R, Varnas K, Agartz I. Local and covariate-modulated false discovery rates applied in neuroimaging. NeuroImage. 2009 doi: 10.1016/j.neuroimage.2009.03.047. 2009.03.047. [DOI] [PubMed] [Google Scholar]
- Lee AD, Leporé N, Barysheva M, Chou YY, Brun C, Madsen SK, McMahon K, de Zubicaray GI, Wright MJ, Toga AW, Thompson PM. Gene effects mapped using fractional and geodesic anisotropy in diffusion tensor images of 92 monozygotic and dizygotic twins. MICCAI 2008. 2008 doi: 10.1109/ISBI.2008.4541153. [DOI] [PMC free article] [PubMed] [Google Scholar]
- Lee AD, Lepore N, Brun CC, Chou YY, Barysheva M, Chiang MC, Madsen SK, de Zubicaray GI, McMahon KL, Wright MJ, Toga AW, Thompson PM. Tensor-Based Analysis of Genetic Influences on Brain Integrity using DTI in 100 Twins. Medical Image Computing and Computer Assisted Intervention (MICCAI2009) 2009:967–974. doi: 10.1007/978-3-642-04268-3_119. [DOI] [PubMed] [Google Scholar]
- Lee K, Yoshida T, Kubicki M, Bouix S, Westin CF, Kindlmann G, Niznikiewicz M, Cohen A, McCarley RW, Shenton ME. Increased diffusivity in superior temporal gyrus in patients with schizophrenia: A diffusion tensor imaging study. Schizophrenia Research. 2009;108(1–3):33–40. doi: 10.1016/j.schres.2008.11.024. [DOI] [PMC free article] [PubMed] [Google Scholar]
- Leow AD, Zhu S, Zhan L, McMahon K, de Zubicaray GI, Meredith M, Wright MJ, Toga AW, Thompson PM. The tensor distribution function. Magnetic Resonance in Medicine. 2008;18(61(1)):205–214. doi: 10.1002/mrm.21852. [DOI] [PMC free article] [PubMed] [Google Scholar]
- Leow AD, Huang SC, Geng A, Becker JT, Davis SW, Toga AW, Thompson PM. Inverse Consistent Mapping in 3D Deformable Image Registration: Its Construction and Statistical Properties. IPMI. 2005:493–503. doi: 10.1007/11505730_41. 2005. [DOI] [PubMed] [Google Scholar]
- Leporé N, Brun C, Chiang MC, Chou YY, Dutton R, Hayashi K, Lopez O, Aizenstein H, Toga AW, Becker J, Thompson PM. Medical Image Computing and Computer-Assisted Intervention. MICCAI; 2006. Multivariate statistics of the Jacobian matrices in tensor based morphometry and their application to HIV/AIDS; pp. 191–198. 2006. [DOI] [PubMed] [Google Scholar]
- Leporé N, Chou YY, Lopez OL, Aizenstein HJ, Becker JT, Toga AW, Thompson PM. Medical Imaging 2008: Physiology, Function, and Structure from Medical Images. Vol. 6916. San Diego, CA, USA.: SPIE; 2008. Fast 3D fluid registration of brain magnetic resonance images. [DOI] [PMC free article] [PubMed] [Google Scholar]
- Leporé N, Brun CC, Chou YY, Lee AD, Barysheva M, de Zubicaray GI, Meredith M, McMahon K, Wright MJ, Toga AW, Thompson PM. Multi-Atlas Tensor-Based Morphometry and its Application to a Genetic Study of 92 Twins. MICCAI; 2008. [DOI] [PMC free article] [PubMed] [Google Scholar]
- Li H, Xue Z, Guo L, Wong ST. Simultaneous Consideration of Spatial Deformation and Tensor Orientation in Diffusion Tensor Image Registration Using Local Fast Marching Patterns. In: Prince JL, Pham DL, Myers KJ, editors. Proceedings of the 21st international Conference on information Processing in Medical Imaging; July 05 – 10, 2009; Williamsburg, Virginia. Berlin, Heidelberg: Springer-Verlag; 2009. pp. 63–75. Lecture Notes In Computer Science. [DOI] [PubMed] [Google Scholar]
- Lin JJ, Salamon N, Lee AD, Dutton RA, Geaga JA, Hayashi KM, London ED, Luders E, Toga AW, Engel J, Thompson PM. Reduced Neocortical Thickness and Complexity Mapped in Mesial Temporal Lobe Epilepsy with Hippocampal Sclerosis. Cerebral Cortex. 2006 Nov 6; doi: 10.1093/cercor/bhl109. 2006. [DOI] [PubMed] [Google Scholar]
- Liu Z, Zhu H, Marks BL, Katz LM, Goodlett CB, Gerig G, Styner M. Voxel-wise Group Analysis of DTI. Proceedings of the 6th IEEE International Symposium on Biomedical Imaging: From Nano to Macro; 2009. pp. 807–810. [DOI] [PMC free article] [PubMed] [Google Scholar]
- Luders E, Rex DE, Narr KL, Woods RP, Jancke L, Thompson PM, Mazziotta JC, Toga AW. Relationships between Sulcal Asymmetries and Corpus Callosum Size: Gender and Handedness Effects. Cerebral Cortex. 2003 Oct;13(10):1084–1093. doi: 10.1093/cercor/13.10.1084. 2003. [DOI] [PubMed] [Google Scholar]
- Luders E, Narr KL, Thompson PM, Rex DE, DeLuca H, Jancke L, Toga AW. Hemispheric Asymmetries in Cortical Thickness. Cerebral Cortex. 2005 Nov. 2:2005. doi: 10.1093/cercor/bhj064. [DOI] [PubMed] [Google Scholar]
- Luders E, Narr KL, Thompson PM, Toga AW. Neuroanatomical correlates of intelligence. Intelligence. 2009;37(2):156–163. doi: 10.1016/j.intell.2008.07.002. [DOI] [PMC free article] [PubMed] [Google Scholar]
- Lyttelton OC, Karama S, Ad-Dab’bagh Y, Zatorre RJ, Carbonell F, Worsley K, Evans AC. Positional and surface area asymmetry of the human cerebral cortex. NeuroImage. 2009 doi: 10.1016/j.neuroimage.2009.03.063. [DOI] [PubMed] [Google Scholar]
- Mori S, Zhang J. Principles of diffusion tensor imaging and its applications to basic neuroscience research. Neuron. 2006;51(5):527–539. doi: 10.1016/j.neuron.2006.08.012. [DOI] [PubMed] [Google Scholar]
- Morra J, Tu Z, Apostolova LG, Green AE, Avedissian C, Madsen SK, Parikshak N, Hua X, Toga AW, Jack CR, Schuff N, Weiner MW, Thompson PM. Automated 3D Mapping of Hippocampal Atrophy and its Clinical Correlates in 400 Subjects with Alzheimer's Disease, Mild Cognitive Impairment, and Elderly Controls. Human Brain Mapping. 2009 Jan 26; doi: 10.1002/hbm.20708. 2009. [DOI] [PMC free article] [PubMed] [Google Scholar]
- Mori S, Wakana S, Nagae-Poetscher LM, van Zijl PCM. MRI Atlas of Human White Matter. Amsterdam, The Netherlands: Elsevier; 2005. (2005) [Google Scholar]
- Mühlau M, Gaser C, Wohlschläger AM, Weindl A, Städtler M, Valet M, Zimmer C, Kassubek J, Peinemann A. Striatal gray matter loss in Huntington’s disease is leftward biased. Movement Disorders. 2007;22(8):1169–1173. doi: 10.1002/mds.21137. 10.1002/mds.21137. [DOI] [PubMed] [Google Scholar]
- Narr KL, Bilder RM, Luders E, Thompson PM, Woods RP, Robinson D, Szeszko P, Dimtcheva T, Gurbani M, Toga AW. Asymmetries of Cortical Shape: Effects of Handedness, Sex and Schizophrenia. NeuroImage. 2007;34(3):939–948. doi: 10.1016/j.neuroimage.2006.08.052. [DOI] [PMC free article] [PubMed] [Google Scholar]
- Nichols TE, Holmes AP. Nonparametric permutation tests for functional neuroimaging: A primer with examples. Human Brain Mapping. 2002;15(1):1–25. doi: 10.1002/hbm.1058. 10.1002/hbm.1058. [DOI] [PMC free article] [PubMed] [Google Scholar]
- Park HJ, Westin CF, Kubicki M, Maier SE, Niznikiewicz M, Baer A, Frumin M, Kikinis R, Jolesz FA, McCarley RW, Shenton ME. White matter hemisphere asymmetries in healthy subjects and in schizophrenia: a diffusion tensor MRI study. Neuroimage. 2004;23(1):213–223. doi: 10.1016/j.neuroimage.2004.04.036. [DOI] [PMC free article] [PubMed] [Google Scholar]
- Park HJ, Kubicki M, Shenton ME, Guimond A, McCarley RW, Maier SE, Kikinis R, Jolesz FA, Westin CF. Spatial normalization of diffusion tensor MRI using multiple channels. Neuroimage. 2003;20(4):1995–2009. doi: 10.1016/j.neuroimage.2003.08.008. [DOI] [PMC free article] [PubMed] [Google Scholar]
- Peper JS, Brouwer RM, Boomsma DI, Kahn RS, Hulshoff Pol HE. Genetic influences on human brain structure: a review of brain imaging studies in twins. Human Brain Mapping. 2007;28:464–473. doi: 10.1002/hbm.20398. [DOI] [PMC free article] [PubMed] [Google Scholar]
- Pfefferbaum A, Sulluvan EV, Carmelli D. Genetic regulation of regional microstructure of the corpus callosum in late life. Neuroreport. 2001;12(8):1677–1681. doi: 10.1097/00001756-200106130-00032. [DOI] [PubMed] [Google Scholar]
- Rijsdijk FV, Sham PC. Analytic approaches to twin data using structural equation models. Briefings in Bioinformatics. 2002;3(2):119–133. doi: 10.1093/bib/3.2.119. [DOI] [PubMed] [Google Scholar]
- Rodrigo S, Naggara O, Oppenheim C, Golestani N, Poupon C, Cointepas Y, Mangin JF, Le Bihan DL, Meder JF. Human subinsular asymmetry studied by diffusion tensor imaging and fiber tracking. AJNR. 2007;28(8):1526–1531. doi: 10.3174/ajnr.A0584. [DOI] [PMC free article] [PubMed] [Google Scholar]
- Schmitt JE, Lenroot RK, Wallace GL, Ordaz S, Taylor KN, Kabani N, Greenstein D, Lerch JP, Kendler KS, Neale MC, Giedd JN. Identification of Genetically Mediated Cortical Networks: A Multivariate Study of Pediatric Twins and Siblings. Cereb Cortex. 2008 doi: 10.1093/cercor/bhm211. [DOI] [PMC free article] [PubMed] [Google Scholar]
- Shaywitz BA, Shaywltz SE, Pugh KR, Constable RT, Skudlarski P, Fulbright RK, Bronen RA, Fletcher JM, Shankweiler DP, Katz L, Gore JC. Sex differences in the functional organization of the brain for language. Nature. 1995;373(6515):607–609. doi: 10.1038/373607a0. [DOI] [PubMed] [Google Scholar]
- Smith SM, Jenkinson M, Johansen-Berg H, Rueckert D, Nichols TE, Mackay CE, Watkins KE, Ciccarelli O, Cader MZ, Matthews PM, Behrens TE. Tract-based spatial statistics: voxelwise analysis of multi-subject diffusion data. Neuroimage. 2006;31(4):1487–1505. doi: 10.1016/j.neuroimage.2006.02.024. [DOI] [PubMed] [Google Scholar]
- Sowell ER, Thompson PM, Rex DE, Kornsand DS, Jernigan TL, Toga AW. Mapping Sulcal Pattern Asymmetry and Local Cortical Surface Gray Matter Distribution In Vivo: Maturation in Perisylvian Cortices. Cerebral Cortex. 2002 Jan.12(1):17–26. doi: 10.1093/cercor/12.1.17. 2002. [DOI] [PubMed] [Google Scholar]
- Sowell ER, Thompson PM, Peterson BS, Mattson SN, Welcome SE, Henkenius AL, Riley EP, Jernigan TL, Toga AW. Mapping Cortical Gray Matter Asymmetry Patterns in Adolescents with Heavy Prenatal Alcohol Exposure. Neuroimage. 2002 Dec.17(4):1807–1819. doi: 10.1006/nimg.2002.1328. 2002. [DOI] [PubMed] [Google Scholar]
- Stein JL, Hua X, Morra J, Lee S, Ho AJ, Leow A, Toga AW, Sul J, Kang H, Eskin E, Saykin A, Shen L, Foroud T, Pankratz N, Huentelman M, Craig D, Gerber J, Allen A, Corneveaux J, Stephan D, Webster J, DeChairo B, Potkin S, Jack C, Weiner M, Thompson PM. Genome-wide association study of temporal lobe structure identifies novel quantitative trait loci for neurodegeneration in Alzheimer’s disease. NeuroImage, Special Issue on Imaging Genomics. 2009 March; in press, 2010. [Google Scholar]
- Stein JL, Hua X, Lee S, Ho AJ, Leow AD, Toga AW, Saykin AJ, Shen L, Foroud T, Pankratz N, Huentelman MJ, Craig DW, Gerber JD, Allen A, Corneveaux J, Stephan DA, Webster J, DeChairo BM, Potkin SG, Jack CR, Weiner MW, Thompson PM. Voxelwise Genome-Wide Association Study (vGWAS) NeuroImage, Special Issue on Imaging Genomics. 2010 March; doi: 10.1016/j.neuroimage.2010.02.032. in press, 2010. [DOI] [PMC free article] [PubMed] [Google Scholar]
- Studholme C. Dense feature deformation morphometry: Incorporating DTI data into conventional MRI morphometry. Medical Image Analysis, Volume 12, Issue 6, Special issue on Information Processing in Medical Imaging 2007. 2008 December;:742–751. doi: 10.1016/j.media.2008.03.010. [DOI] [PMC free article] [PubMed] [Google Scholar]
- Styner M, Lieberman JA, McClure R, Weinberger D, Jones D, Gerig G. Morphometric analysis of lateral ventricles in schizophrenia and healthy controls regarding genetic and disease-specific factors. Proc Nat Acad Sci. 2005;102:4872–4877. doi: 10.1073/pnas.0501117102. [DOI] [PMC free article] [PubMed] [Google Scholar]
- Szeszko PR, Vogel J, Ashtari M, Malhotra AK, Bates J, Kane JM, Bilder RM, Frevert T, Lim K. Sex differences in frontal lobe white matter microstructure: a dti study. NeuroReport. 2003;14(18):2469–2473. doi: 10.1097/00001756-200312190-00035. [DOI] [PubMed] [Google Scholar]
- Thirion JP, Prima S, Subsol G, Roberts N. Statistical analysis of normal and abnormal dissymmetry in volumetric medical images. Med Im Analy. 2000;4(2) doi: 10.1016/s1361-8415(00)00012-8. [DOI] [PubMed] [Google Scholar]
- Thompson PM, Lee AD, Dutton RA, Geaga JA, Hayashi KM, Eckert MA, Bellugi U, Galaburda AM, Korenberg JR, Mills DL, Toga AW, Reiss AL. Abnormal Cortical Complexity and Thickness Profiles Mapped in Williams Syndrome. Journal of Neuroscience. 2005 April 20;25(18):4146–4158. doi: 10.1523/JNEUROSCI.0165-05.2005. 2005. [DOI] [PMC free article] [PubMed] [Google Scholar]
- Thompson PM, Hayashi KM, de Zubicaray G, Janke AL, Rose SE, Semple J, Herman D, Hong MS, Dittmer S, Doddrell DM, Toga AW. Dynamics of Gray Matter Loss in Alzheimer’s Disease. Journal of Neuroscience. 2003 Feb. 123(3):994–1005. doi: 10.1523/JNEUROSCI.23-03-00994.2003. 2003. [DOI] [PMC free article] [PubMed] [Google Scholar]
- Thompson PM, Cannon TD, Narr KL, van Erp T, Poutanen VP, Huttunen M, Lonnqvist J, Standertskjold-Nordenstam GG, Kaprio J, Khaledy M, Dail R, Zoumalan CI, Toga AW. Genetic influences on brain structure. Nat Neurosci. 2001;4:1253–1258. doi: 10.1038/nn758. [DOI] [PubMed] [Google Scholar]
- Thompson PM, Moussai J, Khan AA, Zohoori S, Goldkorn A, Mega MS, Small GW, Cummings JL, Toga AW. Cortical Variability and Asymmetry in Normal Aging and Alzheimer's Disease. Cerebral Cortex. 1998 Sept.8(6):492–509. doi: 10.1093/cercor/8.6.492. 1998. [DOI] [PubMed] [Google Scholar]
- Toga AW, Thompson PM. Mapping brain asymmetry. Nature Review Neuroscience. 2003;4(1):37–48. doi: 10.1038/nrn1009. [DOI] [PubMed] [Google Scholar]
- Wakana S, Caprihan A, Panzenboeck MM, Fallon JH, Perry M, Gollub RL, Hua K, Zhang J, Jiang H, Dubey P, Blitz A, van Zijl PCM, Mori S. Reproducibility of quantitative tractography methods applied to cerebral white matter. NeuroImage. 2007;36:630–644. doi: 10.1016/j.neuroimage.2007.02.049. [DOI] [PMC free article] [PubMed] [Google Scholar]
- Wang Q, Seghers D, D’Agostino E, Maes F, Vandermeulen D, Suetens P, Hammers A. IPMI. IPMI; 2005. Construction and validation of mean shape atlas templates for atlas-based brain image segmentation; pp. 689–700. [DOI] [PubMed] [Google Scholar]
- Watkins K, Paus T, Lerch J, Zijdenbos A, Collins D, Neelin P, Taylor J, Worsley K, Evans A. Structural Asymmetries in the Human Brain: a Voxel-based Statistical Analysis of 142 MRI Scans. Cereb. Cortex. 2001;11(9):868–877. doi: 10.1093/cercor/11.9.868. [DOI] [PubMed] [Google Scholar]
- Westerhausen, Renéand Huster RJ, Kreuder F, Wittling W, Schweiger E. Corticospinal tract asymmetries at the level of the internal capsule: Is there an association with handedness? NeuroImage. 2007;37(2):379–386. doi: 10.1016/j.neuroimage.2007.05.047. [DOI] [PubMed] [Google Scholar]
- Wilde EA, McCauley SR, Chu Z, Hunter JV, Bigler ED, Yallampalli R, Wang ZJ, Hanten G, Li X, Ramos MA, Sabir SH, Vasquez AC, Menefee D, Levin HS. Diffusion tensor imaging of hemispheric asymmetries in the developing brain. Journal of Clinical and Experimental Neuropsychology. 2009;31(2):205–218. doi: 10.1080/13803390802098118. [DOI] [PMC free article] [PubMed] [Google Scholar]
- Witelson SF, Kigar DL. Sylvian fissure morphology and asymmetry in men and women: Bilateral differences in relation to handedness in men. Journal of Comparative Neurology. 1992;323:326–340. doi: 10.1002/cne.903230303. [DOI] [PubMed] [Google Scholar]


